Gold Hits 4150 Resistance: Healthy Correction or Reversal?1. What Happened in the Last 24 Hours
Gold delivered an impressive bullish surge of over 1000 pips, reaching the 4150 resistance zone — precisely the level mentioned in yesterday’s analysis. The move was nearly one-directional, with only a brief intraday retracement after crossing above 4100.
2. Market Context
Such a strong advance often leads to short-term exhaustion, and that’s exactly what we’re seeing now. After touching the 4150 resistance, the price has started to pull back, which appears to be a normal correction rather than a trend reversal.
3. Technical Outlook
The first key support for bulls lies near 4075, followed by the 4050 zone, which is now an important structural level. As long as these supports remain intact, the uptrend remains healthy and the probability of another bullish leg is high.
4. Trading Plan
I remain bullish on Gold and plan to buy dips toward 4075–4050 zones. A sustained hold above these levels could open the way for a retest of 4200 resistance in the next sessions.
If the price falls below 4050 with strong momentum, I’ll reassess the bias — but for now, the path of least resistance is still up.
5. Conclusion
Yesterday’s explosive rally confirmed the bullish structure, and today’s pullback looks like a healthy correction within an ongoing trend. As long as 4050–4075 holds, buying dips remains the smart play. 🚀
Signalservice

Gold Momentum Extreme – Shorting Is High-Risk Despite Resistance1. What Happened Yesterday
Despite a weak start to the day that looked like the beginning of a deeper correction after Monday’s strong rally, Gold once again defended the 4100 interim support. Bulls quickly stepped in, and the market delivered yet another 1,000-pip bullish session — a pattern Gold has normalized these days.
2. Current Market Context
At the time of writing, price is hovering around the 4200 resistance zone, and the upside momentum remains extremely strong. Yes, after a 2,000-pip rise in just three days, a correction seems not only possible but probable.
However, we must also remember that last month Gold rallied 4,000 pips in a single week without any meaningful pullback — making short-term timing very tricky.
3. Technical Outlook
Key support levels to watch:
- 4150 – first intraday support
- 4100 – strong structural level
- 4050 – major swing support and line in the sand for bulls
Resistance levels:
- 4200 – current zone being tested
- 4280 – next clear target
- 4400 – all-time-high resistance
The structure remains bullish, but stretched.
4. Trading Plan
For swing traders, this is a difficult location to initiate new positions in either direction.
I personally prefer to buy only if Gold pulls back under 4100, where the risk-reward becomes more reasonable.
As for short trades, the combination of strong momentum and last month’s parabolic behavior makes them very high risk, even in strong resistance.
5. Conclusion
Gold remains in a powerful uptrend, and although a correction is likely, timing it is extremely challenging. Until we see a deeper pullback, I remain patient and only consider buys from lower support zones, preferably below 4100. 🚀

AUDUSD FRGNT Daily Forecast & Full Pre LDN Open Breakdown Q4 W46📅 Q4 | W46 | D13 | Y25 |
📊 AUDUSD FRGNT Daily Forecast & Full Pre LDN Open Breakdown
🔍 Analysis Approach:
I’m applying Smart Money Concepts, focusing on:
Identifying Points of Interest on the Higher Time Frames (HTFs) 🕰️
Using those POIs to define a clear trading range 📐
Refining those zones on Lower Time Frames (LTFs) 🔎
Waiting for a Break of Structure (BoS) for confirmation ✅
This method allows me to stay precise, disciplined, and aligned with the market narrative, rather than chasing price.
💡 My Motto:
"Capital management, discipline, and consistency in your trading edge."
A positive risk-to-reward ratio, paired with a high win rate, is the backbone of any solid trading plan 📈🔐
⚠️ Losses?
They’re part of the mathematical game of trading 🎲
They don’t define you — they’re necessary, they happen, and we move forward 📊➡️
🙏 I appreciate you taking the time to review my Daily Forecast.
Stay sharp, stay consistent, and protect your capital
— FRNGT 🚀
OANDA:AUDUSD

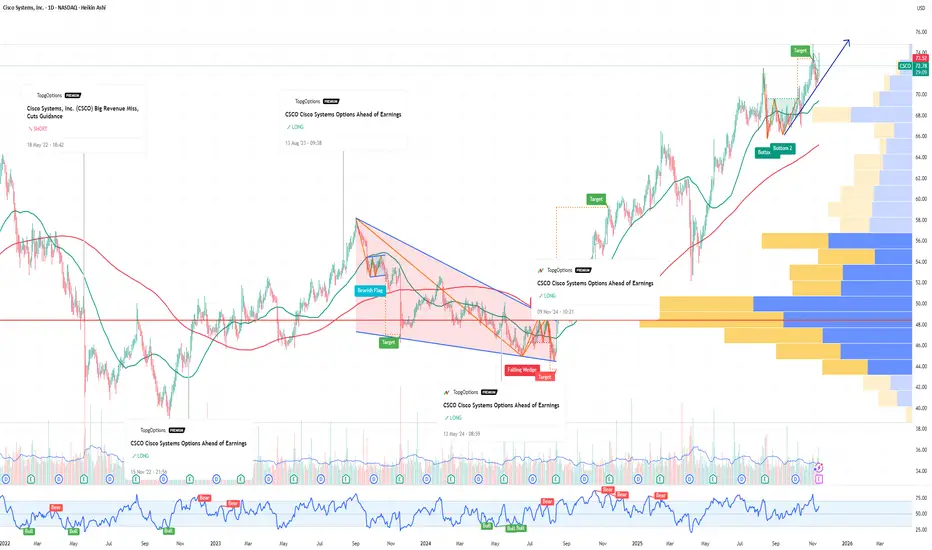
CSCO Cisco Systems Options Ahead of EarningsIf you haven`t bought CSCO before the previous earnings:
Now analyzing the options chain and the chart patterns of CSCO Cisco Systems prior to the earnings report this week,
I would consider purchasing the 74usd strike price Calls with
an expiration date of 2025-11-14,
for a premium of approximately $1.75.
If these options prove to be profitable prior to the earnings release, I would sell at least half of them.
GOLD | RSI Hidden bull divs | GTradingMethodHello Traders,
It’s been a while since my last post — I’ve been focusing more on trading execution than building the brand.
But what a chart to come back with… who went long on Gold today?
🧐 Market Overview:
Gold has been consolidating since the strong leg up on the 5th of November, forming a textbook bull flag. Today’s breakout came with a great piece of confluence - Hidden bullish RSI divergence. Price created higher lows while RSI printed lower lows (check the red markings on RSI and price).
📊 Trade Plan:
Already long from this setup.
If price pulls back for a clean retest of the flag breakout, I’ll be adding more longs.
💡 GTradingMethod Tip:
Hidden divergence is one of the strongest continuation signals. It doesn’t predict reversal — it confirms trend strength. Pair it with a pattern like a bull flag and you’ve got a high-probability structure.
🙏 Thanks for checking out my post!
Make sure to follow me to catch the next idea and please share your thoughts — I’d love to hear what your thoughts on gold are?
📌 Please note:
This is not financial advice. This content is to track my trading journey and for educational purposes only.

Lingrid | EURCAD Descending Market Structure ContinuesFX:EURCAD faced rejection at the descending trendline near 1.6300 after an impulsive leg upward, confirming resistance within the broader bearish structure. The market remains trapped inside a downward channel, forming consistent lower highs as sellers defend key zones. As long as price stays below 1.6250, a decline toward the 1.6135–1.6100 support level is expected. This corrective setup aligns with the dominant downtrend continuation phase from the October highs.
⚠️ Risks:
A break above 1.6250 could shift sentiment short-term bullish.
Stronger Eurozone inflation data may strengthen the euro.
Weak Canadian employment figures could reduce CAD demand and limit downside.
If this idea resonates with you or you have your own opinion, traders, hit the comments. I’m excited to read your thoughts!

Short-term gold trading plan: buy low and sell highAfter a surge on Monday, gold prices traded sideways at high levels yesterday and today. This sudden shift in momentum was primarily due to news that the US government might end its shutdown.
On the surface, an end to the shutdown implies a crisis easing, which is typically beneficial for the US dollar and detrimental to gold. Therefore, in the short term, gold's upward momentum will likely be suppressed, potentially leading to a correction.
From a technical perspective, gold prices are currently oscillating between 4100 and 4150. The price has tested the 4150 resistance level three times since yesterday and failed to break through, indicating that this has become a key resistance level. The 4100 level has also been tested twice, suggesting strong support. Therefore, short-term trading should focus on buying low and selling high within the 4100-4150 range.
If gold prices break out of this range, we will need to revise our trading plan.
Markets are volatile, and with frequent news events expected soon, it is crucial to set stop-loss and take-profit orders to avoid getting trapped in a losing position.

Lingrid | GOLD Possible False Breakout - Correction Setup OANDA:XAUUSD has extended its rally after a clean breakout from the range zone, now testing a confluence area near 4,155 within the resistance zone. The structure forms a steep upward channel with a potential short-term exhaustion pattern near the upper boundary. If price fails to sustain above 4,150, a corrective pullback toward 4,065–4,000 could unfold. The broader momentum remains bullish but stretched, suggesting a possible pause before continuation.
⚠️ Risks:
A breakout above 4,150 could accelerate momentum toward 4,220.
Softer U.S. inflation data may weaken USD and fuel further gold demand.
Rising geopolitical tensions could boost safe-haven inflows, invalidating pullback scenarios.
If this idea resonates with you or you have your own opinion, traders, hit the comments. I’m excited to read your thoughts!

Lingrid | TAOUSDT Support Zone Dip Buy OpportunityBINANCE:TAOUSDT is rebounding from the support level after a compression pattern near the lower boundary of the structure. Price is forming a contracting range with higher lows suggesting early accumulation within the broader ascending structure. A confirmed breakout above 380 could open the path toward 440. A bullish continuation remains favored while 330 holds as structural support.
⚠️ Risks:
A breakdown below 330 could invalidate the bullish bias.
Weak market momentum or Bitcoin correction could limit upside extension.
Rejection near 400 might trigger another retest of the support base.
If this idea resonates with you or you have your own opinion, traders, hit the comments. I’m excited to read your thoughts!

After Multiple 4150 Rejections, Gold Eyes Support at 40501. What Happened Yesterday
After an intraday correction, Gold once again tested the 4150 resistance zone, then pulled back toward 4100, only to rebound and touch 4150 again later in the session. Each attempt to break higher was rejected, sending the price back toward interim support.
2. Market Context
Multiple failed breaks above 4150 suggest that the market is not yet ready to extend the rally from Monday. The current price action points to a likely continuation of the correction, as the market digests the strong bullish move from earlier in the week.
3. Technical Outlook
The 4045–4060 zone stands out as a key confluence support, aligning with previous resistance and short-term rising trend line. A dip into this area would be a healthy pullback within the broader uptrend and could attract renewed buying interest from bulls.
4. Trading Plan
My preferred approach is to buy dips into 4045–4060, with invalidation below 4030. This setup offers an attractive risk-reward profile, targeting a retest of 4150 on the next bullish leg.
As long as the support zone holds, the bullish structure remains intact and upside continuation remains the higher-probability scenario.
5. Conclusion
Gold is consolidating after its sharp rally, and short-term correction is part of the process. I remain bullish above 4040-4050 zone, expecting buyers to step back in near support and potentially push for another test of 4150 soon. 🚀

Is gold about to return to a bullish trend?On Monday, the US dollar index remained below the 100 level as signs that the US government might resume operations boosted market risk sentiment.
Spot gold rebounded sharply, surging over $100 intraday and returning above $4100, reaching a new high in over two weeks.
So far, gold has reached a high near $4150.
Looking at the hourly chart:
The two most crucial support levels for gold are currently around 4120-4115 and the $4000 level.
The 4120-4115 level coincides with the hourly moving average (MA20), and 4115 is also the opening price today. Therefore, if it holds above this level, gold is likely to maintain a consolidation and upward trend today.
Secondly, there's the $4000 level, which is the hourly MA30. It's possible that the price might break through the MA20 and directly reach the MA30.
Therefore, I think it's best to wait until at least 4120-4115 before considering long positions.
If the price breaks through the morning high of 4150, it may continue to reach the high near 4180.

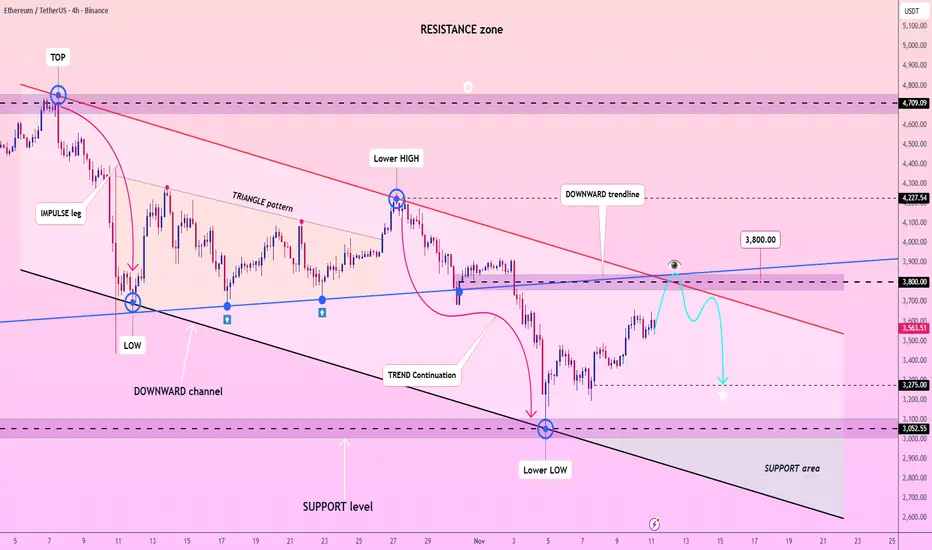
Lingrid | ETHUSDT Pullback Sell Downside ExtensionBINANCE:ETHUSDT is approaching the $3,800 resistance after testing the lower boundary of the downward channel. The market structure forms a clear lower-high sequence beneath a descending trendline, confirming the persistence of bearish pressure. As long as the price remains below $3,800 and inside the channel, bearish movement toward the $3,275–$3,100 support area remains likely. This corrective phase reflects a broader continuation of the bearish trend that began near the $4,700 resistance zone.
⚠️ Risks:
A break above $3,800 could invalidate the bearish setup.
Softer U.S. inflation data could weaken the dollar and lift crypto sentiment.
Unexpected strength in Ethereum network activity may trigger a rebound rally.
If this idea resonates with you or you have your own opinion, traders, hit the comments. I’m excited to read your thoughts!
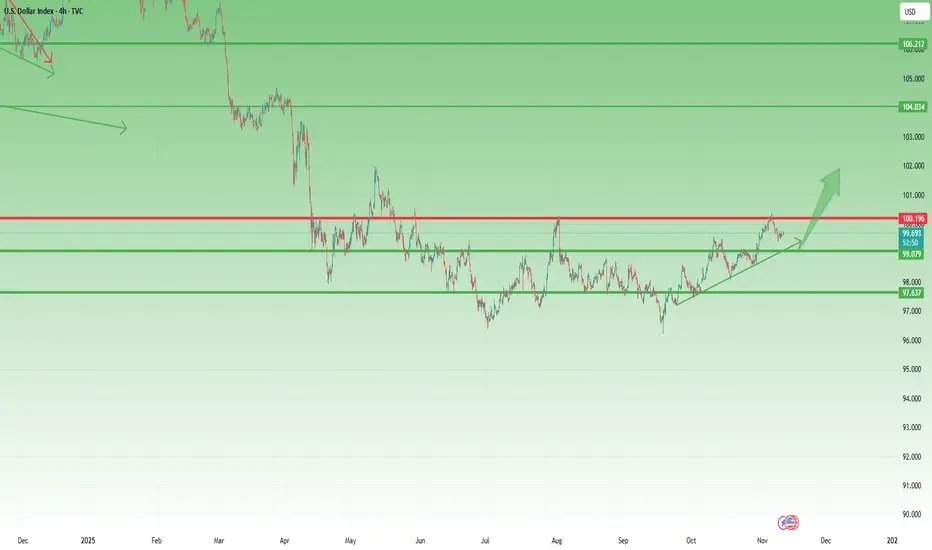
DXY Pulls Back from 100 – A Healthy Correction, Not a Reversal1. What Happened Since Last Week
In last week’s DXY analysis, I warned that although the U.S. Dollar Index remains in a broader uptrend, the 100.00 level represents both a strong technical and psychological resistance that could trigger a short-term retracement.
That scenario played out almost perfectly — after a brief spike above 100, DXY rolled over and is now trading near 99.70.
2. Market Context
The pullback so far looks orderly, not impulsive, suggesting that this move is a correction within an ongoing bullish structure, rather than the start of a major reversal. The market is simply digesting gains after a move higher.
3. Technical Outlook
The area between 99.00 and 99.20 stands out as a key confluence support zone, combining horizontal structure with the up trend line. This is where I expect buyers to reemerge if the index continues to drift lower.
4. Trading Plan
If DXY dips into 99.00–99.20, I’ll look for signs of USD strength resuming — specifically by considering short setups on GBP/USD and EUR/USD.
5. Conclusion
The dollar remains in an uptrend, and this pullback appears to be healthy, not bearish. As long as DXY holds above 99.00, the broader bullish bias remains intact, and traders should prepare for a possible rebound in the next sessions. 💵
Silver Builds Momentum: Break Above 49.50 in Sight1. What Happened Recently
After rebounding from the 45.50 recent low, Silver rallied strongly into the 49.30–49.50 resistance zone, where it faced short-term selling pressure. A healthy correction followed, taking price back to the 47.00 support area.
2. Market Reaction
From that zone, bulls stepped back in. Since Wednesday last week, the market has been climbing in a constructive and steady manner, suggesting that the correction phase might be complete.
3. Technical Outlook
At the time of writing, Silver is attempting to break above the 49.30–49.50 resistance. If successful, this move could trigger a continuation toward the 50.50 zone, which represents the next meaningful resistance on the chart.
The broader structure remains bullish as long as price stays above 48.00, while dips below 49.00 offer good buying opportunities within the trend.
4. Trading Plan
My preferred approach is to buy dips under 49, with a protective invalidation under 48. First profit targets lie near 50.50, with potential extensions if momentum persists.
5. Conclusion
Momentum has shifted firmly back in favor of the bulls. As long as 48 holds, Silver remains in a bullish phase, and buying dips is the rational play. ⚡️

Hellena | SPX500 (4H): LONG to max of wave "3" area of 6929.4.Good afternoon colleagues, it looks like the correction is ending and soon I expect wave “5” in the upward movement. Perhaps wave “4” will update the low of 6637.8 before the upward movement.
I expect to reach the maximum of wave “3” at 6929.4. Further we will observe the price behavior in this area.
Fundamental Background
The US stock market remains positive: business activity data showed a steady expansion, which strengthens confidence in corporate earnings.
Manage your capital correctly and competently! Only enter trades based on reliable patterns!

Gold Finally Moves —Breakout Above 4020 Signals Bullish Momentum1. What Happened Last Week
Gold has spent most of last week consolidating in a narrow range 3960 and 4020, with only a short-lived downside spike on Wednesday. This range reflected market indecision , as traders waited for a clearer direction.
2. What’s Happening Now
The Asian session open this week brought the first meaningful breakout in days — price moved decisively above 4020 resistance and is now holding around the 4050 zone. This is the first clean bullish signal after multiple failed attempts last week.
3. Technical Outlook
From a technical perspective, the breakout opens room for an upside continuation. The next major target for buyers stands around the 4150 resistance.
As long as the 4000 level remains intact, bulls retain full control. That zone now acts as the line in the sand for short-term momentum.
4. Trading Plan
My plan is to buy dips near support and targets near 4150.
If the market closes back below 4000, the bullish bias would weaken, signaling a potential false breakout.
5. Conclusion
Gold has finally chosen direction — and as long as we stay above 4k, buying dips remains the smart play. The next few sessions will confirm if bulls have the strength to push toward 4150. 🚀

Lingrid | GOLD Weekly Market Outlook: Sell the SpikesOANDA:XAUUSD parabolic October rally has stalled, giving way to a sharp corrective phase. This signals waning momentum and the potential start of a deeper pullback. With price now testing key support near $4,000, the market is at a critical juncture: failure to hold this zone opens the door to targets at $3,890 and potentially $3,850.
The 4H structure reinforces the bearish bias, as price bounces into a descending trendline acting as dynamic resistance. Any rally toward the $4,050–$4,100 zone is likely a shorting opportunity, not a bullish reversal. This area aligns with the 1.272 Fibonacci extension of the recent swing. A decisive break below $3,950 would confirm bearish continuation and likely accelerate selling pressure following channel breakout.
Fundamentally, uncertainty surrounding the US government shutdown continues to fuel risk-off sentiment, supporting the dollar and pressuring gold. Possibly, this corrective phase will persist until the shutdown threat is resolved. Until then, the path of least resistance remains down. We should avoid chasing rebounds and instead focus on disciplined short entries on rallies, with tight risk controls. The bull isn’t dead—but for now, it seems the bears are in charge.
If this idea resonates with you or you have your own opinion, traders, hit the comments. I’m excited to read your thoughts!

Lingrid | BTCUSDT Shorting Opportunity From Confluence AreaThe price perfectly fulfilled my previous idea . BINANCE:BTCUSDT is struggling below the 109,000 resistance zone after a sharp rebound from 99,000. The structure forms a descending channel, with price approaching a key confluence between the upward and downward trendlines. If the level near 109,200 holds, the market could resume its decline toward 102,250 support. Bearish continuation remains favored while the lower high structure is intact.
⚠️ Risks:
A break above 109,800 could trigger short covering and invalidate the bearish setup.
Softer U.S. inflation data or dovish Fed comments could lift sentiment.
Rising ETF inflows might strengthen spot demand for Bitcoin.
If this idea resonates with you or you have your own opinion, traders, hit the comments. I’m excited to read your thoughts!

Hellena | GOLD (1H): SHORT to support area 3925.Colleagues, I believe that at the moment we see a rather complicated situation - the correction is not over yet and we may see a complicated correction. In most probability I see the completion of wave “B”, and the continuation of the downward movement to the support area of 3925.
The “ABC” correction may be completed this week. In any case, I expect the decline to continue.
Manage your capital correctly and competently! Only enter trades based on reliable patterns!

Lingrid | SHIBUSDT Market Consolidation ContinuesThe price perfectly fulfilled my previous idea . BINANCE:SHIBUSDT rejected from the upper boundary of its descending structure, continuing to trade within a well-defined bearish channel. The price structure shows repeated lower lows and consolidations inside a mid-range zone under the downward trendline. If CRYPTOCAP:SHIB fails to close above 0.00001100, selling pressure could extend toward 0.00000835.Overall momentum remains bearish with no strong reversal signs yet.
⚠️ Risks:
A sudden breakout above the descending trendline could invalidate short bias.
Positive macro data or Bitcoin strength may trigger risk-on sentiment and lift altcoins.
Oversold conditions could lead to a temporary corrective rebound before further decline.
If this idea resonates with you or you have your own opinion, traders, hit the comments. I’m excited to read your thoughts!

Lingrid | GBPNZD Short After Rejection of Channel ResistanceFX:GBPNZD is approaching the upper boundary of its consolidation range after a sharp rebound from the support level near 2.28. A descending resistance trendline aligns with the 2.34–2.36 zone, forming a potential rejection area. If price fails to break through, a retracement toward 2.32 could follow. Overall, the market structure still suggests a corrective move inside a broad descending channel.
⚠️ Risks:
Unexpected dovish tone from the Bank of England could strengthen NZD.
A breakout above 2.3650 would invalidate the short-term bearish outlook.
Shifts in global risk sentiment could trigger volatility in GBP pairs.
If this idea resonates with you or you have your own opinion, traders, hit the comments. I’m excited to read your thoughts!

Lingrid | GBPJPY Demand Support Long OpportunityFX:GBPJPY is showing a potential short-term rebound setup after rejecting the support zone near 198.70. Price action remains inside a broad descending channel but has reached the confluence of the lower boundary and prior breakout zone, which often attracts dip buyers. A minor recovery toward 201.00 resistance could unfold before sellers attempt to resume the broader downtrend. This structure signals a corrective bullish phase within the bearish bias.
⚠️ Risks:
Unexpected hawkish comments from the Bank of Japan could trigger JPY strength and accelerate declines.
Rising U.K. bond yields might temporarily boost GBP demand, distorting short-term setups.
Failure to hold 198.70 support could expose 197.00 and extend the bearish continuation.
If this idea resonates with you or you have your own opinion, traders, hit the comments. I’m excited to read your thoughts!

Lingrid | XRPUSDT Downside Pressure AcceleratingBINANCE:XRPUSDT trades below the descending trendline inside a clearly defined downward channel, keeping the broader structure bearish. Price action has recently tested the $2.44 zone but failed to sustain a breakout, signaling continued weakness. As long as the pair stays under $2.50 resistance, a retest toward $2.00 support remains the likely path. Momentum indicators align with a slow drift lower, reinforcing short-term bearish control.
⚠️ Risks:
A sudden Bitcoin rally could lift altcoins and negate the bearish setup.
Positive regulatory news around XRP may trigger unexpected volatility.
U.S. macro data or risk sentiment shifts could strengthen USD demand dynamics.
If this idea resonates with you or you have your own opinion, traders, hit the comments. I’m excited to read your thoughts!
