Daily Bitcoin Signal: Sell Now , target 110,500Bitcoin is currently showing signs of strength as it tests the key resistance level around 113,000.
A confirmed 1H candle breakout this zone could trigger fresh bearish momentum, opening the door for lower targets in the short term.
My Personal Long Setup
Entry : Sell Now from current Price 112,900
🎯 Target 1: 111,900
🎯 Target 2: 110,600
❌ Stop-loss: 115,500
👍 Don’t forget to boost this trading idea if you found it helpful,
and follow me for more daily crypto insights and trade signals.
⚠️ Please note:
This is not financial advice – I’m only sharing my personal trades.
Always do your own research before taking action.
Best of luck 🌹
Signalsprovider

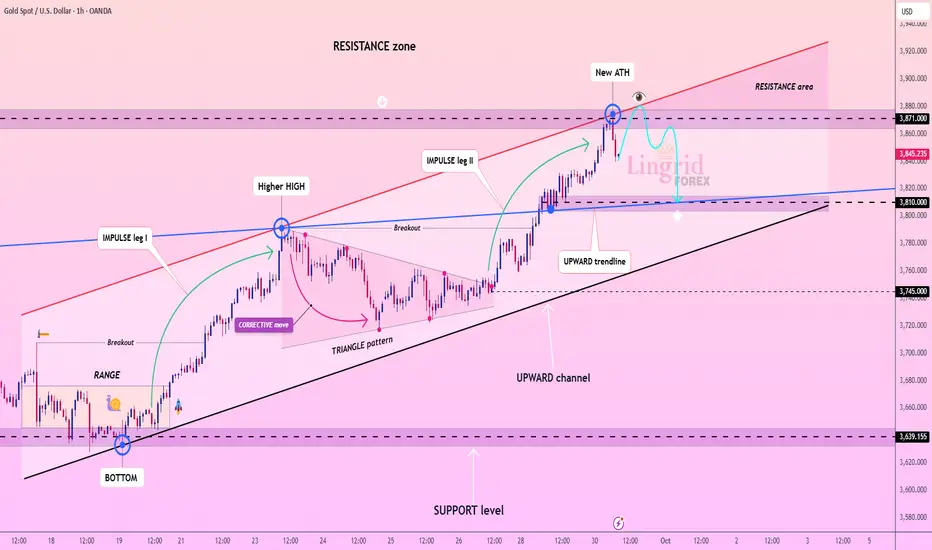
Lingrid | GOLD Price Surge Cooling Short-Term PullbackThe price perfectly fulfilled my previous idea . OANDA:XAUUSD has printed a new ATH near 3,870 after completing two strong impulse legs within the upward channel. Price action is showing signs of exhaustion at the resistance zone, suggesting a short-term retracement phase is underway. A pullback toward 3,800 support is possible before any fresh attempt higher. The broader structure still favors bullish continuation as long as the channel trendline holds.
⚠️ Risks:
A sustained breakout above 3,870 could invalidate the retracement outlook.
U.S. economic data could shift sentiment abruptly.
Rising Treasury yields may cap gold’s upside momentum in the near term.
If this idea resonates with you or you have your own opinion, traders, hit the comments. I’m excited to read your thoughts!
Lingrid | EURJPY Trendline Violation Downside MoveThe price perfectly fulfilled my previous idea . FX:EURJPY has reached the resistance zone near 175.000 after a strong upward channel move from the bottom at 171.130. Price action shows consolidation just below the top, with a corrective projection suggesting a pullback. If the pair fails to hold above 174.500, a decline toward 173.150 support could unfold since it broke and closed below the upward trendline. Broader picture suggest that market reached previous year high that may lead to short-term pullback.
⚠️ Risks:
Breakout above 175.000 would invalidate the pullback and extend bullish momentum.
Unexpected ECB or BoJ policy comments could trigger sharp volatility.
Stronger yen flows from risk-off sentiment may accelerate downside pressure.
If this idea resonates with you or you have your own opinion, traders, hit the comments. I’m excited to read your thoughts!

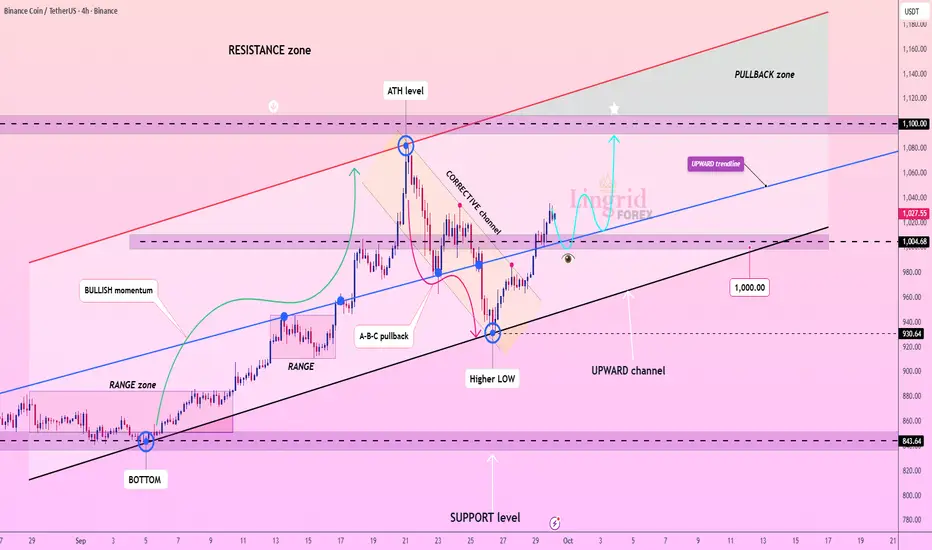
Lingrid | BNBUSDT Targeting ATH Level After PullbackThe price perfectly fulfilled my previous idea . BINANCE:BNBUSDT is trading inside an upward channel after a corrective pullback from the ATH level near 1,080. Price action shows a rebound from a higher low around 1,000, confirming structural support. If buyers defend the 1,000–1,010 zone, momentum could extend toward the pullback area at 1,100+. Broader context supports bullish continuation as long as the channel trendline holds.
⚠️ Risks:
Failure to maintain above 1,000 could invite deeper correction toward 930 support.
Strong USD strength or negative market sentiment may weigh on upside.
Macro-driven volatility around regulatory or Binance-related news could trigger sharp moves
If this idea resonates with you or you have your own opinion, traders, hit the comments. I’m excited to read your thoughts!
Daily Bitcoin Signal: Sell , target 110KBitcoin is currently showing signs of strength as it tests the key resistance level around 113,500.
A confirmed 1H candle breakout this zone could trigger fresh bearish momentum, opening the door for lower targets in the short term.
My Personal Long Setup
If the price breaks and closes a 1H candle under 113,500, I will enter a sell position.
🎯 Target 1: 112,000
🎯 Target 2: 110,000
❌ Stop-loss: 115,200
👍 Don’t forget to boost this trading idea if you found it helpful,
and follow me for more daily crypto insights and trade setups.
⚠️ Please note:
This is not financial advice – I’m only sharing my personal trades.
Always do your own research before taking action.
Best of luck 🌹

Ethereum Elliott Wave Daily Analysis : Target 4500Ethereum (Timeframe: 4H)
1. Price Action & Trend
The chart shows a completed bearish wave that ended around zone (i) near the $3,700 level.
From this point, Ethereum started a clear upward move with strong bullish candles, suggesting the beginning of a new impulsive wave according to Elliott Wave Theory.
The first expected target for the current move is the key resistance area at $4,500, which represents a major technical level (the previous high .. clear horizontal line).
2. Support & Resistance
Nearest Support: $3,950 – $4,000 pivot zone of the latest bullish move.
Main Resistance: $4,500 both psychological and technical barrier.
3. Supporting Indicators
Momentum: The strong bullish candles reflect renewed buying demand.
Short-Term Trend: Bullish as long as price holds above $4,000.
✍️ Conclusion:
Analysis suggests that Ethereum is in the process of extending its bullish wave, potentially targeting the $4,500 zone in the coming sessions.
Any corrective pullback toward $4,000 remains a critical level to watch
👍 Don’t forget to boost this trading idea if you found it helpful,
and follow me for more daily crypto insights and trade signals.
Please note:
This is not financial advice – I’m only sharing my personal trades.
Always do your own research before taking action.
Best of luck 🌹

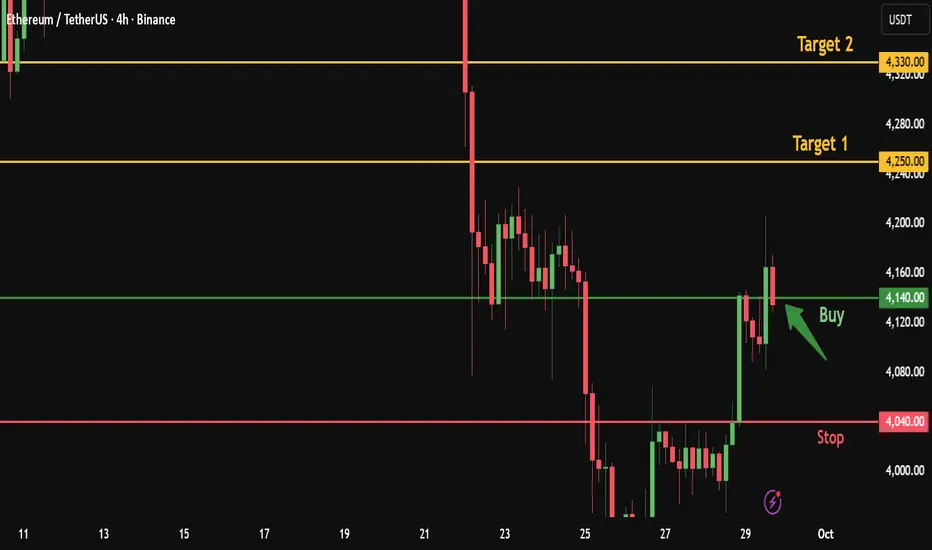
Ethereum Quick Buy from Broken Resistance – Targeting 4330After Ethereum broke the 4140 resistance with a bullish 4H candle and reached 4205, the price has now retested the broken resistance at 4140.
This level acts as a strong entry point for a long position, aiming for higher targets.
Here’s my personal trade plan:
✅ Entry : Buy from current price 4140
🎯 Target 1: 4250
🎯 Target 2: 4330
Stop-loss: 4040
👍 Don’t forget to boost this trading idea if you found it helpful,
and follow me for more daily crypto insights and trade signals.
Please note:
This is not financial advice – I’m only sharing my personal trades.
Always do your own research before taking action.
Best of luck 🌹
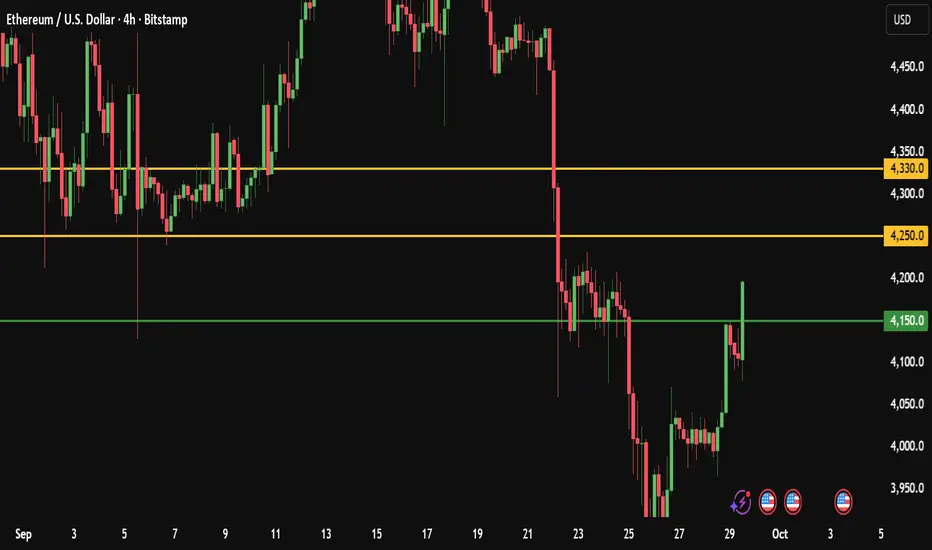
Ethereum Daily Technical Signal: Buy and Target 4330Ethereum Daily Technical Analysis
Ethereum is currently showing signs of strength as it tests the key resistance level around 4150.
A confirmed 4H candle breakout above this zone could trigger fresh bullish momentum, opening the door for higher targets in the short term.
My Personal Long Setup
If the price breaks and closes a 4H candle above 4150, I will enter a long position.
🎯 Target 1: 4250
🎯 Target 2: 4330
❌ Stop-loss: 4040
👍 Don’t forget to boost this trading idea if you found it helpful,
and follow me for more daily crypto insights and trade setups.
⚠️ Please note:
This is not financial advice – I’m only sharing my personal trades.
Always do your own research before taking action.
Best of luck 🌹
NASDAQ | Diagonal resistance | GTradingmethodGood morning Traders,
I hope everyone has had a winning week so far :)
The US100 is sitting at a pivotal point. Price is currently at all-time highs but also testing two key diagonal resistance levels — one medium-term and one short-term. These resistance lines are intersecting right now, which adds extra weight to this resistance zone.
The big question:
👉 Will the US100 break through resistance and push higher into uncharted territory, or are we about to see a short-term correction from here?
📊 Trade Plan:
Not entering a trade just yet — waiting for confirmation of either a breakout with retest or rejection and reversal.
Very keen to hear what everyone thinks, let me know please :)
Peace
G

Lingrid | GOLD Weekly Outlook: The $3,800 Battle Royale BeginsThe price perfectly fulfilled my previous weekly idea . OANDA:XAUUSD maintains its relentless upward trajectory, with persistent buying interest emerging on every meaningful decline. The precious metal has transformed into a premium "buy the dip" opportunity, reflecting underlying strength that continues to attract investors.
The technical picture reveals that gold is trading the support zone around $3,760, having successfully broken out of its previous range. The upward channel structure remains intact, supported by a robust trendline that has guided the rally from the $3,400 level. The re-accumulation phase visible in the charts suggests institutional positioning ahead of the next leg higher.
However, the market may be approaching a temporary consolidation phase. The 1H chart indicates potential for a 2-10% pullback toward the $3,720 - $3,710 support zone like it did before, and this area would align with the 50% Fibonacci retracement level. This healthy correction could provide an excellent optimal entry opportunity for late buyers.
The psychological $3,800 level may serve as a consolidation floor, creating the foundation for gold's next assault on higher targets. With the upward momentum firmly established and technical indicators showing bullish structure, any weakness should be viewed as a strategic accumulation opportunity rather than a trend reversal. The long-term trajectory remains decidedly bullish until the price action will show otherwise.
If this idea resonates with you or you have your own opinion, traders, hit the comments. I’m excited to read your thoughts!

Lingrid | BTCUSDT Support Hold Bottom Bounce PlayBINANCE:BTCUSDT is stabilizing after setting a higher low near 110k, signaling demand at the support trendline. Price action shows a corrective phase following the prior range breakout, with structure now coiling just above 110,760 support level. A recovery above this zone could trigger momentum toward the 114,500 resistance area and higher levels. Broader context suggests consolidation within the upward structure, leaving room for a rebound attempt if buyers defend key levels.
⚠️ Risks:
Breakdown below 109,000 would reopen downside toward 107,000 support.
Strong dollar strength or macro headwinds could cap crypto momentum.
Failure to retake 112.5k may keep CRYPTOCAP:BTC stuck in a corrective range.
If this idea resonates with you or you have your own opinion, traders, hit the comments. I’m excited to read your thoughts!

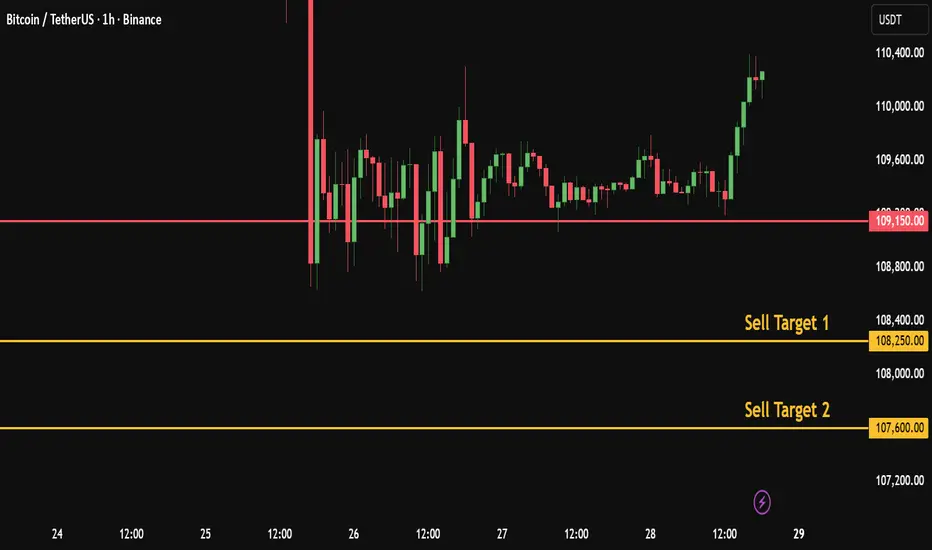
Daily Bitcoin Signal: Watching the 109K Breakout, target 107KBitcoin Daily Numeric Analysis
Based on my numeric analysis, Bitcoin is showing potential weakness near key support.
If price breaks and closes a 1H candle below 109,150, I will enter a short trade.
My Personal Short Setup
🎯 Target 1: 108,250
🎯 Target 2: 107,500
❌ Stop-loss: 110,600
👍 Don’t forget to boost this trading idea if you found it helpful,
and follow me for more daily crypto insights and trade setups.
Please note:
This is not financial advice – I’m only sharing my personal trades.
Always do your own research before taking action.
Best of luck 🌹
GBPUSD Short/Sell SignalThoughts and Analysis: Sterling’s running out of gas, plain and simple. My chart analysis is screaming weakness due for a short and we’ve got a classic rejection at the 1.346–1.350 zone, the kind of level that turns dreamers into bag-holders. Price lost the short-term moving average and can’t reclaim it. Sellers are defending that ceiling, and unless the market rips clean through it, the path of least resistance is down first to 1.3200, then to the psychological 1.3000 line in the sand.
GBPUSD Fundamentals: They’re pouring fuel on this fire. The dollar’s got wind at its back with U.S. growth and spending numbers keep defying gravity, pushing out rate-cut expectations and keeping Treasuries bid. Across the pond, the UK’s looking shaky: inflation refuses to die, the BoE’s stuck in a corner, and gilt yields are exploding like it’s 2022 all over again. Recent U.S. data revisions and spending figures have shown resilience (upgraded Q2 GDP and stronger consumer spending) which has supported the dollar recently and made Fed rate-cut expectations more cautious. A stronger dollar or higher UST yields is a direct headwind for GBPUSD. Positioning only sharpens the knife. Big boy desks are leaning bearish with Nomura and others are calling for a slide into the low-1.30s. When the smart money’s already stacking chips on the short side.
Key support zones: TP1 is set at 1.3200 lines up with a prior congestion/swing area (previous rejection / swing low), and TP2 hovering at 1.2998–1.3000 is a psychologically and structurally important zone (round number + prior multi-touch support area). Those are reasonable first targets if momentum continues.
Momentum confirmation: short-term oscillators on this sort of price action tend to stay bearish while the shorter MA is resistance and price closes under it; OANDA/desk technical notes have recently highlighted similar short-term bearish bias and 1.3315–1.3280 as next pivots.
So here’s the trade: short the rejection, stop just above 1.3475, let the first leg bleed into 1.3200, and ride the momentum to 1.3000 if the floor gives way. That’s a clean two-, three-to-one reward profile. Don’t overcomplicate it. The story is simple: sterling’s tired, the dollar’s strong, the bond market’s flashing red, and the technicals are setting up a textbook short.

Lingrid | DOGEUSDT Buy at Potential Demand ZoneBINANCE:DOGEUSDT is testing the critical support level around 0.22900 after a significant -28% retracement from its recent highs near the resistance zone. The price action shows a completed triangle pattern breakout that led to bullish momentum, followed by a corrective move that has brought the pair back to test the lower boundary of the trading range. A sustained hold above the 0.22000 psychological level could signal renewed buying interest and potential for another leg higher toward the resistance zone.
💡 Risks:
Break below 0.22000 support could trigger further downside toward the 0.18810 price rebound level
Triangle pattern failure if price cannot reclaim higher ground within the established range
Broader crypto market weakness could pressure DOGE regardless of technical setup
If this idea resonates with you or you have your own opinion, traders, hit the comments. I’m excited to read your thoughts!

BTCUSD Short/Sell SignalBitcoin (BTC/USD) – Tactical Short/Sell Positioning Framework
From a technical perspective, Bitcoin is currently presenting a compelling short-side opportunity as the structure unfolds. After multiple failed attempts to sustain momentum above the $110,000 handle, price action has carved out a sequence of lower highs and retests of the same horizontal zone, a classic sign of weakening bullish conviction and potential distribution at elevated levels.
The current chart reveals several critical dynamics:
1. Stop-Loss Placement (Risk Management Discipline)
A prudent protective stop (SL) I have set at $112,800, just above recent resistance. This ensures adverse upside volatility is capped while preserving favorable risk-to-reward asymmetry.
2. Initial Breakdown Trigger
Bitcoin’s repeated interactions with the 200-day moving average highlight the significance of this level as both psychological and structural support. A clean break beneath it could catalyze accelerated downside flows, inviting systematic selling and liquidations.
3. Downside Targets (Profit Objectives)
Take Profit 1 (TP1): $100,070
This marks the first tactical support level, aligning with prior consolidation and offering a conservative initial profit capture.
Take Profit 2 (TP2): $89,566
A more ambitious level, representing the mid-range support where prior accumulation took place. A breach of this zone would likely confirm a broader bearish continuation pattern.
Take Profit 3 (TP3): $76,193
The ultimate downside objective in this framework, corresponding to deep structural support. Achieving this would imply a full retracement of the bullish leg initiated earlier in the year.
4. Strategic Interpretation
This sequence of measured downside targets aligns with a tiered scaling-out methodology, ensuring that profits are progressively locked in as price declines. Such an approach maximizes capital efficiency while allowing flexibility to ride the broader bearish trend should momentum persist.
My Conclusion
The technical confluence of repeated resistance rejection, weakening market structure, and clear downside liquidity targets positions Bitcoin as a sophisticated short candidate at current levels. Risk is well-contained above $112,800, while downside projections toward $100K, $89.5K, and ultimately $76K create a compelling asymmetric opportunity.

Lingrid | GOLD Retracement Complete Potential ContinuationOANDA:XAUUSD pulled back after hitting the 3,790 resistance but continues to respect the upward trendline and channel structure. Price action shows a trend continuation setup with consolidation zones acting as mid-support. As long as 3,730 holds, buyers may attempt another push toward the 3,800 and higher resistance zone. Overall momentum remains bullish, supported by higher lows and sustained channel direction.
⚠️ Risks:
Failure to hold 3,730 could trigger a deeper correction toward 3,700 support.
Strong USD recovery on economic data like GDP may weigh on gold prices.
Sudden shifts in bond yields could reduce safe-haven demand.
If this idea resonates with you or you have your own opinion, traders, hit the comments. I’m excited to read your thoughts!

Lingrid | GBPUSD Follow Through Trade Setup ReadyFX:GBPUSD continues its decline after rejection from the resistance zone, following a sharp selloff that pushed price back into the descending channel. Price action is consolidating within a downward structure, with a triangle breakdown fueling bearish continuation. A failed recovery above 1.3400 would keep momentum tilted toward the 1.3277 support level. The broader trend remains bearish as long as the channel holds resistance.
⚠️ Risks:
A strong reclaim above 1.3400 could trigger short covering.
Shifts in USD fundamentals (Core PCE Price Index data) may weaken bearish bias.
Unexpected positive UK economic releases could support GBP and break the channel.
If this idea resonates with you or you have your own opinion, traders, hit the comments. I’m excited to read your thoughts!

Lingrid | TONUSDT Break Lower Retesting Year LowOKX:TONUSDT has slipped lower after repeated rejections from the resistance zone, with sellers controlling momentum. Price action is carving a downward structure under the descending trendline, while the failed breakout highlights weakness. A move under 2.60 could confirm continuation toward the 2.34 support zone. Broader momentum favors bearish extension as long as resistance holds firm.
⚠️ Risks:
Break above the descending trendline could invalidate the bearish outlook.
Macro or crypto-wide relief rally could lift OKX:TONUSDT back toward 3.00.
Unexpected bullish sentiment shift in altcoins may reduce sell pressure.
If this idea resonates with you or you have your own opinion, traders, hit the comments. I’m excited to read your thoughts!

Gold under EMA pressure Buy at support,short scalp at resistance🟡 XAU/USD – Captain Vincent ⚓
🔎 Captain’s Log – Context & News
FED : Probability of a 25bps cut in October is 91.09% → almost certain.
US Calendar today : GDP, Jobless Claims, Durable Goods Orders, and especially speeches from 3 FED officials → strong volatility expected.
Gold yesterday : Dropped deeply but reacted precisely at key support → according to Vincent, this sell-off was mainly due to investors being cautious ahead of tomorrow’s CPI data.
⏩ Captain’s Summary : Short-term waves are pressured by EMAs, but the bigger voyage remains bullish – sailors prioritize Buy at Golden Harbor, only Quick Boarding 🚤 when facing Storm Breaker.
📈 Captain’s Chart – Technical Analysis (H30, EMA 34 & EMA 89)
EMA : EMA 34 (yellow) crossing below EMA 89 (red) → short-term bearish signal.
Trend : Overall still bullish, with Bullish OBs and Buy Zones below acting as strong supports.
Storm Breaker (Resistance / Sell Zone)
3,769 – 3,777 (Bearish OB)
Golden Harbor (Support / Buy Zone)
3,734 – 3,718 (Bullish OB)
3,687 – 3,685 (Buy Zone OB)
3,650 – 3,648 (Deeper Buy Zone, confluence with EMA 89)
🎯 Captain’s Map – Trade Plan
⚡ Sell (short-term scalp)
Entry: 3,776 – 3,773
SL: 3,783
TP: 3,770 – 3,765 – 3,760 – 3,755 – 3,750
✅ Buy (main priority)
Buy Zone 1 (OB)
Entry: 3,687 – 3,685
SL: 3,678
TP: 3,700 – 3,705 – 3,710 – 3,715 – 3,720
Buy Zone 2 (Deeper OB)
Entry: 3,650 – 3,648
SL: 3,638
TP: 3,665 – 3,670 – 3,675 – 3,680 – 3,685
⚓ Captain’s Note
“The Golden sails are facing headwinds from short-term EMAs, but Golden Harbor 🏝️ (3,734 – 3,650) remains a solid support dock. Storm Breaker 🌊 (3,769 – 3,777) is only suitable for short Quick Boarding 🚤 scalps. Tonight, the US sea will bring big waves from data & FED speeches – sailors, tighten your sails and manage trades with discipline.”
📢 If you find Captain’s Log useful, don’t forget to Follow for the latest updates.
💬 Do you have a different view on Gold? Drop a comment and join the crew discussion!

Lingrid | USDCHF Channel Exit Long OpportunityThe price perfectly fulfilled my previous idea . FX:USDCHF rebounded from the 0.78465 support and is testing the downward trendline again after forming a higher low structure. Price action shows a triangle breakout attempt supported by an upward trendline, suggesting growing bullish pressure. A sustained move above 0.79350 opens the door toward the 0.80000 resistance zone. Broader structure hints at an inverse head and shoulders pattern forming on the higher timeframe.
⚠️ Risks:
Rejection at the downward trendline could push price back toward 0.78465 support.
Strong CHF inflows from risk-off sentiment may limit upside.
Upcoming US data surprises could shift momentum against the setup.
If this idea resonates with you or you have your own opinion, traders, hit the comments. I’m excited to read your thoughts!

Lingrid | SHIBUSDT Possible Monthly Support RetestBINANCE:SHIBUSDT rejected resistance at 0.00001361 and extended its bearish momentum back into the 0.00001230 support zone. Price action is forming a corrective structure inside the channel after a failed breakout attempt. If the 0.00001230 level gives way, downside targets align with the 0.00001100 where there is buying area below. The broader momentum shows sellers in control as long as resistance caps rallies.
⚠️ Risks:
A sudden bounce above 0.00001231 could trigger a squeeze toward 0.00001360.
Broader crypto market recovery could reduce bearish pressure.
Increased whale accumulation near 0.00001100 may limit downside extension.
If this idea resonates with you or you have your own opinion, traders, hit the comments. I’m excited to read your thoughts!

BABA Alibaba Group Holding Limited Options Ahead of EarningsIf you haven`t bought the dip on BABA:
Now analyzing the options chain and the chart patterns of BABA Alibaba Group Holding Limited prior to the earnings report this week,
I would consider purchasing the 135usd strike price Calls with
an expiration date of 2025-9-19,
for a premium of approximately $14.25.
If these options prove to be profitable prior to the earnings release, I would sell at least half of them.

RIOT Platforms Options Ahead of EarningsIf you haven`t bought RIOT before the previous earnings:
Now analyzing the options chain and the chart patterns of RIOT Platforms to the earnings report this week,
I would consider purchasing the 12usd strike price Calls with
an expiration date of 2026-3-20,
for a premium of approximately $1.35.
If these options prove to be profitable prior to the earnings release, I would sell at least half of them.
Disclosure: I am part of Trade Nation's Influencer program and receive a monthly fee for using their TradingView charts in my analysis.
