EUR/USD: Bulls Preparing for a Comeback?The pair is hovering just above the 1.1650 support zone, which has acted as a strong demand area multiple times since late June. Price is currently testing this level again, while both moving averages ( 50 & 100 MA ) are slightly above — signaling a potential oversold condition if we see rejection here.
Technical Outlook
Support: 1.1650 (key short-term level).
Resistance: 1.1720 → 1.1800 (MA cluster + previous lower highs).
Bias: Short-term bullish if 1.1650 holds.
Setup: A bullish reaction at this zone could trigger a rebound toward the 1.1750–1.1800 range.
Invalidation: A clean 4H close below 1.1640 would flip bias to bearish continuation.
Fundamental View
Recent U.S. data has shown signs of slowing inflation and consumer activity, which might reduce pressure on the Fed to maintain a hawkish stance. Meanwhile, the ECB’s neutral tone suggests less divergence between the two central banks — a short-term positive for the euro.
If the next U.S. CPI release comes in softer than expected, EUR/USD could easily rally back toward 1.18+.
💡 Trade Idea (Not Financial Advice):
Watch for bullish confirmation near 1.1650–1.1660 with a tight stop below 1.1610.
First target: 1.1750,
Second target: 1.1820.
Signalsprovider

USDJPY — Bulls in Full Control: Is 152 Next?Bias: Bullish
Timeframe: 4H
1. Technical Overview
USDJPY continues its impressive upward momentum, breaking through several key resistance zones as the pair approaches the 151.00–152.00 psychological level — an area that historically triggered major reversals.
We’re currently witnessing a strong bullish structure supported by the 50 and 100 MA, both trending upward and providing dynamic support. The breakout above 150.00 marked a clear shift in market sentiment, confirming the dominance of buyers.
The next key resistance is located at 151.90–152.20, which was the peak of the last major rally before the Bank of Japan intervened earlier this year. A daily close above this level would open the door to 153.50–154.00, potentially signaling the start of a new medium-term uptrend.
___________________
2. Price Action Analysis
Support zone: 149.50–150.00 — previous resistance now acting as a pivot area.
Resistance zone: 151.90–152.20 — last major high and potential barrier before new highs.
Market structure: Clear sequence of Higher Highs and Higher Lows.
Momentum: Bullish volume expansion, confirming strong participation by institutional buyers.
Price is currently consolidating below the resistance area, forming a potential bullish flag pattern on the 4H chart. A breakout from this mini-structure would confirm continuation to the upside.
___________________
3. Fundamental Context
From a macro perspective, the divergence between Fed and BoJ policies continues to drive this pair upward.
The Federal Reserve maintains a restrictive stance as inflation data remains above target, keeping the USD supported.
The Bank of Japan, meanwhile, sticks to ultra-loose policy and continues yield-curve control, suppressing JPY strength.
Additionally, rising U.S. Treasury yields provide further tailwinds to USDJPY, while Japan’s inflation and wage growth data haven’t shown the strength needed to justify policy tightening.
Unless we see verbal intervention from BoJ officials or a sudden USD correction, the path of least resistance remains to the upside.
___________________
4. Trading Plan (For Reference Only)
Long entry: 150.80 – 151.00 (on retest or small pullback)
Target 1: 151.90
Target 2: 153.50
Stop loss: Below 150.00
Risk-reward ratio: 1:2.5
___________________
5. Summary
USDJPY remains fundamentally and technically bullish. The market shows no immediate signs of exhaustion, and all eyes are now on whether bulls can sustain momentum above the 152.00 threshold — a breakout that could accelerate the rally further.
As always, watch for BoJ rhetoric near these levels — it’s the only real wildcard that can disrupt the current trend.
___________________
Trade safe, plan your entries, and never fight the trend.
— Simon Weber | ICEBERG FOREX SIGNALS

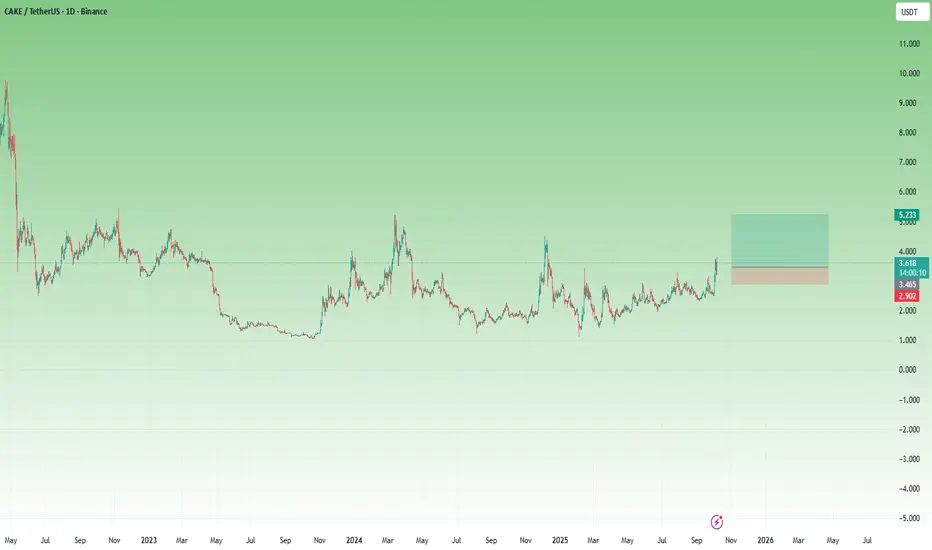
CAKE – Ready for Continuation After a Perfect Breakout RetestAfter the low from April, which aligned almost perfectly with the 2023 bottom, CAKE has shown remarkably constructive price action, steadily forming higher lows and repeatedly pressing against the $3 resistance zone.
Last week, the price finally broke above this major resistance and, in a textbook technical fashion, came back to retest the breakout level before rebounding strongly — confirming buyer commitment.
At the moment, CAKE trades around $3.5, holding well above the former resistance and showing signs of a potential upside continuation.
________________________________________
Key Levels & Outlook
• Support: $3.0 (former resistance, now key support)
• Intermediate target: $5.0
• Extended target: $10.0 (if momentum and broader market sentiment remain strong)
________________________________________
Trading Plan
My preferred strategy is to buy dips against the $3 level, aiming for $5 as a soft target, while keeping a runner for a potential test of $10 if the bullish momentum accelerates.
CAKE has proven resilience — now it’s time to see if it can turn this constructive structure into a sustained breakout.
Lingrid | GOLD Persistent Bullish Trajectory ContinuesThe price perfectly fulfilled my previous idea . OANDA:XAUUSD is holding firm above 3900 after setting a new ATH near 3980 within the upward channel. Price action confirms bullish structure, with higher lows and trend continuation signals. A rejection support zone near 3920 could open the path for a retest of the 4000 psychological resistance. Momentum structure suggests bulls remain in control while targeting the upper boundary of the channel near 4000.
⚠️ Risks:
A breakdown below 3920 could trigger correction toward 3819.
Stronger USD remarks may limit upside potential.
Weakening global demand data could dampen gold’s bullish momentum.
If this idea resonates with you or you have your own opinion, traders, hit the comments. I’m excited to read your thoughts!

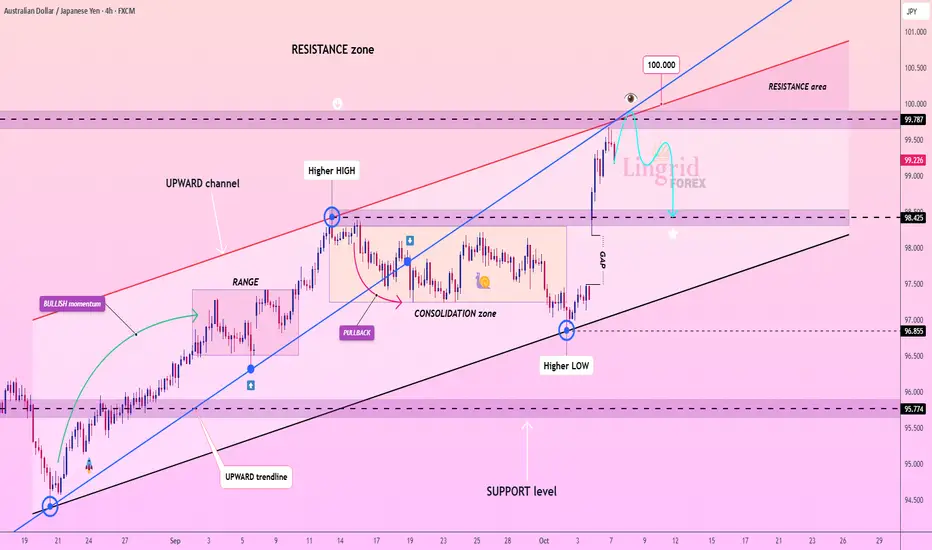
Lingrid | AUDJPY Overbought Correction: Short at Key ResistanceThe price perfectly fulfilled my previous idea . FX:AUDJPY is testing the 99.80 resistance area after a sharp rebound from the 97.50 consolidation zone. Price action shows a clear higher-low formation within the upward channel, with projection signaling a possible correction phase. If price fails to sustain above 97.80, a retracement toward 98.425 remains probable. The market may filled the big gap below. Broader structure suggests a maturing bullish leg that could face resistance near the 100.000 psychological level.
⚠️ Risks:
A breakout above 100.000 could invalidate the short-term correction outlook.
Unexpected Bank of Japan or RBA policy comments may trigger volatility.
Stronger global risk sentiment might support continued yen weakness.
If this idea resonates with you or you have your own opinion, traders, hit the comments. I’m excited to read your thoughts!
Lingrid | LINKUSDT Market Structure Break Long OpportunityBINANCE:LINKUSDT is stabilizing above the 22.00 upward trendline after forming a bottom near 20.00 support. Price action shows a clear recovery structure following a range consolidation, with the projection suggesting a move toward 25.50. As long as 22.00 holds, bullish continuation remains likely within the upward trend. Momentum context implies accumulation before a potential breakout into the resistance zone around 27.50.
⚠️ Risks:
A close below 22.00 may trigger another test of the 19.80 support.
Weakness in broader altcoin sentiment could limit upside.
Sudden Bitcoin volatility might distort the setup’s bullish structure.
If this idea resonates with you or you have your own opinion, traders, hit the comments. I’m excited to read your thoughts!

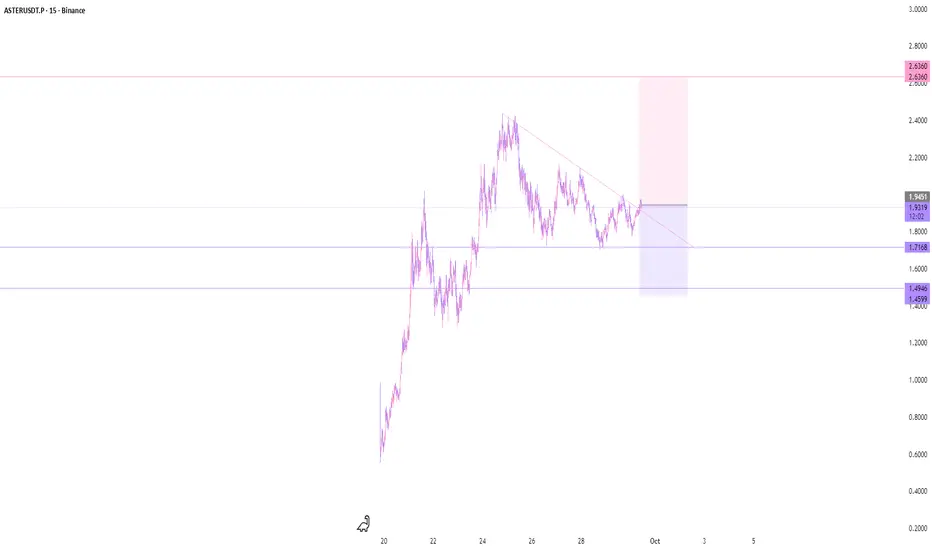
ASTERUSDT.P - September 30, 2025This is a high-probability setup with high reward potential.
Entry Price: 1.9451
Profit Level: 2.6360
Stop Level: 1.4599
#XAUUSD AnalysisHello friends
#NEW forecast on GOLD
The price continues to support level and retesting the upward trend line .
Price action is moving towards the resistance area around 3950.
By regards, Honeytrading

Lingrid | ADAUSDT Next Rally Phase Bull ContinuationBINANCE:ADAUSDT is stabilizing above the 0.8135 upward trendline after a pullback from resistance. Price action shows a sequence of lower highs capped by the red trendline, while the blue arrow projection signals potential breakout toward 0.9385. As long as 0.8135 holds, bullish continuation toward 0.9385 remains favored. Momentum structure suggests buyers are preparing to challenge the resistance zone near 1.0212.
⚠️ Risks:
A breakdown below 0.8135 could shift bias back to the 0.7412 support.
Broader crypto market weakness may cap upside momentum.
Unexpected macroeconomic or regulatory news could trigger volatility against the setup
If this idea resonates with you or you have your own opinion, traders, hit the comments. I’m excited to read your thoughts!

Lingrid | GOLD NFP Positioning Trend Extension SetupOANDA:XAUUSD is holding its structure inside the upward channel, recently rebounding from the trendline support near 3845. Price action is developing higher lows with bullish momentum, while the breakout of equal highs signals strength toward 3923. Holding above 3844 keeps the bias intact for continuation toward the resistance zone. Further upside momentum could push price into the 3940–3960 target area within the channel.
⚠️ Risks:
A drop back under 3845 may trigger a deeper correction.
Strong NFP data could pressure gold.
Geopolitical risk fading could reduce safe-haven demand.
If this idea resonates with you or you have your own opinion, traders, hit the comments. I’m excited to read your thoughts!

Lingrid | CADJPY Oversold Bounce Long OpportunityFX:CADJPY has bounced off the 105.25 bottom after the recent selloff and is now reclaiming ground inside the channel. Price action is forming a recovery structure with the upward projection aiming toward 106.50–107.00 as the next resistance zone. Holding above the 105.60–105.80 area is key for the bullish outlook to remain valid. If momentum continues, a broader reversal toward 107.90 resistance could unfold.
⚠️ Risks:
Failure to hold above 105.60–105.80 would weaken bullish momentum.
Strong JPY demand from risk-off sentiment or BoJ intervention could cap upside.
Weak CAD fundamentals such as lower oil prices could trigger renewed selling.
If this idea resonates with you or you have your own opinion, traders, hit the comments. I’m excited to read your thoughts!

Lingrid | TONUSDT Pullback Sell Downtrend ContinuationOKX:TONUSDT remains trapped in a well-defined downward channel, making lower highs and sustaining bearish pressure. After a sharp drop from the consolidation zone, price rebounded but is now facing resistance at 2.85, where sellers are likely to re-enter. As long as the market trades below the 3.00 psychological barrier and downward trendline, the bias remains bearish. A move toward 2.62 support and possibly the buying area below 2.55 is favored if rejection holds.
⚠️ Risks:
Break above 3.00 would shift momentum and threaten bearish continuation.
Failure to hold 2.62 could accelerate losses toward 2.40.
Macro shifts in BTC/ETH may cause sudden reversals in CRYPTOCAP:TON trend.
If this idea resonates with you or you have your own opinion, traders, hit the comments. I’m excited to read your thoughts!

Lingrid | GOLD Channel Breakout: Bullish Rally ContinuesThe price perfectly fulfilled my previous idea . OANDA:XAUUSD continues to show strong bullish structure after breaking out of the consolidation zone and retesting support. Price action is riding the upward channel with higher highs and a clean A-B-C movement confirming the trend continuation. As long as buyers defend the 3,850 zone, the next objective lies toward 3,950 inside the resistance zone. The overall momentum favors trend extension with potential new highs if the breakout sustains.
⚠️ Risks:
Failure to hold above 3,850 could trigger a pullback toward 3,800.
Unexpected USD strength from macro data may cap gold’s upside.
A reversal signal within the resistance zone could limit the bullish breakout.
If this idea resonates with you or you have your own opinion, traders, hit the comments. I’m excited to read your thoughts!

Lingrid | AUDUSD Compression Phase Expansion ExpectedFX:AUDUSD has rebounded strongly from the 0.6523 support zone, forming a bottom and reclaiming the upward trendline. Price action is now consolidating inside an ascending triangle near 0.6620, signaling building bullish pressure. A sustained move above 0.6630 resistance would confirm continuation toward higher levels. Momentum remains favorable as long as 0.6600 holds as support.
⚠️ Risks:
Failure to hold 0.6600 could lead to a retest of the 0.6523 support area.
Breakdown of the ascending triangle may shift bias back to bearish.
Macro-driven USD strength could cap upside momentum despite the local structure.
If this idea resonates with you or you have your own opinion, traders, hit the comments. I’m excited to read your thoughts!

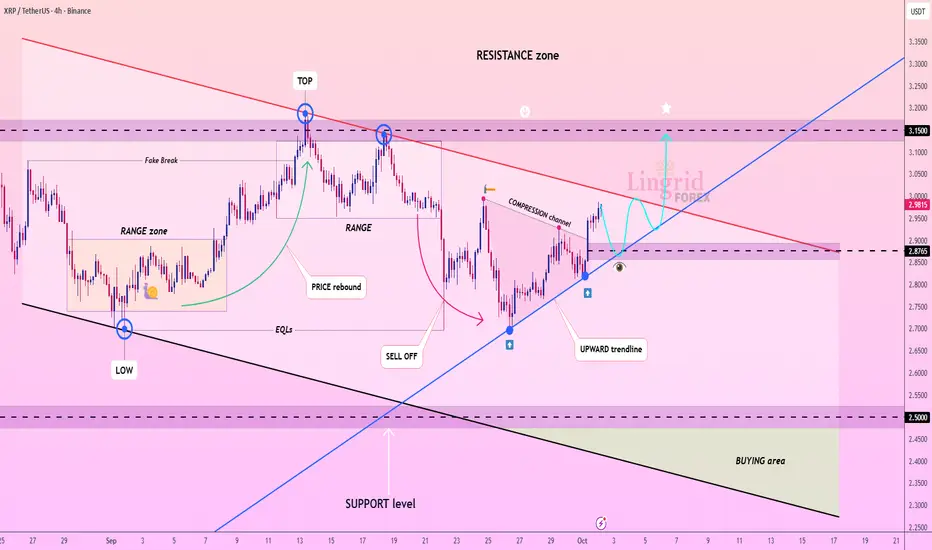
Lingrid | XRPUSDT Channel Break - Upside Momentum PotentialBINANCE:XRPUSDT has rebounded from the 2.8765 zone, aligning with the upward trendline and breaking free from compression structure. Price action now presses toward resistance with the potential to retest the 3.15 area, where prior tops have formed. A sustained hold above 2.90 would strengthen the bullish case for continuation into the resistance zone. Momentum remains constructive, but the structure shows buyers need confirmation at higher levels.
⚠️ Risks:
Rejection below 2.90 could trap longs and lead to a pullback toward 2.50.
Compression breakdown may trigger renewed bearish momentum.
Broader market weakness could cap upside despite local bullish structure.
If this idea resonates with you or you have your own opinion, traders, hit the comments. I’m excited to read your thoughts!
BTC Outlook: Constructive Above 112k, Risky BelowLast week in my BTC analysis, I mentioned that the price could reverse from the 108k zone. That scenario played out, and while this was a positive development, I also noted that bulls needed to reclaim 112k for a brighter outlook.
The market delivered: BTC not only reversed but also broke back above 112k, pushing as high as just under 115k.
Now, the 112k zone has become crucial for two reasons:
1. If bulls hold above 112k – it confirms strength and validates the recovery as a genuine move higher.
2. If price breaks back below 112k – the recent move above would be revealed as a false upside break, with 115k locked in as a new lower high and a potential descending triangle taking shape.
With this in mind, I remain constructive on BTC. But the message is clear: 112k is the key level that will decide whether momentum continues or fades. 🚀

Lingrid | AUDCAD Resistance Rejection Short OpportunityFX:AUDCAD faced a strong rejection from the resistance area at 0.9218 and is now turning lower. Price action shows that after a breakout run supported by the upward trendline, momentum failed near the highs, signaling exhaustion. If sellers maintain control below 0.9200, the market is likely to test the 0.9160 level, with potential extension toward 0.9132. The broader structure suggests a corrective phase inside the channel, aligning with bearish bias.
⚠️ Risks:
A recovery above 0.9218 could invalidate the bearish outlook.
Strong AUD performance from macro data might lift the pair again.
Global risk-on sentiment could dampen CAD demand and push price back higher.
If this idea resonates with you or you have your own opinion, traders, hit the comments. I’m excited to read your thoughts!

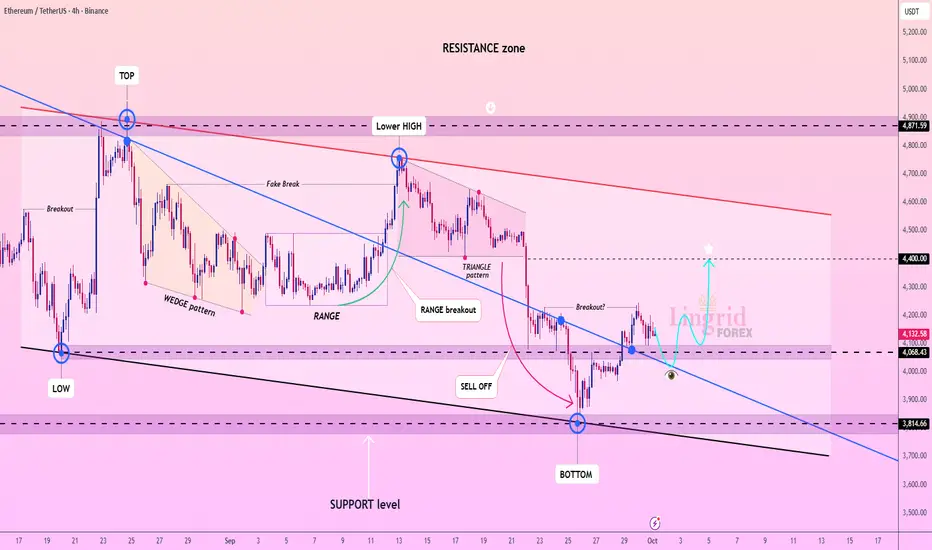
Lingrid | ETHUSDT Structure Break - Potential Bullish SetupBINANCE:ETHUSDT recently found support near 3,815 after a sharp selloff and is now stabilizing above the bottom structure. Price action shows a sequence of lower highs within a descending channel, but the latest rebound hints at a possible reversal. A move toward 4,400 is viable if buyers sustain momentum above 4,000–4,100. The broader context still reflects medium-term weakness unless resistance near 4,300 breaks.
⚠️ Risks:
Failure to hold 4,000 could trigger another retest of 3,815 support.
Macro uncertainty and BTC volatility may weigh on ETH’s recovery.
A rejection near 4,400 could resume the broader downtrend.
If this idea resonates with you or you have your own opinion, traders, hit the comments. I’m excited to read your thoughts!
Lingrid | EURUSD Previous Day High Resistance Short OpportunityFX:EURUSD is recovering from the recent bottom near 1.1645 after support zone rejection. Price action is moving towards the resistance area around 1.1760, aligned with the upward trendline and previous day high. A rejection at this zone could send the pair back toward 1.1680 support. Broader structure suggests a corrective rally within a bearish framework, leaving downside risks intact unless bulls reclaim higher resistance.
⚠️ Risks:
Break above 1.1760 may shift momentum toward 1.1875.
Strong USD data could accelerate selling pressure.
Unexpected ECB commentary may create volatility against the current bias.
If this idea resonates with you or you have your own opinion, traders, hit the comments. I’m excited to read your thoughts!

Daily Bitcoin Signal: Sell Now , target 110,500Bitcoin is currently showing signs of strength as it tests the key resistance level around 113,000.
A confirmed 1H candle breakout this zone could trigger fresh bearish momentum, opening the door for lower targets in the short term.
My Personal Long Setup
Entry : Sell Now from current Price 112,900
🎯 Target 1: 111,900
🎯 Target 2: 110,600
❌ Stop-loss: 115,500
👍 Don’t forget to boost this trading idea if you found it helpful,
and follow me for more daily crypto insights and trade signals.
⚠️ Please note:
This is not financial advice – I’m only sharing my personal trades.
Always do your own research before taking action.
Best of luck 🌹

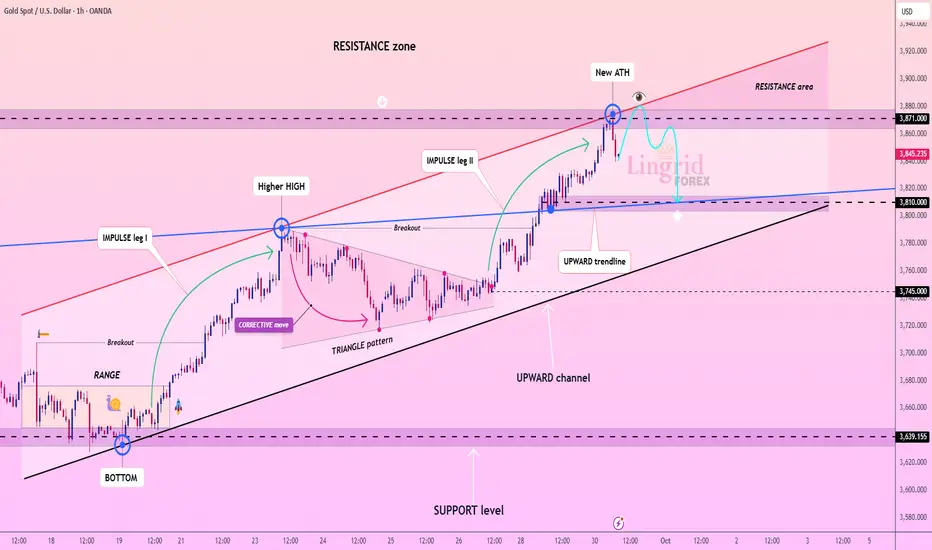
Lingrid | GOLD Price Surge Cooling Short-Term PullbackThe price perfectly fulfilled my previous idea . OANDA:XAUUSD has printed a new ATH near 3,870 after completing two strong impulse legs within the upward channel. Price action is showing signs of exhaustion at the resistance zone, suggesting a short-term retracement phase is underway. A pullback toward 3,800 support is possible before any fresh attempt higher. The broader structure still favors bullish continuation as long as the channel trendline holds.
⚠️ Risks:
A sustained breakout above 3,870 could invalidate the retracement outlook.
U.S. economic data could shift sentiment abruptly.
Rising Treasury yields may cap gold’s upside momentum in the near term.
If this idea resonates with you or you have your own opinion, traders, hit the comments. I’m excited to read your thoughts!
Lingrid | EURJPY Trendline Violation Downside MoveThe price perfectly fulfilled my previous idea . FX:EURJPY has reached the resistance zone near 175.000 after a strong upward channel move from the bottom at 171.130. Price action shows consolidation just below the top, with a corrective projection suggesting a pullback. If the pair fails to hold above 174.500, a decline toward 173.150 support could unfold since it broke and closed below the upward trendline. Broader picture suggest that market reached previous year high that may lead to short-term pullback.
⚠️ Risks:
Breakout above 175.000 would invalidate the pullback and extend bullish momentum.
Unexpected ECB or BoJ policy comments could trigger sharp volatility.
Stronger yen flows from risk-off sentiment may accelerate downside pressure.
If this idea resonates with you or you have your own opinion, traders, hit the comments. I’m excited to read your thoughts!

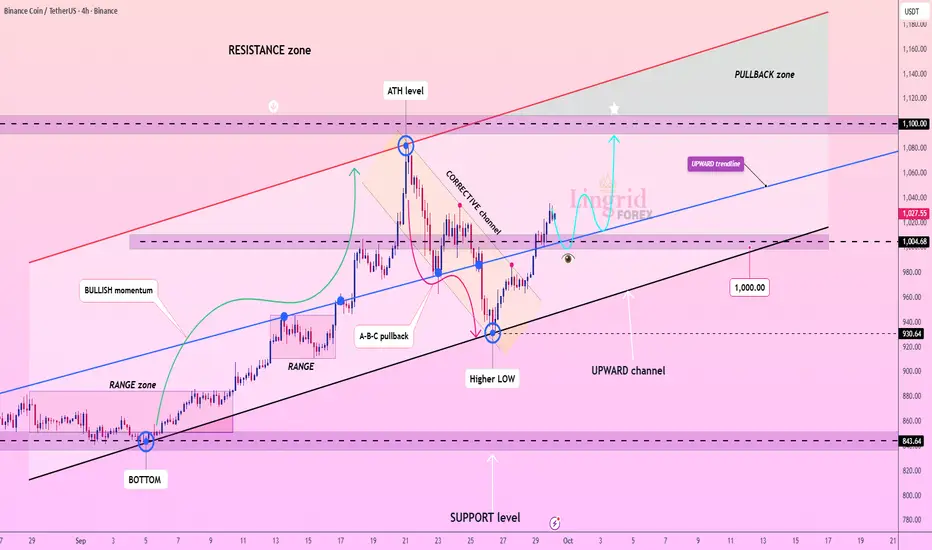
Lingrid | BNBUSDT Targeting ATH Level After PullbackThe price perfectly fulfilled my previous idea . BINANCE:BNBUSDT is trading inside an upward channel after a corrective pullback from the ATH level near 1,080. Price action shows a rebound from a higher low around 1,000, confirming structural support. If buyers defend the 1,000–1,010 zone, momentum could extend toward the pullback area at 1,100+. Broader context supports bullish continuation as long as the channel trendline holds.
⚠️ Risks:
Failure to maintain above 1,000 could invite deeper correction toward 930 support.
Strong USD strength or negative market sentiment may weigh on upside.
Macro-driven volatility around regulatory or Binance-related news could trigger sharp moves
If this idea resonates with you or you have your own opinion, traders, hit the comments. I’m excited to read your thoughts!