SIL

Is Silver completing a cup and handle formation?Looks like silver is finishing his cup and handle formation soon, a quick bounce up should be imminent as soon as price breaks out of the handle.

$SLV #SILVER on supportSilver $SLV bounced off the strong support and so the miners, perhaps it is good entry point for long term #SILVER bull market.

Silver headed to 37.65 in AprilLong term fib sequence pointing to higher silver, specifically 37.65 for a 100% move, probably have some pullback there before heading to 47.50+ later this summer

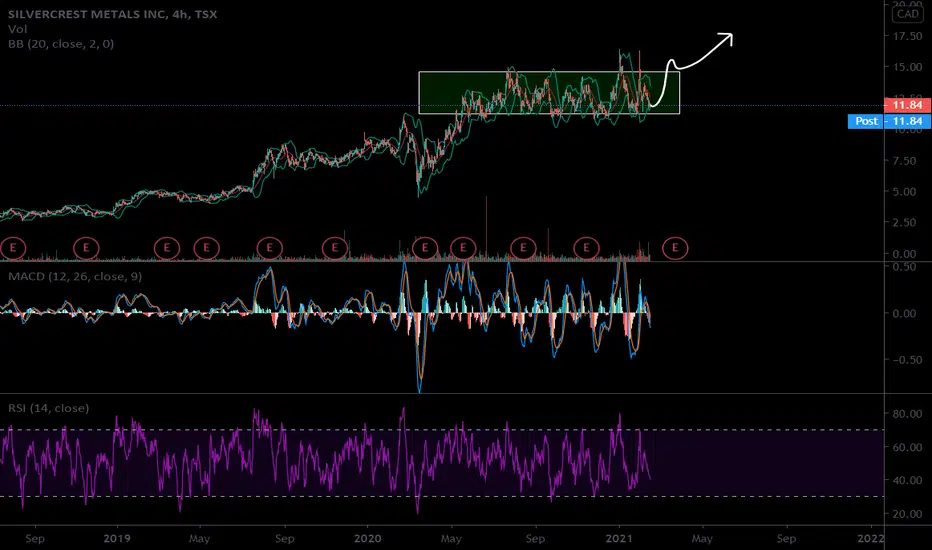
SILVERCREST METALSBUy the breakout of the rectangle, this is one of the best silver ore bodies discovered on Earth this century, when silver breaks out this may go 4-500%. GLTA
SLong
Silver so hot, it burned...Some profited, some burnt, in Silver's >10% surge earlier this week, and then a sudden flash crash of sorts.
what is worse, is that it is telling us that there is a lot of sell presuure higher up, and now it would probably look for the downside support of about 22.50


SIL points of interestIf SIL can hold above 44.5 the next few days, we could see a breakout to 66, 67 over the next few weeks. If not, it could drop as low as 40 before a bounce. That would not be surprising either as we're in a time of extra volatility likely for the next month. If it drops much below 40 I would get the hell out of all stocks.

Inflation + GLD ($GLD $DXY $Sil $SPY #Gold #SPY)see full chart & Follow at www.tradingview.com
A while back, you may see me call the top on Gold because it was up 25% in the last 12 months. while market was only 7%.
Some things have changed since then, Gold came back down a bit, The FED (FOMC & Powell) have declared they would let inflation run wild.
Interesting pattern on Gold, as market is starting to dip. we may get a slight bounce opportunity on GLD, as people panic and move into gld as hedge.
What's my play?
I will probably sell GLD puts at $179 to collect options premiums.
What's the significance of this?
KEY TAKEAWAYS About Gold
-Gold has long been considered a durable store of value and a hedge against inflation .
-Over the long run, however, both stocks and bonds have outperformed the price increase in gold , on average.
-Nevertheless, over certain shorter time spans, gold may come out ahead.
Gold vs. Stocks and Bonds
When evaluating the performance of gold as an investment over the long term, it really depends on the time period being analyzed. For example, over a 30-year period, stocks and bonds have outperformed gold , and over a 15-year period, gold has outperformed stocks and bonds.

silver | consolidation is still in progressthe metal is still within a complex correction.
the wave Y of (X) could have started to retest the former top around 30
then another drop will follow to complete the entire correction around 23.39
after that we will resume to the upside

KGC- Gold/Silver mining play (Industry)As usual, demand for Gold mining stocks has risen with the ore rally. Mining stock such as KGC has outperformed major gold/silver mining ETFs and completely obliterated gold/silver ETFS since March.
It is a higher risk and higher reward play for investors who want to ride the gold/silver trend.
EV/EBITDA TTM, Price/cash flow TTM and many other valuation ratio indicate that KGC are undervalued compared to its peers.

Silver hit target on time! Next projected target at 30.The target previously posted hit target spot on time !
So what’s next?
I would hazard a projection that despite the parabolic run, it still might have some legs to go, but am expecting the next target area (green ellipse with red outline) to be volatile. Not expecting a close above 30.30 though... it is just over stretched.
IF silver still continues, the;we are in for some serious s hitting the fan... I don’t know what it would be, next week tells more!
Btw, for study sake, I have put in the bright green arrows for the typical best entry points.
Stay safe....

Mining Metals ETF on new supportPrevious resistance on June 8th, now became new support.
A close below $23 is a sign of a fail of the short-term bull trend.
Next support level is $20.

Silver upside target at 27.70Recently, there was a lot of hype on precious metals, and Silver outshone Gold (finally!), particularly over the last week or two.
This who are in positioned find themselves wondering when this parabola will end. And I’ve been asked one too many times for a projected expectation. While I do not have a crystal ball (at all), price target is calculated to be at 27.70 , (with a possible intraday extension to 28) for the immediate target in this current parabolic run. Likely to reach this target around 3-5 August, if not a bit earlier.
Momentum is very bullish at this point, with “all systems go at full speed ahead”, even on a longer term.

SIL looks to hit around 43.4 from hereADX over 25, and the price seems to be breaking out of trendline on the weekly chart. (Note that I am displaying the daily chart)

Silver Could Hit 18.80-19.30The corrective structure of double three WXY has been completed and we got the first impulse up.
It should be retraced in wave 2 and then the rally will resume.
Target area is in the blue box in the 18.80-19.30 range.

Silver structure might have changed. First down then up to 22.50The earlier idea could be completed as structure gets more complex with possible double three WXY to emerge.
The drop into blue box should occur then to make a wave X retracement.
Then the metal could hit 22.50 when another zigzag up in wave Y unfolds.

Gold Update: Wave 5 up could be extended to hit 1921-1965The wave (4) has been completed as per the plan (see related).
The wave (5) could be extended and of the same size as wave (3) and it can hit the all-time high and even higher level of 1965.

Silver to retest former top of 21.13This is an updated map as we saw silver dropped into the abyss below the range.
Overall structure remained unchanged as it is still a flat correction although the right valley was established low than the left one.
The market is consolidationg within wave B of (Y) and it can dip between 14.23 and 13.24 into the blue box of Fibonacci retracement area.
After completion the upside move would resume to tag the former top of 21.13.
The wave C then should unfold at least 1.618x of wave A within (Y).
The silver was the game changer as previously I thought gold completed upside and should reverse.

Silver Breaking DownThe technical story in #silver: Full backtest of breakout from 2016 falling trend line. Last gasp for bulls. 200WMA broken. Break here targets 14.20 & likely retest of 2015 low @ 13.62. If that fails, could see 8 handle. Good luck getting physical in that scenario. $SLV $SIL

Silver coming into support zoneThe 17.45 area in #Silver has been a key area of support/resistance since early 2018. Price is now approaching falling support of the bull flag that started in early Jan. Price should find support here. If this area doesn't hold it could be a quick drop to ~16.90. $SLV $SIL $SI_F

XAG/USD Price Action Analysis | The Next Leg DownSilver is consolidating in the main Trading Range after creating the Distribution Schematic. A visit to the Range High in order to gather the enough fuel for the next pullback to the below of the Range, is the trigger for the short position.
Entry: 17.49
SL: 18.01
TP-1: 16.51
TP-2: 15.66
R/R: 3.52
Please let me know if you have any suggestions or any ideas to add. I can also give you more detailed explanation for this specific trade setup.
The ideas published here are not financial advices.
