Silver Shorting IdeaSilver going to fall like it has done before. Idea shared as Text on the chart itself.
Shorting Idea.
Silver

COPPER IS PRIMED AND READYSo this decade precious metals have finally shown volatility. Gold and Silver have been a highlight especially with the past Administration boasting EV, GREEN-NEW DEAL, and now with AI; Precious metals are showing that people as of right now prefer a physical safe haven asset rather than “code” like cryptocurrency. Even now with the Trump administration, space exploration and the ongoing need and increasing demand for more precious metals is obviously making these assets worth looking at BUT one metal that stands out the most but no one is talking about, is COPPER (CU)!
COPPER is by far primed and ready to show what its really made of. Often overlooked, with pennies being disclosed as being “worthless,” it takes more to produce 1 penny than what its actual value is, with only 2-4% of modern day pennies being made of Copper (CU) and 96%+ being zinc and other over supplied metals. Why?
By 2026 the US Government will stop printing pennies, and any 1 cents transactions will now be rounded to the nearest Nickel.
Gold and Silver showed similar chart patterns, and experienced almost the same innovations that lead to its increase demand thus leading to price being bullish as well. One thing that leads me to believe COPPER IS VERY UNDERVALUED is the FACT that silver mining and gold mining can be done by basically any individual with an increased appetite to fund a business venture of 1mil+, and in this day and age thats more common than you think. But copper mining takes at least 10times more money, and it takes at least 15 years to get a Copper Mine up and ready before you start to dig your first ore. With that being said, and the fact that most copper mines if not all of them up to unow, are starting to show depletion…. its TIME.
Technical analysis is easy here, basic trend and resistance/support and price action on the monthly outlook. This asset will be like when your daddy or great granddaddy bought gold cheap!

Every President TermThe president’s influence is real — but limited.
Markets are forward‑looking. They price in expectations months or years ahead. So even if a president announces a policy, the market may have already reacted long before it becomes reality.
Below numbers are taken from Year Starting January until December of finishing Year.
During Trump 1st Term 2017-2020
SP500 is up 67%
Gold is up 57%
Silver is up 54%
US M2 is up 43%
During Biden Term 2021-2024
SP500 is up 52%
Gold is up 45%
Silver is up 19%
US M2 is up 11%
During Trump 2nd Term 2025-2028 (Dated until 2025 Dec 30)
SP500 is up 19%
Gold is up 50%
Silver is up 130%
US M2 is up 3%
I would expect by the end of Trump Term, SP500 will be moving close to Gold Gains,
May be 30% up from here making SP500 close to 10000
I will look back this post on 2028 January to see if I need to correct my thesis

Silver Already Showed The Playbook – Bitcoin Might Be Next!When you compare OANDA:XAGUSD and COINBASE:BTCUSD side by side, the similarity in structure is hard to ignore. Silver spent time consolidating, respected its higher lows, absorbed supply, and then expanded aggressively once the structure was confirmed. Bitcoin now appears to be in a very similar phase.
At the moment, Bitcoin is trading around $88,000. The previous all-time high sits near $126,000. The most recent major November low was formed around $80,700.
Importantly, price has not violated the $74,000 macro support, which remains a key level. This alone keeps the higher-timeframe structure intact and bullish.
What we are seeing right now is not panic or distribution. Pullbacks are corrective, momentum remains controlled, and price continues to hold above key demand zones. This behavior suggests compression and energy build-up, not exhaustion.
Silver already executed this sequence cleanly. Bitcoin has not broken down yet, and structurally, it is still behaving like an asset preparing for continuation rather than reversal.
There is, however, a macro risk that cannot be ignored. Rising geopolitical tensions, especially the risk of escalation between Iran and Israel with potential U.S. involvement, could change market dynamics very quickly. Events like these can override any technical structure.
That said, this analysis is based strictly on current price action and confirmed data, not on hypothetical scenarios. As long as price respects structure, the technical bias remains valid.
From a long-term perspective, if Bitcoin continues to respect its macro supports and resumes expansion, the broader upside zone I am watching lies between $200,000 and $280,000.
This is not a buy or sell signal. This is a structural comparison and a technical roadmap.
The market often looks uncertain right before the next major leg begins.
The real question is simple:
Does Bitcoin follow Silver’s playbook, or does macro risk step in first?
Let me know your view below.

Silver is all about the 80-handle NowSilver started the week with a bang, and that extended the breakout from last week, at least initially. But it was the 80-level that bulls couldn't hold price above and that led to a massive pullback to start this week.
The daily bar printed as a bearish engulf and those are difficult formations to work with organically as the wide distance from high to candle body close makes for a wide risk outlay, which would require a massive continuation and, essentially, the trader calling a top on the move.
But so far bulls have shown up, defending the 70-level with yesterday's pullback and pushing ahead today to make another run at that 80-level that remains the big spot on the chart for buyers to contend with.
Chasing the move at this point is somewhat daunting given the ~$6 rally from yday's lows, but there's a spot of prior resistance turned support, around 75.15, that sets up for higher-low support potential.
If bulls can gain acceptance above 80 on that next test, the door opens for 85, 90 and perhaps even 100 in 2026 trade. This may seem improbable on its face, especially given the bearish engulf that printed yesterday, but so too would a 60% run in a major market like Silver in a month, such as we've seen since mid-November. - js

Gold crashes 5%! Dead cat bounce or buy-the-dip opportunity?Gold has taken a brutal hit, plunging over 5% from the $4,550 highs down to $4,300 as profit-taking slams the market in thin holiday trade. We are now seeing a bounce toward $4,400, but the big question is: is this just a dead cat bounce before a drop to $4,150?
In this video, we analyse the sharp reversal driven by year-end profit-taking and thin liquidity after an extraordinary ~70% rally in 2025. We then map out the critical Fibonacci retracement zones that will determine whether we see a V-shaped recovery or another leg lower.
Key drivers
Profit-taking & thin liquidity : The 5% drop was fuelled by a lack of buyers to absorb heavy selling in a thin, pre-New Year market. This is classic risk-off behaviour after an extended run.
Dead-cat-bounce risk : Bounces to the 38.2% ($4,400) or 50% ($4,430) Fibonacci levels are typical after violent drops. If price rejects here, the technical structure favours another leg down.
Downside targets : A measured move extension from a rejection at $4,400 points to a target around $4,150, which aligns with the 100% Fibonacci extension and previous support zones.
RSI reset : The 4-hour RSI has swung from overbought to oversold in one go. A bounce to the 50-60 level on the RSI would likely reset momentum for the next wave of selling.
Trade plan Bearish continuation : Sell the rally into $4,400–$4,430, targeting $4,170–$4,180 with a stop above $4,500.
Bullish reversal : Watch for hidden bullish divergence on the RSI or a break above the 61.8% retracement ($4,460) to invalidate the immediate bearish bias.
Are you selling this bounce or waiting for the bottom? Share your plan in the comments, and happy New Year to all traders! See you in 2026.
This content is not directed to residents of the EU or UK. Any opinions, news, research, analyses, prices or other information contained on this website is provided as general market commentary and does not constitute investment advice. ThinkMarkets will not accept liability for any loss or damage including, without limitation, to any loss of profit which may arise directly or indirectly from use of or reliance on such information.

Investment Logic: Why Gold Leads This Market CycleInvestment Logic Explained: Metals as the Preferred Asset in This Cycle
The performance gap shown in the table is not accidental. It reflects a clear capital rotation driven by macroeconomic realities in 2025. While equities and Bitcoin struggled to generate real returns, precious metals led by gold emerged as the dominant beneficiaries of this cycle. This shift is rooted in monetary policy, geopolitical risk, and the market’s renewed focus on capital preservation rather than speculation.
Gold: The Core Beneficiary of the 2025 Macro Environment
Gold’s +67.3% appreciation this year is a direct response to persistent global uncertainty and a structural shift in monetary expectations. Central banks maintained a cautious stance as inflation remained sticky, while real yields compressed amid expectations of policy easing into 2026. In this environment, gold regained its role as the primary store of value offering protection against currency debasement, sovereign risk, and declining confidence in fiat systems.
Importantly, gold’s rise was not driven by hype or leverage. It was supported by sustained institutional demand, central bank accumulation, and a steady increase in long-term holdings. This is the hallmark of a healthy, macro driven trend rather than a speculative rally.
Silver and Platinum: Beta Plays on the Same Thesis
Silver and platinum significantly outperformed gold, but their gains should be viewed as extensions of the same macro logic. As confidence in hard assets strengthened, capital flowed into metals with tighter supply dynamics and industrial demand exposure. These moves typically follow gold’s lead in the later stages of a precious metals cycle amplifying returns but also volatility.
For professional traders, gold remains the anchor. Silver and platinum offer upside asymmetry, but gold defines the directional bias of the entire metals complex.
Why Equities and Bitcoin Lagged
The S&P’s modest +17.7% gain underscores a year dominated by valuation compression rather than expansion. Elevated rates, earnings uncertainty, and geopolitical risk limited upside. Bitcoin’s −9.3% decline further highlights the difference between speculative assets and defensive capital. As liquidity tightened and risk appetite normalized, capital favored assets with intrinsic value and macro credibility areas where gold excels and Bitcoin currently does not.
Professional Takeaway: This Is a Capital Preservation Cycle
This cycle is not about chasing exponential upside. It is about protecting purchasing power, managing risk, and aligning with macro flows. Gold sits at the center of this framework. Its performance reflects disciplined capital allocation by institutions, not retail enthusiasm. Until global monetary stability is restored and real yields turn decisively positive, gold is likely to remain a preferred asset.
For traders, the message is clear: follow structure, follow liquidity, and respect macro regimes. In 2025, gold was not just a trade it was the benchmark for intelligent capital positioning.

Stop!Loss|Market View: EURUSD🙌 Stop!Loss team welcomes you❗️
In this post, we're going to talk about the near-term outlook for the EURUSD currency pair☝️
Potential trade setup:
🔔Entry level: 1.17949
💰TP: 1.19024
⛔️SL: 1.17435
"Market View" - a brief analysis of trading instruments, covering the most important aspects of the FOREX market.
👇 In the comments 👇 you can type the trading instrument you'd like to analyze, and we'll talk about it in our next posts.
💬 Description: The euro is expected to continue rising later this year. We may see the biggest move next year, especially at the beginning. The price is testing resistance near 1.18000 for the third time, and the accumulation of volume will only add to the potential context for an upward breakout. The upside target is seen near 1.19000.
Thanks for your support 🚀
Profits for all ✅

Bullish bounce off?Silver (XAG/USD) has bounced off the pivot, which aligns with the 50% Fibonacci retracement and could potentially rise to the 1st resistance.
Pivot: 70.79
1st Support: 68.17
1st Resistance: 80.70
Disclaimer:
The opinions given above constitute general market commentary and do not constitute the opinion or advice of IC Markets or any form of personal or investment advice.
Any opinions, news, research, analyses, prices, other information, or links to third-party sites contained on this website are provided on an "as-is" basis, are intended to be informative only, and are not advice, a recommendation, research, a record of our trading prices, an offer of, or solicitation for, a transaction in any financial instrument and thus should not be treated as such. The information provided does not involve any specific investment objectives, financial situation, or needs of any specific person who may receive it. Please be aware that past performance is not a reliable indicator of future performance and/or results. Past performance or forward-looking scenarios based upon the reasonable beliefs of the third-party provider are not a guarantee of future performance. Actual results may differ materially from those anticipated in forward-looking or past performance statements. IC Markets makes no representation or warranty and assumes no liability as to the accuracy or completeness of the information provided, nor any loss arising from any investment based on a recommendation, forecast, or any information supplied by any third party

Daily Analysis: Nifty/ XAUUSD/ XAGUSD : 30-12-25Quick look at the levels and the projections of Nifty50, Gold and Silver prices.
All the major shifts or support/resistance is shared in the chart itself.

SILVER Strong Uptrend! Buy!
Hello,Traders!
SILVER remains bullish after a corrective pullback into rising trendline support. Sell-side liquidity has been absorbed, and price is holding structure, signaling smart money continuation toward the next buy-side liquidity resting above recent highs. Time Frame 7H.
Buy!
Comment and subscribe to help us grow!
Check out other forecasts below too!
Disclosure: I am part of Trade Nation's Influencer program and receive a monthly fee for using their TradingView charts in my analysis.

Absolute Insanity in SILVER right Now $4 billion in silver longs get vaporized in 70 minutes.
$83.75 to $75.15. Fastest wipeout ever, With current price sitting at $71
American traders panic-dumped at $75, Chinese buyers were paying $90. Ninety. For the same metal. The premium didn’t shrink during the crash—it widened.
Let that sink in.
This wasn’t a top. This was a heist.
China locks silver exports in 72 hours. January 1st. Export licenses only. They control 70% of global supply. COMEX is down 70% on inventory. London’s vaults are bleeding. And Elon Musk just tweeted “this is not good” about the shortage.
The gold-silver ratio is 60:1. Historical average is 30. That’s $150 silver just to normalize.
Everyone’s calling this 1980. It’s not. The Hunts were speculators playing paper games. This is industrial demand crashing into empty vaults. Solar panels don’t negotiate. AI chips don’t wait.
Retail just handed their silver to sovereign wealth funds at a 15% discount.
The rumor says a major bank collapsed on a silver margin call at 2:47 AM December 28.
I cannot verify that.
What I can verify is more interesting.
JPMorgan filed an 8K on December 27 disclosing 4.875 billion dollars in unrealized silver losses. They flipped from 200 million ounces short to 750 million ounces long physical. The largest position reversal in the history of the silver market happened in the last 30 days and nobody on financial television said a word.
The rumor claims 34 billion in emergency Fed repos. Official data shows routine operations under 7 billion. Either the data is lagged or the rumor is wrong.
Why did JPMorgan suddenly need to own three quarters of a billion ounces of physical silver after spending 15 years on the short side. What did they see coming that made them eat a 5 billion dollar loss just to get positioned the other way.
The collapse story might be fiction.
The position flip is filed with the SEC.
One of those facts will matter more in 90 days than the other.
Stop chasing the rumor. Start asking why the smartest bank in commodities just switched sides at the worst possible price and seems fine with it.

Gold or Silver?Right now: SILVER!
I know, I know! Crazy schitt! Don't look at me!
The chart’s telling the story — Silver hasn’t even really started its move yet. Don’t blame me, I’m just reading the data.
Silver is up 87% year-over-year and outperforming gold by 11%, which is still on the low end historically.
That suggests Silver either has room to run from here, or it’s simply the safer relative play versus gold on a risk-adjusted basis.
If you’ve got space in your portfolio, it’s a reasonable addition.
If it hits nose-bleed levels, we reassess.
THANK YOU for getting me to 5,000 followers! 🙏🔥
Let’s keep climbing.
If you enjoy the work:
👉 Drop a solid comment
Let’s push it to 6,000 and keep building a community grounded in truth, not hype.

Silver’s 2025 Explosion — How High Can It Go?In 2025, Silver ( OANDA:XAGUSD ) has experienced a remarkable surge, making it one of the most notable assets of the year. As we approach the end of 2025, I’ve decided to analyze silver to see how far its bullish trend might continue. So, stay with me as we delve into the reasons behind silver’s rise and explore how far this upward momentum could go.
Let’s begin by looking at the fundamental factors driving silver’s increase in 2025. After that, we’ll move on to the technical analysis.
Fundamental Drivers Behind Silver’s Massive 2025 Rally:
Structural Supply Deficit — Multi‑year deficits draining inventories, tight physical market.
Strong Industrial Demand — Solar, EVs, semiconductors & data centers consuming silver at record levels.
Rate Cut Expectations — Anticipated Fed easing lifts non‑yielding assets like silver.
Safe‑Haven Flows — Geopolitical risk, inflation, and a softer dollar boosting precious metals demand.
Liquidity & Momentum — Smaller market vs gold( OANDA:XAUUSD ) amplifies swings, attracting speculators.
Silver has surged ~ 150–165% YTD , setting fresh all‑time highs as both an industrial metal and investment hedge.
-----------------------
Technical Analysis:
Now, considering the technical side, with less than five days remaining before the six-month and one-year candles close, I’ll focus on a higher time frame for silver’s analysis. Recently, silver achieved a new all-time high, capturing widespread attention, and many prominent figures are now discussing silver’s potential.
From a classic technical analysis perspective on the six-month time frame, it appears that silver has formed a bullish continuation pattern, specifically a cup and handle pattern, and the recent six-month candle has broken the neckline/resistance zone($50-$34) with strong volume. This suggests that the bullish trend for silver is likely to continue.
From an Elliott Wave perspective, it seems that silver is completing wave 3, potentially within an ascending channel and a Potential Reversal Zone(PRZ) .
I expect that silver, upon entering this Potential Reversal Zone(PRZ) , will undergo a correction. If you’re considering adding silver to your portfolio, it’s wise to wait for that correction, as buying at all-time highs can be riskier due to the strong upward momentum.
What do you think? How far can silver’s bullish trend extend, and what levels might we see in 2026?
💡 Please respect each other's opinions and express agreement or disagreement politely.
📌 Silver/ U.S. Dollar Analyze (XAGUSD), 6-month time frame.
🛑 Always set a Stop Loss(SL) for every position you open.
✅ This is just my idea; I’d love to see your thoughts too!
🔥 If you find it helpful, please BOOST this post and share it with your friends.

GOLD (XAU) Outlook - Prediction (12 NOV)GOLD (XAU) Outlook - Prediction
📊 Market Sentiment
Market sentiment for GOLD remains strongly bullish, primarily driven by central bank accumulation. Since 2023, global central banks led by China have been purchasing gold aggressively, creating a durable demand base. With the FED preparing to initiate QE while inflation remains elevated, I think risk assets like GOLD could outperform as the USD (DXY) weakens. This macro setup continues to support a long term bullish narrative.
📈 Technical Analysis
Price has been retracing since October 20, which I think was a healthy correction following a strong expansion. As mentioned in my previous GOLD outlook, price appeared to be retesting the Weekly Value Gap and accumulating within that zone. In my opinion, this accumulation phase seems to have ended, and the market looks ready to continue higher.
📌 Game Plan - Prediction
Price has broken out of the accumulation zone and started expanding upward. I plan to enter after a retest near the key zone around $4060. It may dip toward $4027, which I consider a discount zone. I intend to scale in between $4060 and $3950, with invalidation if the daily candle closes below $3900.
💬 Follow my Substack profile for detailed insights and extended analysis.
⚠️ Disclaimer: For educational purposes only. This is not financial advice.

Silver overbought pullback support at 7230The Silver remains in a bullish trend, with recent price action showing signs of a corrective pullback within the broader uptrend.
Support Zone: 7230 – a key level from previous consolidation. Price is currently testing or approaching this level.
A bullish rebound from 7230 would confirm ongoing upside momentum, with potential targets at:
7926 – initial resistance
7154 – psychological and structural level
7397 – extended resistance on the longer-term chart
Bearish Scenario:
A confirmed break and daily close below 7230 would weaken the bullish outlook and suggest deeper downside risk toward:
7126 – minor support
6984 – stronger support and potential demand zone
Outlook:
Bullish bias remains intact while the Silver holds above 7230. A sustained break below this level could shift momentum to the downside in the short term.
This communication is for informational purposes only and should not be viewed as any form of recommendation as to a particular course of action or as investment advice. It is not intended as an offer or solicitation for the purchase or sale of any financial instrument or as an official confirmation of any transaction. Opinions, estimates and assumptions expressed herein are made as of the date of this communication and are subject to change without notice. This communication has been prepared based upon information, including market prices, data and other information, believed to be reliable; however, Trade Nation does not warrant its completeness or accuracy. All market prices and market data contained in or attached to this communication are indicative and subject to change without notice.

GBPUSD: bullish breakout🛠 Technical Analysis: On the 4-hour (H4) timeframe, GBPUSD continues to exhibit a strong bullish structure, following the "Global bullish signal" established earlier in December. The pair has been consistently making higher highs and higher lows, supported by the upward-sloping SMA 50, 100, and 200.
A breakout above the 1.35000 resistance zone is likely to be expected. This is supported by the current accumulation and price consolidation at this resistance.
———————————————
❗️ Trade Parameters (BUY)
———————————————
➡️ Entry Point: After a confirmed breakout (approx. 1.35109).
🎯 Take Profit: 1.35897 (Resistance line).
🔴 Stop Loss: 1.34583.
⚠️ Disclaimer: This is a potential trade idea based on current analysis; market conditions and price direction are subject to change based on news factors and volatility.

The Silent Supercycle: The Trade Hiding in Plain Sight ($DBB)The market loves a shiny object. Right now, that object is Silver ( AMEX:SLV ). Everyone is looking at it. Everyone is talking about it.
But in this game, by the time "everyone" is talking about it, the easy alpha is gone.
I am not interested in chasing a vertical chart. I am interested in Asymmetry. My data suggests the "Smart Money" is quietly positioning for a massive rotation into the backbone of the global economy: Base Metals.
Here is the "Boring" trade that could outperform the "Sexy" trade in 2026.
1️⃣ THE MACRO THESIS:
The "Physical" Crunch 🏗️ Forget the "Inflation Hedge" narrative for a second. Look at the Supply/Demand mechanics.
The Reality: The world is building AI Data Centers and Green Grids at a record pace. These don't run on Gold. They run on Copper .
The Crunch: We are staring down a forecasted refined copper deficit for 2025/2026.
The Trade: Economics 101 says when Demand > Supply, price must adjust.
2️⃣ THE TECHNICAL "COILED SPRING" ( AMEX:DBB )
📈 While Silver was running vertical, Invesco DB Base Metals ( AMEX:DBB ) was doing something much more powerful: Compressing.
Looking at the Monthly Chart above:
The Structure: We just broke out of a massive 3-year consolidation wedge.
The Implication: Consolidation builds energy. The longer the base, the higher the space.
The "Blue Sky": Unlike the crowded Precious Metals trade, DBB has minimal overhead resistance until $27.30 (TP1).
3️⃣ THE PSYCHOLOGY: Retail vs. Pro 🧠
Retail: Buys AMEX:SLV because it went up yesterday. (Chasing Performance).
Pros: Buy AMEX:DBB because the structure says it will go up tomorrow. (Front-running the Rotation).
4️⃣ THE WATCHLIST 📋
AMEX:DBB : The pure basket (Copper, Zinc, Aluminum).
NYSE:FCX : The institutional favorite.
AMEX:COPX : The miner leverage play.
💡 THE VERDICT I’m letting the crowd fight over the Silver scraps at the top of the range. The Asymmetric Bet—where you risk $1 to potentially make $5—is in the Industrial Rotation.
⚠️ RISK CHECK: Commodities are volatile. If a global recession hits, industrial demand vanishes, and this thesis breaks. This is NOT a "Buy Now" signal. It is a "Wake Up" call. Manage your risk.
👇 YOUR MOVE: Are you chasing the shiny stuff, or positioning for the industrial crunch? Let's discuss below.
🔥 Follow me for more institutional-grade setups.
Disclaimer: This analysis is for educational purposes only. Trading involves significant risk. Do your own due diligence.

Weekly Market Outlook (Week 53)🔘 EURUSD
Buyers continue to apply pressure on the 1.1800 resistance, with a breakout expected in the short term as the market targets seller stop-losses above this zone. The global bullish signal remains intact, suggesting further upside potential once the current resistance is cleared.
🔘 GBPUSD
The pair is currently testing a major resistance line within a global bullish structure. A local pullback followed by a continued move upward is the most likely scenario as the price maintains its long-term momentum.
🔘 AUDUSD
Price has stabilized at the critical resistance zone and is expected to maintain its short-term upward trajectory toward 0.6750. Traders should watch for a bullish continuation signal within the framework of the current medium-term trend.
🔘 USDJPY
The pair maintains its medium-term upward momentum. The technical model points to a likely target at 162.00 if buyers hold the likely breakout of resistance at 158.
🔘 XAUUSD
Gold has reached a significant resistance line near the 4531 peak, where a technical correction toward the 4350 - 4400 support area is now probable. Despite the global bullish signal, the current price extension suggests a period of cooling off.
🔘 XAGUSD
Silver has entered a vertical parabolic phase, reaching extreme highs near 79.14. Given the aggressive nature of this move, a sharp corrective reversal is expected as the market seeks a more sustainable support level.
🔘 BTCUSD
Bitcoin continues to trade within a bearish structure, capped by descending resistance lines and failing to hold higher levels. The momentum currently favors a retest of the 81,000 support zone in the coming days.
🌍 Fundamental Analysis: Market participants are navigating the final week of the year under conditions of significantly thinned liquidity, which often leads to erratic price movements and widened spreads. Investors are largely focused on year-end portfolio rebalancing and the "January Effect," while keeping a close eye on any late-breaking geopolitical shifts. With major banks closed for the New Year holiday, expect low-volume trading to dominate until the full return of institutional players in early 2026.
⚠️ Disclaimer: This is a potential trade idea based on current analysis; market conditions and price direction are subject to change based on news factors and volatility.

Weekly Analysis: XAGUSD 29/12/25The Silver prices finds support at $75.20sh zone and from here if prices are bouncing it will be giving us new highs till $86
But this rally wouldn't be smooth one, will find resistance at 78, 81 also.
On breach of support, prices will slip till $72 to $69

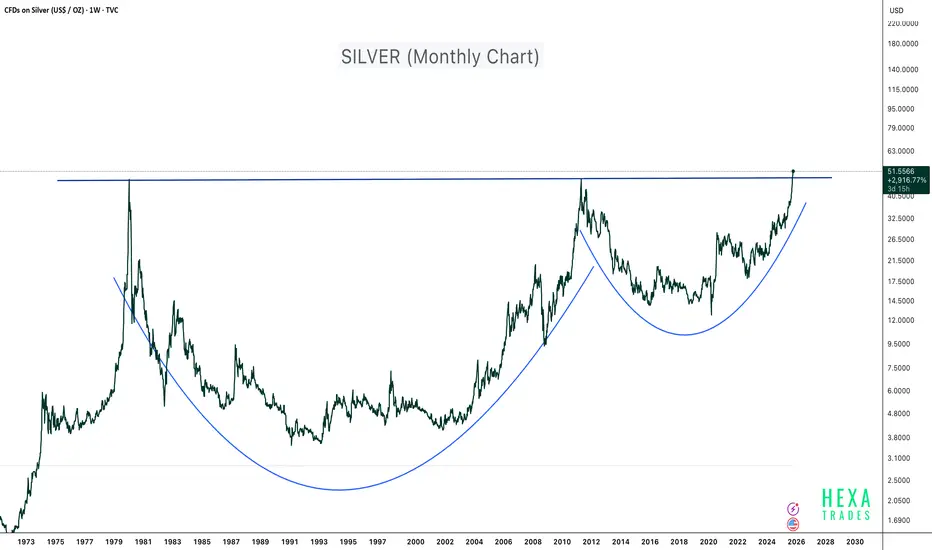
Silver - 45 Years of Breakout!Silver has just completed one of the largest and longest cup and handle patterns in financial history, spanning more than four decades. The metal has officially broken above the 1980 and 2011 highs, signaling a potential supercycle breakout on the monthly timeframe.
This type of long-term technical structure typically marks the beginning of a massive secular bull run, often driven by macroeconomic shifts such as inflation cycles, fiat currency debasement, and rising demand for hard assets.
Technical Highlights:
- Pattern: 45-year Cup and Handle formation
- Breakout Zone: Above $50 confirmed (Weekly chart)
- Structure: Deep base formation showing multiple accumulation phases (1981–2001 and 2012–2023)
Macro Perspective:
Silver is benefiting from:
- Increased industrial demand (especially in solar, EV, and electronics sectors)
- Inflationary monetary policies and growing global money supply
- Renewed investor interest in tangible and real assets
This breakout could mark the start of a multi-year bull run for silver. Long-term investors may view this as an opportunity to accumulate and hold for 10–15 years, aligning with the magnitude and duration of the pattern.
If the price experiences short-term pullbacks in the coming months, use DCA (Dollar-Cost Averaging) to build long-term exposure.
Conclusion:
After 45 years of consolidation, silver is finally breaking free. The chart points toward a historic structural breakout, potentially setting the stage for the next precious metals supercycle.
Cheers
Hexa
Disclaimer:
This analysis is for educational purposes only and does not constitute financial advice. Always conduct your own research and manage risk responsibly.
YTD 2025 Market Performance Overview by ProjectSyndicate
🟡 1. YTD 2025 Market Performance Summary
Below is a snapshot of major asset class returns through 2025 YTD:
📊 Performance Infographic – YTD Returns (2025)
• Precious Metals
◦ 🥈 Silver: +150%
◦ 🥇 Platinum: +147%
◦ 🪙 Palladium: +92%
◦ 🟡 Gold: +64%
• Equity Markets
◦ 📈 Nikkei: +27%
◦ 📈 DAX: +22%
◦ 📈 QQQ: +22%
• Cryptocurrencies (Risk Assets)
◦ 🪙 Bitcoin (BTC): –4%
◦ 🪙 Ethereum (ETH): –10%
Insight: Classic safe havens precious metals vastly outperformed equities and digital assets through 2025, reflecting both macro uncertainty and the ongoing demand for real assets.
🌟 2. Key Investment Themes for 2025
🔶 A. Precious Metals Rally
Performance Drivers:
• Elevated inflation expectations and rate cut prospects pushed investors into hard assets.
• Silver’s industrial demand (EVs, solar, electrification) amplified its gain vs. gold.
• Platinum & palladium benefited from supply constraints and vehicle emissions tech demand.
• Safe-haven demand lifted gold to multi-decade highs.
🤖 B. AI Technology Sector
While we don’t have precise index returns in this report for AI technology stocks, broad AI adoption drove significant equity performance — especially among semiconductor and AI platform leaders:
• NVDA Nvidia — continued leadership in AI compute.
• AMD — robust gains from data-center and AI client demand.
🧬 C. Biotechnology & Innovation
Biotech remains a structural growth sector due to:
• Aging demographics and healthcare demand.
• New drug modalities and AI-assisted discovery.
• Continued regulatory approvals of new therapeutic classes.
Although biotech performance varies by sub-sector, its role in diversified growth portfolios remains strong.
⚠️ D. Crypto Markets — Flat to Red
• BTC and ETH posted slight declines YTD, contrasting sharply with metals and equities.
• Cryptocurrencies did not act as “digital gold” in 2025 — failing to preserve value relative to hard assets.
Implication: Risk on/off dynamics favored traditional safe havens over digital assets this year.
📅 3. 2026 Gold Price Forecasts — Institutional Consensus
Gold closed 2025 at record highs, and analysts project continued strength in 2026, with a wide range of forecast scenarios:
📈 Gold Price Forecasts for 2026
Forecast Source 2026 Target Notes
J.P. Morgan Global Research ~$5,055/oz (Q4) Strong demand & diversification drivers.
JP Morgan Private Bank / Argonaut ~$5,200–$5,300/oz Elevated institutional demand scenarios.
Goldman Sachs ~$4,900/oz Supported by central bank demand and rate cuts.
Bank of America ~$5,000/oz Broad institutional view.
UBS ~$4,500 (mid-year) Moderately bullish.
World Gold Council (Bear Scenario) ~$3,360–$3,990/oz Bearish if reflation reduces safe-haven demand.
Macro Consensus / Technical Models ~$4,000–$5,300/oz Consensus range based on surveys and models.
Longer-Term & High Estimates $6,000+ More speculative long forecast.
🧠 4. Strategy & Portfolio Implications
📌 Safe Haven Allocation
Given the robust 2025 performance and continued demand drivers, consider maintaining allocations to:
• Physical gold & ETFs
• Silver & industrial metals exposure
• Mining equities and royalty companies
📌 Growth & Innovation Exposure
Balance metals and defensive positioning with growth via:
• AI & semiconductors
• Biotechnology themes
• Select equities in cyclical markets
📌 Crypto Positioning
Given flat/red performance in 2025:
• Reassess crypto allocations relative to risk tolerance.
• Focus on long-term structural adoption catalysts if retaining exposure.
🏁 5. Conclusion
2025 reinforced the case for diversification across asset classes.
• Precious metals delivered standout returns — driven by safe haven demand, supply constraints, and monetary dynamics.
• AI technology and biotech remain secular growth themes, offering upside in equity portfolios.
• Crypto assets lagged traditional hedges, highlighting continued market segmentation in risk assets.
• 2026 gold price forecasts are broadly bullish, though with a wide range of scenarios — from conservative to highly aggressive institutional estimates.

Potential Top On XAGUSD, Possible Chance At FOMO Remedy!?OANDA:XAGUSD has seen an impressive rally in price all month of December since breaking out of the grip of the Resistance Level @ 54.45 that held it from October until late November, but the rally may be showing signs of exhaustion at new All Time Highs!
Starting this week we see OANDA:XAGUSD put in a new All Time High @ 83.921 and since then has put in a Low @ 74.874, just above the 23.6% Fibonacci Retracement level.
Now, if price fails to continue pushing higher and falls below the current Low at the 23.6% level, this Bullish momentum will have cooled down and we could then see OANDA:XAGUSD put in a deeper Pullback.
The favorable level I see is the 50% Fibonacci Retracement level @ 64.728.
Fundamentally, metals seem to be softening with Trump and Zelensky "closer to a peace deal" with the Ukraine/Russian conflict but with all the global and economic uncertainty, future rate cuts and struggle with the TVC:DXY , we should not count out that this mere decline is anything more then a simple Pullback.
www.tradingview.com
