Daily Outlook on GSVR Guanajuato Silver CompanyThis is my updated daily outlook on TSXV:GSVR . The last outlook has played out pretty well so far (see linked publications), will the next leg?
We are at the point in the chart were yellow wave (3) could be underway, if so we should see a strong move higher with GSVR potentially moving 150+ %.
More comments on the chart.
Silver

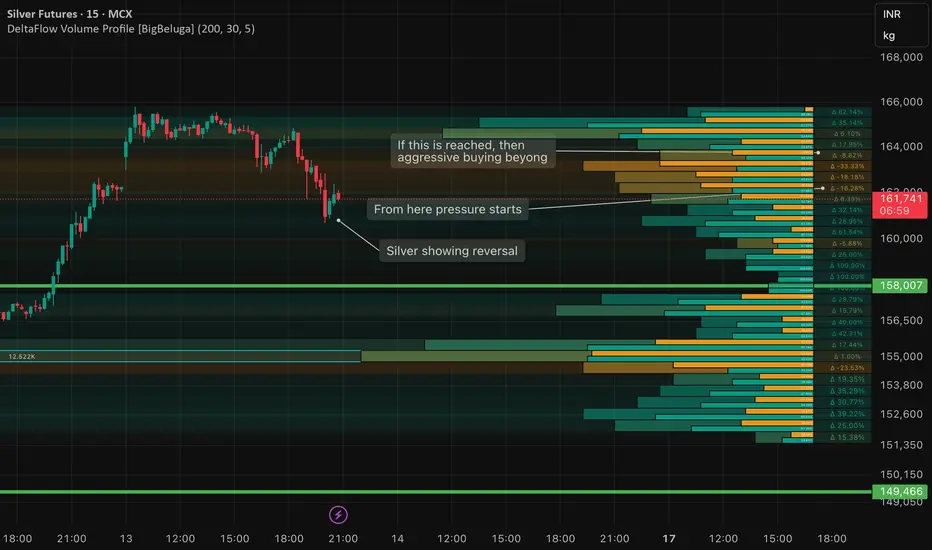
SILVER showing reversal from lower levels as US Govt reopensSilver crashes and wipes away entire day's gain by falling around 3000 points on MCX and is now showing a reversal on 15 min chart as investors turned to precious metals as a hedge against rising global uncertainties. Hopes of upcoming Federal Reserve rate cuts—driven by signs of a softening US job market—also boosted sentiment. Supply-side worries added further support, with India’s wedding season increasing demand and concerns emerging over possible US tariffs on silver. Additionally, the US Department of the Interior recently classified silver, copper, and metallurgical coal as “critical minerals,” underscoring their strategic economic importance. This new status could pave the way for Section 232 investigations and potential trade restrictions, similar to the actions taken on copper earlier this year.
Silver Cup & Handle formation!In Daily charts, the Silver seems to be forming a "Cup & Handle" formation that may drop the price around 52...

Silver (SLV): Multi-Year Cup & Handle SetupSilver appears to be repeating the same large-scale institutional “Cup and Handle” structure that played out almost perfectly on Gold.
The difference is that in SLV (iShares Silver Trust), the chart history is shorter, so the full formation is not as clearly visible — but if we reference the historical silver chart (since 1802), the pattern becomes unmistakable.
That long-term chart shows a massive multi-decade rounded base — the cup — and now price has already touched the upper boundary, effectively activating the pattern.
🧠 Technical Context
On the long-term silver chart, the handle represents the multi-year consolidation we’ve seen since the 2011 peak.
In SLV, this structure is compressed, but the correlation with physical silver remains ~99%, since the fund is backed by over 90% physical silver holdings.
This makes SLV an ideal instrument for expressing long-term silver exposure — it tracks spot silver almost tick-for-tick, while providing the liquidity and accessibility of an ETF.
Technically, silver has already tested the upper rim of the cup, confirming that the pattern is active.
This breakout will likely be followed by a short-term consolidation (the final part of the handle) before the market enters what could become a multi-year rally phase.
Based on historical fractals and volume structure, the first major pullback is expected toward the $35–25 zone, which corresponds to the previous 4th-wave cluster — a classic accumulation area in Elliott terms.
I’ll be looking to accumulate aggressively in the $35–30 range, scaling in gradually as price approaches those levels.
🎯 Trade Plan
Instrument: SLV (iShares Silver Trust ETF)
Correlation to Spot Silver: ~99%
Primary Support Zone (Accumulation): $25 – $35
Handle Breakout Level: around $50
Long-Term Target: $800+ (silver spot equivalent)
Stop-Loss: per individual risk management
Time Horizon: 5+ years
Once silver completes its consolidation and breaks above $50, the measured move of the Cup and Handle suggests a multi-hundred percent rally that could unfold over the next decade.
The breakout will likely be accompanied by rising institutional volume and strong follow-through momentum.
🧭 Strategic View
I trade silver exclusively through SLV, as it offers the most direct and reliable exposure to the underlying metal.
The fund’s near-perfect correlation with spot silver makes it ideal for implementing long-term accumulation strategies without the operational complexities of futures or CFDs.
This will be one of my core positions for the coming decade.
After the expected correction into the $30–35 range, I plan to build a large position, possibly hedged later on, and hold through the full bullish cycle.
Silver’s technical structure, macro fundamentals, and historical analogs all point toward a potential generational rally once this base completes.
This is the setup I’m positioning for — patiently, systematically, and with conviction.
Summary
Long-term “Cup and Handle” formation now confirmed
Final correction expected before the next secular rally
SLV offers near-1:1 tracking with physical silver
Accumulation zone: $35–25
Target: $800+ over the next decade

Silver Breaks All Levels – New ATH Coming Soon?1. What Happened This Week
Even more aggressive than Gold, Silver delivered an explosive rally, completely blowing past my “normal” target at the 50.50 zone. The move has been vertical, with the metal rising over 10% in just three days — an extremely rare occurrence for a major precious metal.
2. Current Market Context
At the time of writing, Silver is trading directly inside the old all-time-high zone above 54, and the probability of a new ATH being printed soon is very high.
However, as with Gold, trading this kind of momentum with leverage becomes almost impossible. Moves are too fast, volatility is too extreme, and normal risk management gets distorted.
3. Technical Outlook
Technically, Silver is sitting inside major resistance and is clearly overstretched.
But overstretched does not mean it cannot go another 2,000 pips higher before any meaningful correction — the current flow is too strong to underestimate.
Key support levels on the way down:
- 50.50 – first important structural support
- 49.50 – deeper but still valid support
4. Trading Plan
At this point:
- Shorting is pure gambling.
- Buying is also risky — entries are too high and volatility too elevated.
Therefore, the smart trade is to stay patient and simply observe, waiting for a cleaner structure and better levels before participating again.
5. Conclusion
Silver is in a powerful breakout phase, trading inside ATH territory with strong momentum. The trend is bullish, but conditions are extreme, and the best approach now is to stay on the sidelines until the market offers a safer opportunity. ⚡️

Stop!Loss|Market View: SILVER🙌 Stop!Loss team welcomes you❗️
In this post, we're going to talk about the near-term outlook for SILVER ☝️
Potential trade setup:
🔔Entry level: 50.07771
💰TP: 45.90144
⛔️SL: 51.62853
"Market View" - a brief analysis of trading instruments, covering the most important aspects of the FOREX market.
👇 In the comments 👇 you can type the trading instrument you'd like to analyze, and we'll talk about it in our next posts.
💬 Description: As noted earlier regarding gold, despite the aggressive short-term strengthening of metals, medium- and long-term selling pressure remains. Both gold and silver are trading near key resistance levels, indicating a potential reversal. A further approach to 52 is not ruled out for silver, so shorter-term selling is looked for if the price approaches 50, and it's best to wait for the price to close below 50.
Thanks for your support 🚀
Profits for all ✅
❗️ Updates on this idea can be found below 👇

Silver prices resume their rally on soft labor data
Silver prices continue to rally, supported by a flight to safe assets amid weakening labor data and growing expectations of additional Fed rate cuts.
ADP data showed an average of 11,250 workers laid off per week in Oct, confirming a rapid cooling in labor market conditions. The NFIB Small Business Optimism Index fell for the second straight month to 98.2 (prev. 98.9, cons. 98.3), marking the lowest level since the Apr reciprocal tariff announcement.
XAGUSD extends its steady rally, breaking above 52.50 again. Diverging EMAs indicate a potential extension of bullish momentum. If XAGUSD closes above 52.50, the price may advance toward 54.50. Conversely, if XAGUSD breaks below 52.50, the price could retreat toward 51.00.

Moon Boys don't want you to see this Bitcoin/Gold chart !Hi Guys,
We have a massive head & shoulders on the Bitcoin / Gold chart that almost nobody talks about! With all the major players being openly bullish on Bitcoin and while everyone is waiting for the AI bubble to burst ..Bitcoin will be the first one to react considering how easy it can be sold and how volatile it usually is.
The charts don't lie and all markets are clearly at the top so protect you capital at all cost while you still can.
Let me know what do you guys think about this.

What's the point of buying now ?Gold is overbought at levels which is basically not seen in modern history. Being long right now makes no sense. I'm personally short.
Disclaimer: I've been a gold bug all these years

US Re-Opening - Price Will Guide Us (Key Technicals and Tickers)The US House of Reps vote to re-open the government. A simple majority is needed
and it's very possible that by Thursday, the longest shutdown in history can officially end.
Will the price action use this positively or negatively?
US Inflation data is due Thursday and Friday, but with the long shutdown, it's difficult
to trust the number's relevance if it prints. My third party inflation metrics have
been showing a steady uptick in inflation since August 2025
Market seasonality has been nearly non-existent in 2025 post Liberation Day lows,
so I'm watching price action closely to see if the bulls can maintain a stable melt-up
into year end and avoid a deeper correction than 3-4% like we observed Oct 10 and
early November
Key Watchlist Items
SPX, SPY, QQQ, DIA, IWM
Gold, Silver, BTC
US10Y
DXY, CHF, JPY overall strength or weakness
Never a dull moment - I'll be watching!!!
-Chris Pulver

From Gold to Silver — The Next Big Move on XAGUSD Following our previous series of Gold analyses, where that massive drop unfolded exactly as projected,
this time we’re turning our focus to Silver (XAGUSD) ⚡️
After completing a clear five-wave decline, Silver has been forming a corrective rally as wave (ii) —and it now seems to be in the final subwaves of this correction.
The market looks ready to kick off wave (iii) to the downside, which is often the most powerful and impulsive leg in the entire sequence! 🔥
📍The current zone is where we expect the correction to end and the main bearish trend to take control once again.
As always, patience and precision matter most here — the next move could define the market’s direction for the coming weeks.
--------------------------------------------------------------------------------------------
🚀 Who am I?
I'm Mahdi, a prop firm trader with 7+ years of experience in technical analysis, mainly focusing on Smart Money Concepts and Elliott Wave theory.
I specialize in delivering high-quality trading signals, market insights, and educational content tailored for serious traders and investors.
📊 My Tools: SMC, Elliott Wave, Fibonacci, Liquidity Grabs, Order Blocks
💼 Prop Challenge Passed: Yes | Funded Account: In Progress
🔗 Follow for consistent updates and trading insights.

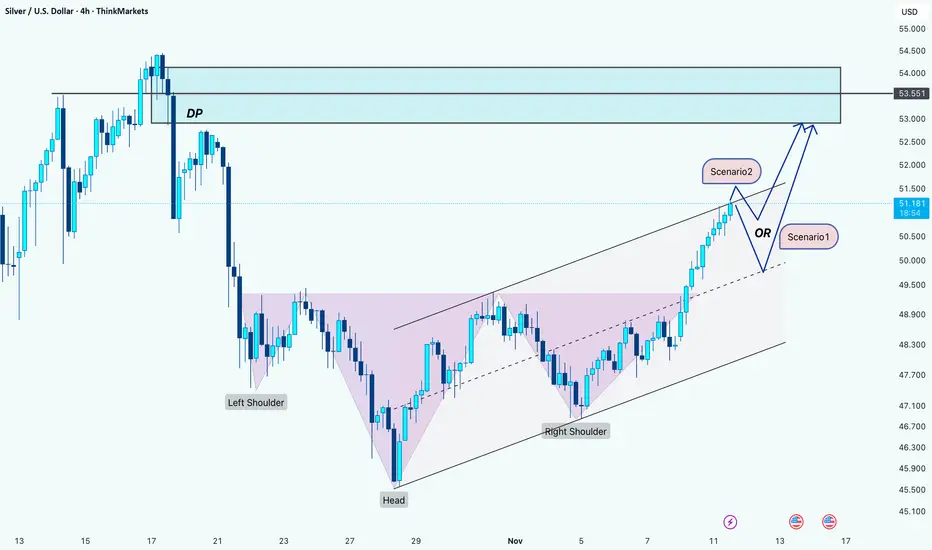
Silver: Approaching Major DP Zone With Two Possible Paths to 53Hi Team!
Silver has completed a clean inverse Head & Shoulders pattern and is climbing steadily within a rising channel. Bullish momentum remains intact as price moves toward the DP (Decision Point) zone, which aligns with a key supply area from the previous breakdown.
As price approaches this zone, two scenarios remain most likely:
Scenario 1:
A rejection from the upper boundary of the channel, leading to a corrective pullback toward the mid-channel or lower trendline, before resuming higher toward the $52.9 target.
Scenario 2:
A shallow pullback or brief consolidation just below the DP zone, followed by bullish continuation that drives price directly into the $52.9 target and possibly beyond.
Regardless of which path plays out, both scenarios point toward the same upside objective at $52.9, as long as the rising channel structure remains intact.
Disclaimer: As part of ThinkMarkets’ Influencer Program, I am sponsored to share and publish their charts in my analysis.
SILVER (XAGUSD) | 100-Year Setup Bracing for $3,382 Surge🥈 SILVER | The Supercycle Unfolding — Eyeing $243, Then $3,382 ⚡
Silver has been following a textbook Elliott Wave Supercycle since the 1970s. Wave 1 topped in 1980 near $50, Wave 2 bottomed in 1991 with a deep 0.786 retracement , and since then, we’ve been in a massive Wave 3 that’s still playing out.
Within this ongoing Supercycle Wave 3, we’ve seen five major macro waves:
Wave 1 (1991–1998) – the first impulsive leg.
Wave 2 (1998–2001) – retraced 0.786.
Wave 3 (2001–2011) – the big run to $49.
Wave 4 (2011–2020) – a long 0.5 retracement and re-accumulation phase.
Wave 5 (2020–Now) – the current and final advance of this Supercycle wave.
Inside the current Macro Wave 5 , we’ve already seen Micro 1 top in 2021, Micro 2 bottom in 2022 (0.5 pullback) , and now Micro 3 is underway , targeting the 2.618–3.618 Fib zone ($71–$123) . After that, a Micro 4 correction should follow (around 0.382–0.5), then Micro 5 could push to roughly $243 , which aligns with the 1.618 extension of the entire Supercycle (1)-(2) .
That $243 level may mark the end of Supercycle Wave 3 , setting up for Wave 4 , a long-term correction likely into the $90–$120 rang e (0.382–0.5 retracement). From there, the final Supercycle Wave 5 could begin — a massive impulsive phase aiming for the 2.618 Fibonacci extension near $3,382 🌕
The structure, Fibonacci ratios, and long-term fundamentals all support this roadmap. Industrial demand (solar, EVs, electronics) and ongoing monetary debasement continue to build the fundamental base for a multi-decade silver bull cycle.
📈 We’re in the late stages of Supercycle Wave 3 — and the calm before silver’s next historic acceleration. ⚡
Follow this century-long Silver Supercycle closely — the final wave is unfolding and $3,382 is in sight. Bookmark this idea to track each micro and macro move, and comment your target or thoughts on the Wave 5 breakout. Let’s see who spots the historic setup first!
— Team FIBCOS
#Silver #PreciousMetals #Supercycle #ElliottWave #Fibonacci #MarketStructure #SmartMoneyConcept #LongTermBull #TradingSetup #TechnicalAnalysis #MacroTrend #Commodities

GOLD | RSI Hidden bull divs | GTradingMethodHello Traders,
It’s been a while since my last post — I’ve been focusing more on trading execution than building the brand.
But what a chart to come back with… who went long on Gold today?
🧐 Market Overview:
Gold has been consolidating since the strong leg up on the 5th of November, forming a textbook bull flag. Today’s breakout came with a great piece of confluence - Hidden bullish RSI divergence. Price created higher lows while RSI printed lower lows (check the red markings on RSI and price).
📊 Trade Plan:
Already long from this setup.
If price pulls back for a clean retest of the flag breakout, I’ll be adding more longs.
💡 GTradingMethod Tip:
Hidden divergence is one of the strongest continuation signals. It doesn’t predict reversal — it confirms trend strength. Pair it with a pattern like a bull flag and you’ve got a high-probability structure.
🙏 Thanks for checking out my post!
Make sure to follow me to catch the next idea and please share your thoughts — I’d love to hear what your thoughts on gold are?
📌 Please note:
This is not financial advice. This content is to track my trading journey and for educational purposes only.

XAUUSD-GOLD-4H / at a Crossroads: Symmetrical Triangle AnalysisDear Traders,
I’ve prepared a special XAUUSD–gold analysis for you. Gold is currently moving within a symmetrical triangle formation. If gold breaks upward within this triangle and closes a candle, the first target will be the 4160 level. If it breaks downward, the first target will be the 3800 level.
I share these insights because I truly value you. Each follower is precious to me, and together we are like a family here. Every like and show of support motivates me to continue providing these analyses. Thank you sincerely to everyone who stands by me.
With respect and affection.
-TraderTilki

XAGUSD H4 | Bearish Reversal off ResistanceMomentum: Weak Bullish
Sell entry: 51.39
- Pullback resistance
Stop Loss: 52.728
- Swing high resistance
- 78.6% Fib retracement
Take Profit: 49.256
- Pullback support
Stratos Markets Limited (tradu.com/uk ):
CFDs are complex instruments and come with a high risk of losing money rapidly due to leverage. 68% of retail investor accounts lose money when trading CFDs with this provider. You should consider whether you understand how CFDs work and whether you can afford to take the high risk of losing your money.
Stratos Europe Ltd (tradu.com/eu ):
CFDs are complex instruments and come with a high risk of losing money rapidly due to leverage. 70% of retail investor accounts lose money when trading CFDs with this provider. You should consider whether you understand how CFDs work and whether you can afford to take the high risk of losing your money.

Silver (XAGUSD) 4H – Potential Ending Diagonal in C of (B)Price action in the 4H chart for Silver suggests we’re nearing the completion of a possible zigzag, with wave C possibly building out a clear ending diagonal (wedge) in the final leg of (B). This aligns with classic Elliott Wave behaviour, where a wedge pattern often signals the conclusion of a strong corrective rally before a significant reversal or new trend begins.
The current rally is testing both the upper parallel and key Fibonacci zones (0.618/0.764).
Watch for breakdown triggers below wedge support, which would confirm the reversal and set up a new bearish sequence.
If price keeps grinding higher within the wedge, further subdivisions may occur before wave C/B finally tops.
What’s your view on this structure? Do you expect a deeper reversal or more upside first? Share your ideas below!

The Dual Catalyst: Why Silver's \$50 Breakout is SustainableSilver (XAG/USD) recently broke the crucial $50 per ounce level, signaling a fundamental shift in its market dynamics. While the price edges lower in the short term, primarily due to a strengthened US Dollar (USD), its long-term trajectory is decisively bullish. This surge is not merely speculative. It is driven by an unprecedented convergence of geopolitical risks, critical industrial demand, and shifting macroeconomic policy. Analyzing these catalysts across multiple domains confirms silver's evolving role from a precious metal to a critical industrial asset.
Macroeconomics and Geopolitics
Silver's price strength reflects global systemic risk and monetary policy uncertainty. Current market expectations strongly favor a Federal Reserve (Fed) rate cut by December, with a nearly 68% probability priced in by the CME FedWatch Tool. Lower interest rates reduce the opportunity cost of holding non-yielding silver, making it relatively more attractive than bonds or cash. This dovish outlook provides a powerful structural floor for the price.
From a geopolitical perspective, ongoing global tensions and elevated political risks, like recent US government funding debates, accelerate safe-haven demand. Investors seek hard assets to hedge systemic risks. While gold often leads as the primary safe haven, silver's lower cost and dual-use nature attract broader retail and institutional flows, pushing it higher. A strong, sustained rally will require the price to hold above $50 and overcome the next major resistance near the historical high of $54.50.
Technology, Science, and Patents
Industrial demand now constitutes over 50% of silver’s total annual consumption, fundamentally redefining its market. Its unmatched electrical and thermal conductivity makes it indispensable in high-growth sectors.
* Renewable Energy: Silver is critical for photovoltaics (PV), specifically in solar cells, which form the conductive paste that harvests electrons. The global push for green energy and solar capacity expansion creates structural, persistent demand that consistently tightens the market.
* High-Tech and EVs: Electric Vehicles ( EVs) require significantly more silver (25–50 grams per unit) than traditional vehicles for inverters, battery management systems, and high-voltage contacts. The expansion of 5G technology, advanced computing, and the Internet of Things (IoT) further relies on silver-based components for seamless connectivity and efficiency.
Geostrategy and Supply Chain Risk
Silver is now recognized as a critical mineral by several major economies. This reclassification acknowledges its essential role in national security, advanced manufacturing, and the energy transition. This status highlights a geopolitical vulnerability: silver's supply chain is increasingly seen as a strategic concern.
The market currently runs a persistent supply deficit, depleting above-ground stockpiles to critically low levels. Mining silver often occurs as a byproduct of copper, lead, and zinc, meaning its supply cannot easily scale up based on price alone. Trade conflicts or export controls imposed by major producing nations could severely disrupt supply, immediately spiking the price due to its non-substitutable role in key high-tech applications.
Cyber and Economics: The Future Nexus
Silver’s unique properties extend into emerging fields like cybersecurity* and advanced computing. Research integrates silver nanoparticles and quantum materials into sophisticated systems. These materials enhance data processing efficiency and bolster the security of financial supply chains. Furthermore, flexible electronics using silver nanowires* will drive the next generation of wearable and flexible displays, creating entirely new demand vectors.
The long-term economic case for a $100 silver price remains dependent on this confluence of factors. Sustained high industrial consumption, a breakdown in global supply chains, and a continued environment of monetary debasement must align. Silver has truly become a dual-catalyst metal, positioned to thrive as both a financial safe haven and a fundamental building block of the twenty-first-century green and digital economy.

Bullish Gold - Testing $4200 very soonWe brokes previous sell zones, and now they're our new demand zones.
The resistance levels upcoming are very weak, and I expect gold to pass through them easily.
Overall very bullish

XAG/USD Set for Decline After Finishing Wave YSilver has completed a clear 5-wave upward move, ending near the 51.23 zone, which likely marks the completion of Wave C of the corrective structure. Price action shows rejection from the upper trendline, signaling that buying momentum is fading. This suggests the start of a new A–B–C corrective decline, where Silver could first drop toward 48–47 levels before any temporary bounce. The overall structure remains bearish in the short term unless the price breaks above the 52.76 invalidation zone. In simple terms: rally looks complete → downside correction likely ahead.
Stay tuned!
@Money_Dictators
Thank you :)

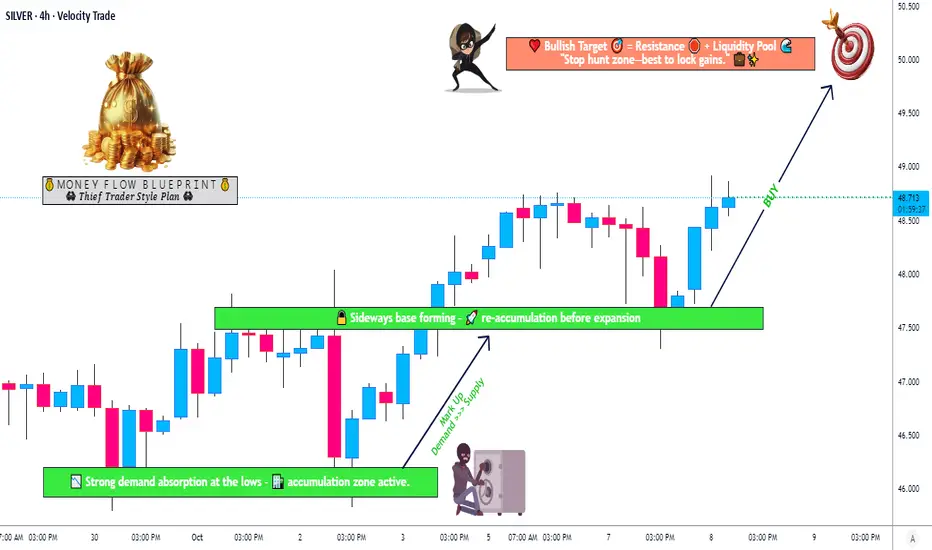
Silver Price Action Update – Smart Money Reaccumulation PhaseXAG/USD "SILVER vs U.S. DOLLAR" — Metal Market Cash Flow Management Strategy 💰
Thief Strategy | Layered Entry | Swing / Day Trade Plan
🧭 Plan Overview
The Bullish momentum in Silver (XAG/USD) has been confirmed through accumulation and re-accumulation phases, signaling a potential continuation move upward.
Smart money appears to be building positions below major resistance — time for us to follow the metal flow. ⚙️
💎 Entry Plan — Thief Layer Style
Thief Strategy = Layered Limit Entries 🧠
We use multiple limit orders to build a smarter position gradually — instead of chasing the price.
Entry Layers:
47.500
48.000
48.500
(You can add more layers based on your own plan and risk appetite.)
🛑 Stop Loss (SL)
This is the Thief SL @47.000.
However, dear Ladies & Gentlemen (Thief OGs) — please manage your own risk.
It’s your money, your strategy, and your exit. 💼
“Make money → Take money → Protect money.”
🎯 Target Zone
A strong resistance zone + overbought conditions may create a trap at the highs.
So, when Silver reaches around $50.000, be smart and secure your profits before the metal traps the late buyers.
Remember: we steal profits, not dreams. 🕶️
💬 Note from the Thief OG
This is a Thief-style strategy — meant for educational fun and insight sharing.
Not a signal service or financial advice.
Use your own judgment and always plan your risk ahead of your entries.
Let’s manage our cash flow, not our emotions. ⚖️
🌍 Related Pairs to Watch (Correlation Check)
OANDA:XAUUSD (Gold) → Often moves in sync with Silver; watch for Gold strength confirmation.
💵 TVC:DXY (U.S. Dollar Index) → Inverse correlation; a weaker USD supports Silver upside.
💰 OANDA:AUDUSD & OANDA:NZDUSD → Commodity-linked currencies; bullish moves support Silver’s strength.
OANDA:XCUUSD → Industrial metals correlation; when Copper rallies, Silver often follows.
Keep your eyes on these pairs — they reveal how liquidity shifts across the metals and forex markets.
✨ “If you find value in my analysis, a 👍 and 🚀 boost is much appreciated — it helps me share more setups with the community!”
⚠️ Disclaimer:
This is a Thief-style trading strategy — shared just for fun and educational purposes.
Always do your own research and trade responsibly. 🧩
#XAGUSD #SilverAnalysis #MetalsMarket #SwingTrade #DayTrading #TechnicalAnalysis #ThiefStrategy #LayeredEntry #CommodityTrading #SmartMoney #BullishSetup #TradingViewCommunity #MarketFlow #TradeResponsibly
14 Year HVF that still offers 7X upside. SILVER Miner. $EXKEndeavour Silver is a mid tier producer with 4 mines in Mexico and Peru.
Focusing on exploration projects across the Americas.
EXK aims to become a leading senior silver producer.
It's Terronera reached commercial production last month and is forecast to process 350k tonnes over the next 6 months with avg grades of 120g/t Silver and 2.5g/T of Gold
EXK has a extensive pipeline of exploration projects.
The company expects free cash flow in Q4 2025 and Q1 2026
Management targets 30M ounces by 2030
EXK is in growth phase by higher production and new mine outputs but has faced earnings pressure due to derivative losses and rising costs. It has a solid asset base, and future earnings outlook anticipate improved cash flows.

Gold Technical Outlook
Price has stabilized around the 4060 resistance zone (confirmation with a 1H or 4H candle close). If the level holds, the bias remains bullish, with potential upward movement toward the 4100 resistance. A break above 4100 would open the way for continued bullish momentum, targeting the next levels at 4133 and 4168.
However, if the price fails to sustain above 4060 and confirms a reversal candle, it may trigger a downside correction toward the 4030 support zone. A confirmed break below 4030 (1H candle close) would likely extend the bearish move toward the 3965 level.
Bias Trend: Bullish
Volatility: High
