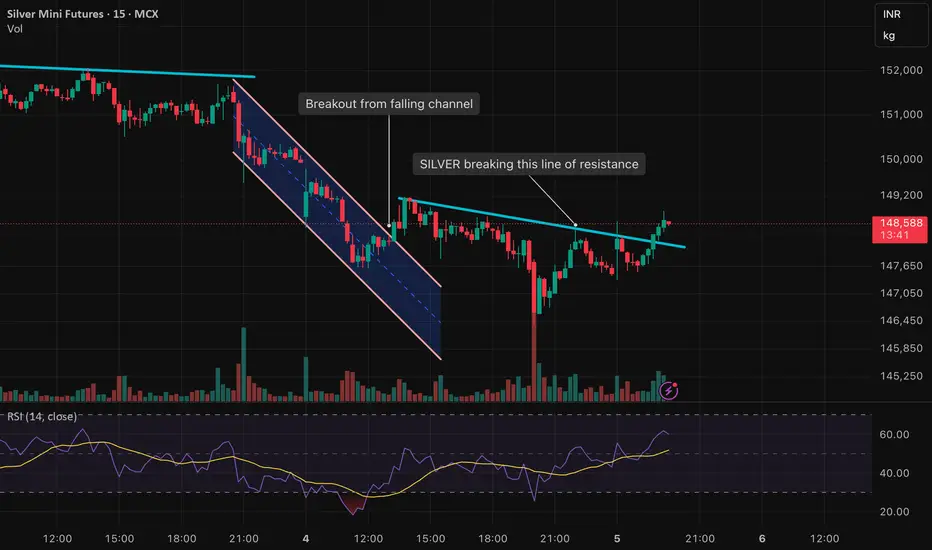
SILVER breaks above Line of ResistanceSILVER price breaks the marked line of resistance. Earlier the chart was respecting this line however this time it broke after US Employment data which is supportive for gold and silvre prices
Silver
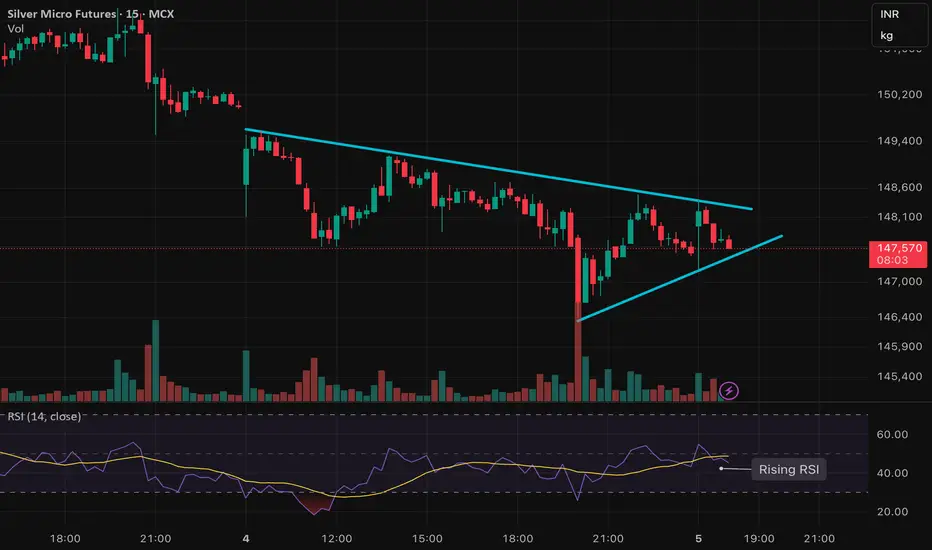
SILVER forming a wedge pattern ready for either side brakoutPrice action on Silver is getting tighter and is now trading inside a wedge formation, which usually leads to a strong move once price breaks out — either up or down. No bias yet, just preparing for momentum on whichever side gives confirmation.
📌 What I’m watching:
• Trendline breakout with volume
• Retest + continuation for safer entries
• Volatility spike around key levels
• RSI & momentum alignment before execution
⚠️ Not a buy/sell call. This is just market observation for educational purposes.
Trade your own plan, manage risk, and respect position sizing.
If you like clean chart breakdowns, price-action setups and real-time market tracking — hit follow so you don’t miss the next update.
SILVER BEARS ARE GAINING STRENGTH|SHORT
SILVER SIGNAL
Trade Direction: short
Entry Level: 4,774.1
Target Level: 4,681.8
Stop Loss: 4,835.8
RISK PROFILE
Risk level: medium
Suggested risk: 1%
Timeframe: 1h
Disclosure: I am part of Trade Nation's Influencer program and receive a monthly fee for using their TradingView charts in my analysis.
✅LIKE AND COMMENT MY IDEAS✅

Stop!Loss|Market View: SILVER🙌 Stop!Loss team welcomes you❗️
In this post, we're going to talk about the near-term outlook for SILVER ☝️
Potential trade setup:
🔔Entry level: 46.55719
💰TP: 43.77818
⛔️SL: 48.46567
"Market View" - a brief analysis of trading instruments, covering the most important aspects of the FOREX market.
👇 In the comments 👇 you can type the trading instrument you'd like to analyze, and we'll talk about it in our next posts.
💬 Description: Metals also continue to feel pressure from the USD. Mid-term sell priorities keep going, with silver still expected to see targets in the 40-42 range. The primary scenario remains a breakout of 47.48680 and a move toward these targets. An alternative scenario is manipulation near the POC (point of control) followed by a downward reversal.
Thanks for your support 🚀
Profits for all ✅
❗️ Updates on this idea can be found below 👇

Stop!Loss|Market View: GOLD🙌 Stop!Loss team welcomes you❗️
In this post, we're going to talk about the near-term outlook for GOLD ☝️
Potential trade setup:
🔔Entry level: 3973.498
💰TP: 3652.481
⛔️SL: 4079.122
"Market View" - a brief analysis of trading instruments, covering the most important aspects of the FOREX market.
👇 In the comments 👇 you can type the trading instrument you'd like to analyze, and we'll talk about it in our next posts.
💬 Description: There is still a lot of pressure on metals to sell because the point of control (POC) has shifted to current prices. This situation suggests attempts to buy back the metal amid a downward correction, but as we can see, the price is not yet favoring buying. However, a retest of the 4100-4150 area is not ruled out, which could also prompt a sell-off. The main sell scenario is a decline from current prices toward the previously mentioned 3600-3700 area.
Thanks for your support 🚀
Profits for all ✅
❗️ Updates on this idea can be found below 👇

Silver (XAGUSD): Possible buy setupSilver (XAGUSD): Possible buy setup. Plan is clear. I think this is SMT and there will be a huge amount of liquidity here. Let's see if I am right.
Cheers

Silver (XAGUSD): Possible buy setup, refinedSilver (XAGUSD): Possible buy setup, refined. Price took more liquidity before going bullish.
Cheers

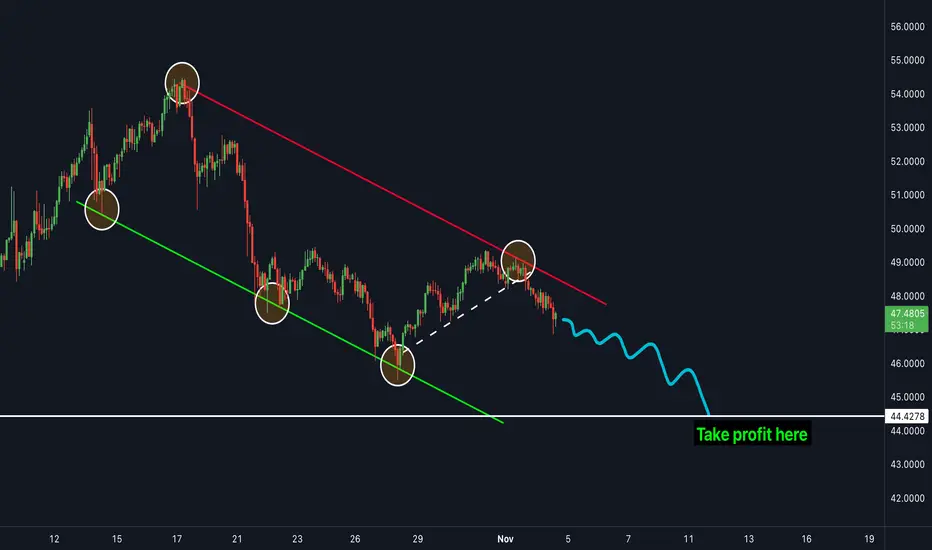
SILVER is ready to drop more - SELL NOW!Silver has been in a clear downtrend for the last few weeks and has struggled to move to the upside. The price is currently in between a bearish channel and is bouncing in-between both resistance and support zones. The price broke the most recent trendline (shown in white) which acted as a support zone. The next target is the white line shown on the chart as "take profit". This is the next major support zone which the price is very likely to hit next.
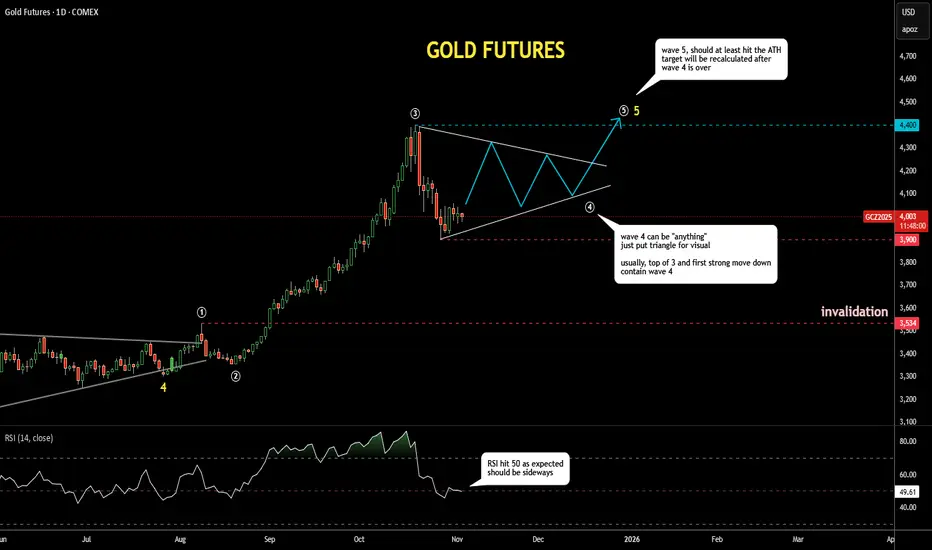
Gold Update 04NOV2025: Wave 4 Dropped Into Target AreaGold futures dropped into the pink-box target area based on the Fibonacci retracement between $3,750 and $4,000.
As expected, the RSI has reached the 50 “waterline”, where it could find some support and start moving around that level.
Many traders lose money in fourth waves, as they can be “anything” and often last longer than one’s pocket. I’ve outlined a triangle shape in wave 4 just for visual context.
The range built through the peak of wave 3 around $4,400 and the bottom of recent panic selling near $3,900 will likely contain most of the volatility in wave 4.
It can take time… testing one’s patience.
SILVER Will Go Higher! Long!
Take a look at our analysis for SILVER.
Time Frame: 1D
Current Trend: Bullish
Sentiment: Oversold (based on 7-period RSI)
Forecast: Bullish
The market is approaching a key horizontal level 4,796.6.
Considering the today's price action, probabilities will be high to see a movement to 5,274.4.
P.S
Overbought describes a period of time where there has been a significant and consistent upward move in price over a period of time without much pullback.
Like and subscribe and comment my ideas if you enjoy them!

XAGUSDXAGUSD price is in a correction phase, there is a possibility that the price will test the support level of 44$. If the price can hold above the level of 43.90, it is expected that the price will have a chance to rebound.
** Very Risky Trade
🔥Trading futures, forex, CFDs and stocks carries a risk of loss.
Please consider carefully whether such trading is suitable for you.
>>GooD Luck 😊
❤️ Like and subscribe to never miss a new idea!

$3800 target for Gold coming soonExpecting Gold to have a minor Drop to $3800. Then Hover back to test $4000 again.
So load up when it drops.
Happy investing all!

Silver sideways consolidation capped at 4980Silver remains in a bullish trend, with recent price action showing signs of a corrective pullback within the broader uptrend.
Support Zone: 4737 – a key level from previous consolidation. Price is currently testing or approaching this level.
A bullish rebound from 4737 would confirm ongoing upside momentum, with potential targets at:
4980 – initial resistance
5066 – psychological and structural level
5166 – extended resistance on the longer-term chart
Bearish Scenario:
A confirmed break and daily close below 4737 would weaken the bullish outlook and suggest deeper downside risk toward:
4667 – minor support
4600 – stronger support and potential demand zone
Outlook:
Bullish bias remains intact while the silver holds above 4737. A sustained break below this level could shift momentum to the downside in the short term.
This communication is for informational purposes only and should not be viewed as any form of recommendation as to a particular course of action or as investment advice. It is not intended as an offer or solicitation for the purchase or sale of any financial instrument or as an official confirmation of any transaction. Opinions, estimates and assumptions expressed herein are made as of the date of this communication and are subject to change without notice. This communication has been prepared based upon information, including market prices, data and other information, believed to be reliable; however, Trade Nation does not warrant its completeness or accuracy. All market prices and market data contained in or attached to this communication are indicative and subject to change without notice.

XAGUSD - Silver BUY CAPITALCOM:SILVER
Previously, Silver had a huge selloff, but on October 28, price on Daily timeframe tapped into 50 EMA, created a doji candle and failed to make LL to support continuing sell bias
Price on 1H, 4H, and Daily timeframe are all trading above EMA50
4H making HH-HL and recently broke above major resistance at 48.6, where bearish momentum appeared to sit at.
After breaking above said resistance, price came up and created a HH, then came down to retest the same resistance thats now reacting as support.
While doing so, price came down and tapped into the 50% Fib area, which was also where the previous HH was at, and price then created a strong bullish candle on 4H rejecting that same level.
Scaling down to 1H we can see the 1H candle that closed above a minor pullback LH structure and is also where the 4H closed at. I consider that 1H candle my entry and targeting either -62% Fib or another major resistance at 52.338 .

02.11 - Silver UP Setup based on H4 order flow. Buy orders has been collected so is possible to price go higher to sell silver for better price. Now is time to wait for price sweep liquidity and give lower time confirmation to buy (m5 order flow). Simple as that.

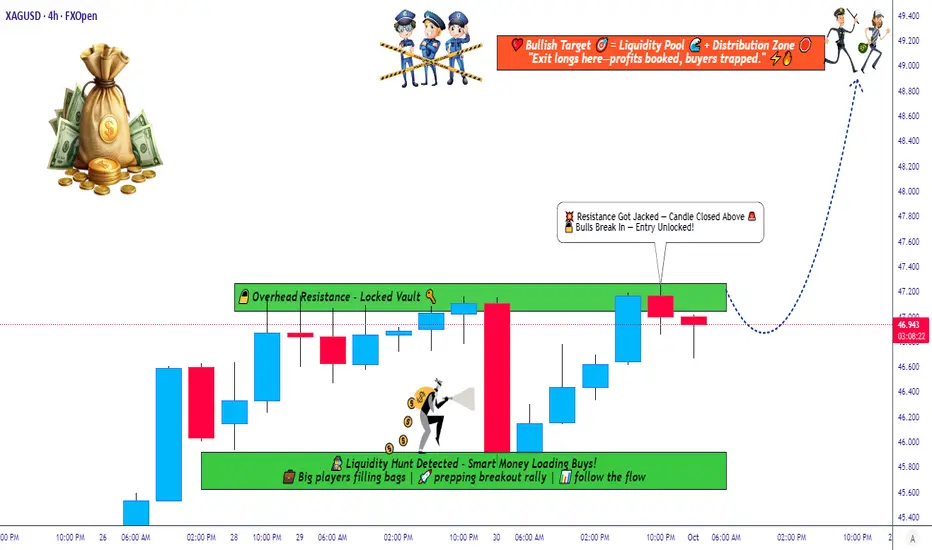
Silver Strategy Map — Thief Layers, Smart Targets, and Risk Zone📊 XAG/USD “Silver vs U.S Dollar” — Metals Market Wealth Strategy Map (Swing/Day Trade)
🔑 Plan: Bullish Setup
This setup follows the “Thief Strategy”, which means using layered limit entries to scale into the trade. Instead of going all-in at one level, we “steal the entries” across multiple layers.
💰 Layered Buy Limit Entries (Example Setup):
46.200
46.400
46.600
46.800
47.000
👉 You can increase layers as per your own plan and risk style.
🛑 Stop Loss (Protective Exit): 45.600
(This is my thief SL — but you’re free to adjust as per your own risk appetite.)
🎯 Target Zone: 49.000
⚠️ Around 49.300, we see a “Police Barricade” (heavy resistance + overbought conditions + potential trap).
That’s where profits should be taken — escape with gains before the trap closes!
Why This Setup?
Support Zones: Strong accumulation zones forming near 45.600–46.000.
Trend Bias: Silver remains bullish in the medium-term metals market outlook.
Layering Strategy Advantage: Reduces entry risk and allows better average fill.
Profit Zone: 49.000 aligns with strong supply area + RSI extension risk.
🔗 Correlation & Related Pairs to Watch
OANDA:XAUUSD (Gold vs USD): Gold often leads Silver’s moves — watch Gold for early signals.
TVC:DXY (US Dollar Index): A weaker USD usually boosts metals.
TVC:PLATINUM & CAPITALCOM:PALLADIUM : Industrial metals correlation — strong moves here can influence Silver sentiment.
TVC:SILVER Futures: Always track COMEX Silver contracts for volume confirmation.
✨ “If you find value in my analysis, a 👍 and 🚀 boost is much appreciated — it helps me share more setups with the community!”
📌 Disclaimer: This is a Thief-style trading strategy, created just for fun and educational sharing. Not financial advice — trade at your own risk.
#XAGUSD #Silver #Metals #TradingStrategy #SwingTrade #DayTrade #ThiefStrategy #Gold #DXY #Forex #Commodities
ADA JESSE LIVERMORE SPECULATIVE ACCUMULATION CYLINDERADA is currently experiencing a Jesse Livermore Accumulation Cylinder described in 1925
Typically this pattern resolves with powerful moves to the upside when presenting in a basing pattern
Other assets that underwent this pattern before explosive moves up are
Palladium
Platinum
Silver
Uranium
MOS
IPI
LEU
LTBR

SILVER My Opinion! SELL!
My dear friends,
Please, find my technical outlook for SILVER below:
The price is coiling around a solid key level - 48.678
Bias - Bearish
Technical Indicators: Pivot Points Low anticipates a potential price reversal.
Super trend shows a clear sell, giving a perfect indicators' convergence.
Goal - 47.933
About Used Indicators:
The pivot point itself is simply the average of the high, low and closing prices from the previous trading day.
Disclosure: I am part of Trade Nation's Influencer program and receive a monthly fee for using their TradingView charts in my analysis.
———————————
WISH YOU ALL LUCK

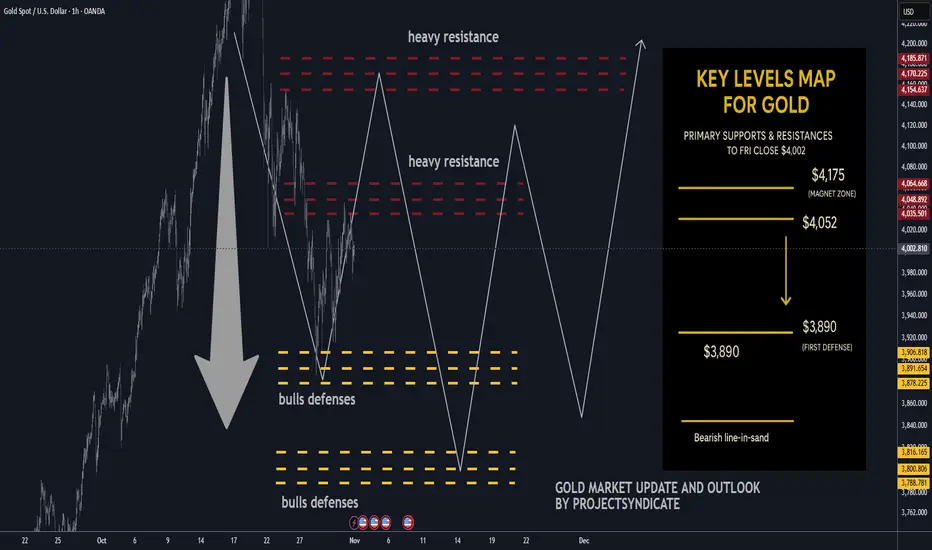
Gold next week: Key S/R Levels and Outlook for Traders🔥 GOLD WEEKLY SNAPSHOT — BY PROJECTSYNDICATE
🏆 High/Close: $4,108 → ~$4,002 — sellers defended overhead; weekly close soft within range.
📈 Trend: Neutral / correction mode still ON; not expecting new highs near term.
🛡 Supports: $3,890 → $3,800 — pivotal shelves for downside containment.
🚧 Resistances: $4,052 / $4,175 — magnet zones for supply / fade attempts.
🧭 Bias next week: Prefer short sells into $4,052–$4,175 with take-profit toward $3,890 → $3,800. Invalidation on sustained reclaim > $4,175; failure of $3,800 risks extension lower.
🌍 Macro tailwinds/headwinds :
• Rates: Real yields stable-to-firm keep upside contained; any dovish surprise could spark squeezes into resistance.
• FX: DXY mixed—lack of broad USD weakness limits impulse follow-through.
• Flows: CB/ETF demand supportive on deep dips but tepid near highs.
• Geopolitics: Event risk provides intermittent bids; not a trend driver this week.
🎯 Street view: Medium-term bullish narratives reserve diversification, policy easing into 2026 remain, but near-term tape favors mean-reversion lower under resistance.
________________________________________
🔝 Key Resistance Zones
• $4,052 — immediate ceiling; prior supply pivot likely to cap first tests
• $4,175 — upper resistance; acceptance above flips tone from corrective to constructive
🛡 Support Zones
• $3,890 — first defense; loss invites momentum probes
• $3,800 — critical structural base; break risks downside acceleration
________________________________________
⚖️ Base Case Scenario
Range-to-soft trade within $3,800–$4,175. Rallies into $4,052–$4,175 are sellable; expect rotations back toward $3,890 with scope to $3,800 if sellers press.
🚀 Breakout Trigger
Only a sustained acceptance > ~$4,175 negates the correction and opens $4,200+ pathing; conversely, firm rejection at $4,052 with a daily close < $3,890 increases odds of a $3,800 test.
💡 Market Drivers
• Fed path & real-yield drift
• USD index swings
• ETF/CB flow tone on dips vs. rips
• Risk sentiment headlines (geopolitics/trade)
🔓 Bull / Bear Trigger Lines
• Bullish above: $4,175 correction phase likely over if held
• Bearish below: $3,890 → risk expands under $3,800
🧭 Strategy
Short-sell from overhead resistances ($4,052 → $4,175).
Scale profits into $3,890 then $3,800; keep stops tight above trigger levels. Stand aside on fresh longs until sustained reclaim above $4,175 reasserts momentum.
SILVER: Long Trading Opportunity
SILVER
- Classic bullish setup
- Our team expects bullish continuation
SUGGESTED TRADE:
Swing Trade
Long SILVER
Entry Point - 48.678
Stop Loss - 48.476
Take Profit - 49.035
Our Risk - 1%
Start protection of your profits from lower levels
Disclosure: I am part of Trade Nation's Influencer program and receive a monthly fee for using their TradingView charts in my analysis.
❤️ Please, support our work with like & comment! ❤️

SILVER 4H - double top before the dropAfter a strong rally, silver retested the 49.0–49.5 area aligning with the key 0.618 Fibonacci level. On the 4H chart, we see a clear double-top pattern with falling volume and oscillator divergence. Price already broke below the short-term trendline and failed to hold above resistance - a classic sign of fading bullish momentum.
Fundamentally, silver faces pressure as the dollar stabilizes and rate-cut expectations fade. Industrial demand from Asia is cooling too, reducing the “safe-haven” appeal.
Tactically, while price stays below 49.5, the path of least resistance is down toward 43.8 and possibly 41.1 - key accumulation zones. A breakout above 50.0 would cancel the bearish setup.
Every silver rally ends the same way - right when everyone starts to believe it’ll never end.

Short in silverAs you can see there is shorting opportunity in silver as well as gold so what is your view on this??????

Silver. XAGUSD Beautiful Elliott wave structureSilver has a textbook elliott wave structure. Wave 3 has hit extension 2,00 — standard region to end wave 3— Now it seems to be working on wave 4. Ideal region to complete this pullback resides between extensions 1,00 and 1,236. Once this 4th wave is completed, Silver will develop wave 5 towards at least extension 2,618
