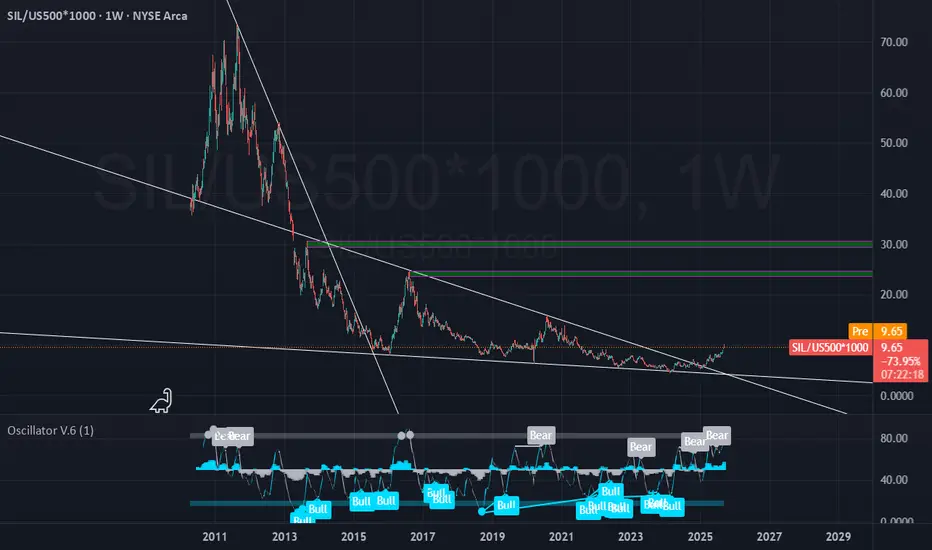
Silver: From Underperforming to OutperformingThe Silver miner ETF has been underperforming the US Stock market for quiet some time.
The times are shifting, seeing the breakout off the Falling Wedge.
Targets from this moment: 100% Minimum
Potentially: 200%+
TLDR: for maximazing performance, you are better off owning SIL ETF (or silver stocks) then the S&P500.
Silver
Silver breakout support retest The Silver remains in a bullish trend, with recent price action showing signs of a continuation breakout within the broader uptrend.
Support Zone: 4144 – a key level from previous consolidation. Price is currently testing or approaching this level.
A bullish rebound from 4144 would confirm ongoing upside momentum, with potential targets at:
4260 – initial resistance
4320 – psychological and structural level
4375 – extended resistance on the longer-term chart
Bearish Scenario:
A confirmed break and daily close below 4144 would weaken the bullish outlook and suggest deeper downside risk toward:
4065 – minor support
4020 – stronger support and potential demand zone
Outlook:
Bullish bias remains intact while the silver holds above 4144. A sustained break below this level could shift momentum to the downside in the short term.
This communication is for informational purposes only and should not be viewed as any form of recommendation as to a particular course of action or as investment advice. It is not intended as an offer or solicitation for the purchase or sale of any financial instrument or as an official confirmation of any transaction. Opinions, estimates and assumptions expressed herein are made as of the date of this communication and are subject to change without notice. This communication has been prepared based upon information, including market prices, data and other information, believed to be reliable; however, Trade Nation does not warrant its completeness or accuracy. All market prices and market data contained in or attached to this communication are indicative and subject to change without notice.

Gold Market Technical Outlook and Key Levels BULLS/BEARS📊 Technical Outlook Update — Gold (H4)
As of 15 Sep 2025
• Spot is holding ~$3,640–3,650/oz after last week’s record spike; price is consolidating since.
• On futures, settlement came in $3,686.40 (Sep 12) with a short-term “bullish breakout” narrative into today’s session.
🏆 Bull Market Overview
▪️ Massive rally now pausing below $3,700; momentum stalling under headline resistance.
▪️ Overhead resistances will limit upside:
— $3,700 (first major cap) • $3,750 (stretch/overshoot)
▪️ Key S/R zones (now):
— Resistance: $3,700 / $3,750
— Support: $3,600 / $3,500 / $3,400 (step-downs)
▪️ Bias: short-term limited upside after the run; risk of liquidity sweep lower before trend resumes.
▪️ October roadmap: looking for a re-test near $3,500 later in the month to reload bullish flow/liquidity.
▪️ Volatility: elevated vs. summer; headline-sensitive into the Fed this week.
⭐️ Recommended Strategy (H4 game plan)
▪️ Sell the first tests into $3,700 / $3,750 with tight risk; fade wicks.
▪️ Buy the dip into $3,600 → $3,500 → $3,400 zones; scale entries, keep stops beyond structure.
▪️ Momentum traders: wait for clean H4 close above $3,700 to target $3,730–$3,750; otherwise fade spikes.
▪️ Position traders: patient bids $3,520–$3,480 zone preferred for October reload.
▪️ If flat right now: no chase—let price come to your levels.
Latest gold market updates
📈 Post-CPI pop kept spot above $3,640, reinforcing dip-buying interest even as the dollar firmed.
📰 Technicians flag bullish breakout dynamics despite intraday chop; futures settled $3,686.40 (Sep 12) ahead of fresh catalysts.
🧭 Context: market is consolidating beneath record highs set last week; pullbacks seen as tactical within a larger uptrend.
Level map
R2: $3,750 (bulls’ stretch / likely exhaust on first touch)
R1: $3,700 (primary cap; fade unless impulsively reclaimed)
S1: $3,600 (first bounce zone; liquidity magnet)
S2: $3,500 (October re-test area to accumulate)
S3: $3,400 (deeper flush / high-conviction buy zone)

XAGUSD H4 | Potential bearish dropSilver (XAG/USD) is reacting off the sell entry which is a pullback resistance and could drop from this level to the downside.
Sell entry is at 41.47, which is a pullback resistance.
Stop loss is at 39.51, which is a swing high resistance.
Take profit is at 39.51, which is a pullback support that is slightly above the 61.8% Fibonacci retracement.
High Risk Investment Warning
Trading Forex/CFDs on margin carries a high level of risk and may not be suitable for all investors. Leverage can work against you.
Stratos Markets Limited (tradu.com ):
CFDs are complex instruments and come with a high risk of losing money rapidly due to leverage. 65% of retail investor accounts lose money when trading CFDs with this provider. You should consider whether you understand how CFDs work and whether you can afford to take the high risk of losing your money.
Stratos Europe Ltd (tradu.com ):
CFDs are complex instruments and come with a high risk of losing money rapidly due to leverage. 66% of retail investor accounts lose money when trading CFDs with this provider. You should consider whether you understand how CFDs work and whether you can afford to take the high risk of losing your money.
Stratos Global LLC (tradu.com ):
Losses can exceed deposits.
Please be advised that the information presented on TradingView is provided to Tradu (‘Company’, ‘we’) by a third-party provider (‘TFA Global Pte Ltd’). Please be reminded that you are solely responsible for the trading decisions on your account. There is a very high degree of risk involved in trading. Any information and/or content is intended entirely for research, educational and informational purposes only and does not constitute investment or consultation advice or investment strategy. The information is not tailored to the investment needs of any specific person and therefore does not involve a consideration of any of the investment objectives, financial situation or needs of any viewer that may receive it. Kindly also note that past performance is not a reliable indicator of future results. Actual results may differ materially from those anticipated in forward-looking or past performance statements. We assume no liability as to the accuracy or completeness of any of the information and/or content provided herein and the Company cannot be held responsible for any omission, mistake nor for any loss or damage including without limitation to any loss of profit which may arise from reliance on any information supplied by TFA Global Pte Ltd.
The speaker(s) is neither an employee, agent nor representative of Tradu and is therefore acting independently. The opinions given are their own, constitute general market commentary, and do not constitute the opinion or advice of Tradu or any form of personal or investment advice. Tradu neither endorses nor guarantees offerings of third-party speakers, nor is Tradu responsible for the content, veracity or opinions of third-party speakers, presenters or participants.

Silver Gonna Jump Hereuptrend to continue on silver after rejections from support level.
scaling in entries on LTFs.

Ride upside for free - how to manage winning tradesSo you have a winning trade, now what?
You did all that work, youve lost before, messed up before, but right now your starring at a winner.
what to do?
There is an art to managing winners. Some strategy.
My strategy, is to try to Ride For Free.
Whenever possible and ideal, get my capital back and keep the rest growing long term, but for free, and no more risk to me.
Check out the video for more on how to do this.

SILVER GROWTH AHEAD|LONG|
✅SILVER has retested a
Strong support level 41.50$
After a local correction move
And I think that we will see
A bullish move up as Silver
Is trading in a uptrend
LONG🚀
✅Like and subscribe to never miss a new idea!✅

Gold | H4 Double Top | GTradingMethodHello Traders,
Is Gold about to confirm a double top on the 4H chart?
This pattern could mark the start of a short-term correction, but I’ll only take action if my trading system confirms all the right variables.
Gold has rallied strongly, but momentum looks to be fading. A double top is forming, and with RSI divergence building, this setup has my attention.
Some of the things my system would need to confirm are:
- H4 candle to close in the entry range
- That candle must close with a specific closure rate
- RSI needs to create another divergence
- Lower volume ideally, though this may be exempted due to upcoming data events
📊 Trade Plan:
Risk/Reward: 4.4
Entry: 3 703.0
Stop Loss: 3 719.7
Take Profit 1 (50%): 3 640.4
Take Profit 2 (50%): 3 616.5
💡 GTradingMethod Tip:
When trading double tops, I project the distance from the highest point to the neckline downward to identify profit targets. This keeps my trade plan systematic and objective.
🙏 Thanks for checking out my post!
Follow me to catch the next update and share your thoughts — I’d love to hear how you’re viewing Gold right now.
📌 Please note: This is not financial advice. This content is to track my trading journey and for educational purposes only.

Gold | 30min Double Top | GTradingMethodHello Traders,
I’m watching a potential double top forming on the 3-minute timeframe. For me to confirm and take this setup, I’ll need additional signals to align before entering.
✅ Conditions before entry:
A 30-minute candle must close within the range.
That candle needs to close with a specific closure rate I require.
RSI must print another divergence to confirm weakening momentum.
📊 Trade Plan:
Risk/Reward: 3.0
Entry: 3,697.15
Stop Loss: 3,703.8
Take Profit 1 (50%): 3,681.2
Take Profit 2 (50%): 3,670.6
🙏 Thanks for checking out my post!
Follow me for the next update. Keen to hear what your predictions on gold are and if you have any questions on how I trade double tops!
📌 Please note: This is not financial advice. This content is to track my trading journey and for educational purposes only.

Buyer Initiative Confirmed — Waiting for the PullbackHi traders and investors!
This analysis is based on the Initiative Analysis concept (IA).
Yesterday, silver formed a new buyer initiative, with a new high at 42.972.
Since we don't see clear volume signals on the daily candles that would suggest where a buyer might reappear after a pullback, we’ll rely on the 1-hour timeframe and key daily levels instead.
Ideally, we’d want to see a correction down to the 41.8–41.4 zone. That’s where it would make sense to look for potential buy patterns.
Wishing you profitable trades!

Silver's Bullish Trend ExtendsThe chart shows Silver (XAG/USD, daily timeframe) continuing its bullish advance within a well-established ascending channel. Here’s the breakdown:
Trend & Structure:
Silver has maintained strong upward momentum since mid-June, trading comfortably above both the 50-day SMA (38.91) and the 200-day SMA (34.22). The rising channel highlights persistent demand and higher lows supporting the uptrend.
Support Levels:
The lower channel boundary around 39.00 is immediate dynamic support.
The 50-day SMA also aligns as secondary support.
A stronger floor rests at 35.00, a previous breakout zone and psychological level.
Resistance Levels:
The upper channel line near 43.50–44.00 is the next resistance to watch.
Sustained momentum above this range could accelerate toward 45.00, the next psychological barrier.
Momentum Indicators:
MACD is in positive territory, supporting bullish momentum.
RSI (73.8) has entered overbought territory, suggesting short-term consolidation or a pullback is possible before further upside.
Outlook:
Silver remains in a strong bullish trend, with price action guided by the rising channel. While the overbought RSI hints at a potential pause or minor pullback, the broader structure favors further gains toward the 43.50–45.00 area as long as price holds above 39.00.
-MW

SILVER BEARS WILL DOMINATE THE MARKET|SHORT
SILVER SIGNAL
Trade Direction: short
Entry Level: 4,275.6
Target Level: 4,185.4
Stop Loss: 4,335.0
RISK PROFILE
Risk level: medium
Suggested risk: 1%
Timeframe: 3h
Disclosure: I am part of Trade Nation's Influencer program and receive a monthly fee for using their TradingView charts in my analysis.
✅LIKE AND COMMENT MY IDEAS✅

Silver support at 4144The Silver remains in a bullish trend, with recent price action showing signs of a continuation breakout within the broader uptrend.
Support Zone: 4144 – a key level from previous consolidation. Price is currently testing or approaching this level.
A bullish rebound from 4144 would confirm ongoing upside momentum, with potential targets at:
4260 – initial resistance
4320 – psychological and structural level
4375 – extended resistance on the longer-term chart
Bearish Scenario:
A confirmed break and daily close below 4144 would weaken the bullish outlook and suggest deeper downside risk toward:
4065 – minor support
4020 – stronger support and potential demand zone
Outlook:
Bullish bias remains intact while the silver holds above 4144. A sustained break below this level could shift momentum to the downside in the short term.
This communication is for informational purposes only and should not be viewed as any form of recommendation as to a particular course of action or as investment advice. It is not intended as an offer or solicitation for the purchase or sale of any financial instrument or as an official confirmation of any transaction. Opinions, estimates and assumptions expressed herein are made as of the date of this communication and are subject to change without notice. This communication has been prepared based upon information, including market prices, data and other information, believed to be reliable; however, Trade Nation does not warrant its completeness or accuracy. All market prices and market data contained in or attached to this communication are indicative and subject to change without notice.

SILVER Will Fall! Sell!
Here is our detailed technical review for SILVER.
Time Frame: 3h
Current Trend: Bearish
Sentiment: Overbought (based on 7-period RSI)
Forecast: Bearish
The market is testing a major horizontal structure 4,221.1.
Taking into consideration the structure & trend analysis, I believe that the market will reach 4,164.2 level soon.
P.S
We determine oversold/overbought condition with RSI indicator.
When it drops below 30 - the market is considered to be oversold.
When it bounces above 70 - the market is considered to be overbought.
Like and subscribe and comment my ideas if you enjoy them!

Gold | Oil | Dollar | Silver | Natural Gas Price ForecastGold | Oil | Dollar | Silver | Natural Gas Price Forecast
NYMEX:NG1! AMEX:UNG AMEX:BOIL PEPPERSTONE:NATGAS

BRIEFING Week #37 : Beware of the FOMCHere's your weekly update ! Brought to you each weekend with years of track-record history..
Don't forget to hit the like/follow button if you feel like this post deserves it ;)
That's the best way to support me and help pushing this content to other users.
Kindly,
Phil

SILVER: Market of Sellers
Looking at the chart of SILVER right now we are seeing some interesting price action on the lower timeframes. Thus a local move down seems to be quite likely.
Disclosure: I am part of Trade Nation's Influencer program and receive a monthly fee for using their TradingView charts in my analysis.
❤️ Please, support our work with like & comment! ❤️

SILVER Will Keep Growing! Buy!
Hello,Traders!
SILVER is trading in an
Uptrend and the price
Has crossed yet another
Strong barrier of 41.60$
So we are bullish biased
And we will be expecting
A further bullish move up
On Monday!
Buy!
Comment and subscribe to help us grow!
Check out other forecasts below too!
Disclosure: I am part of Trade Nation's Influencer program and receive a monthly fee for using their TradingView charts in my analysis.

TRIPLE BOTTOM: COEUR MINING #CDEThe Triple Bottom Pattern is a bullish reversal chart formation defined by three separate troughs occurring at approximately the same price point, succeeding an extended downtrend.
This pattern indicates a possible shift from bearish to bullish sentiment, generally suggesting a robust support level from which the asset's price could increase.
How to Recognize the Triple Bottom Pattern on a Chart:
Prior Downtrend: Prior to the emergence of the triple bottom, there must be a clear downtrend in the asset’s price. This establishes the framework for the reversal pattern.
Three Troughs: Identify three separate price troughs or lows. These troughs should be approximately at the same price level, with slight variations.
Volume Consideration: Typically, volume decreases during the formation of the troughs and rises during the price increase between them. A notable increase in volume during the breakout (when the price surpasses resistance) enhances the pattern’s credibility.
Separation Between Troughs: Each trough ought to be spaced apart by a duration of time with a moderate price increase in between. This price increase often halts at a similar resistance level, creating the apex of the pattern.
Breakout: The validation of the pattern occurs with a breakout above the resistance level established at the peaks between the troughs. The breakout indicates a potential reversal of the preceding downtrend.
Powerful Reversal Indicator: The Triple Bottom Pattern is highly regarded by traders as it signifies a robust shift in market sentiment. Following a prolonged downtrend, the formation of three successive troughs at approximately the same price point demonstrates a significant support level.
This support area is where buyers regularly step into the market or where the selling pressure begins to diminish. The mere occurrence of the price testing this level three times without breaking through indicates a decline in bearish momentum.
Duration: The pattern may develop over a span of several weeks to several months. Extended formations typically yield more substantial reversals.
Predictive Power: Once the Triple Bottom is validated—usually through a breakout above the resistance level—it can give traders a target price, presenting a quantifiable method for potential profit. By calculating the distance from the resistance level (established at the peaks between troughs) to the bottom of the pattern, and subsequently projecting that same distance upwards after the breakout, traders can establish price targets and modify their trading strategy as needed.

SILVER Massive Short! SELL!
My dear followers,
This is my opinion on the SILVER next move:
The asset is approaching an important pivot point 42.176
Bias - Bearish
Technical Indicators: Supper Trend generates a clear short signal while Pivot Point HL is currently determining the overall Bearish trend of the market.
Goal - 41.646
About Used Indicators:
For more efficient signals, super-trend is used in combination with other indicators like Pivot Points.
Disclosure: I am part of Trade Nation's Influencer program and receive a monthly fee for using their TradingView charts in my analysis.
———————————
WISH YOU ALL LUCK

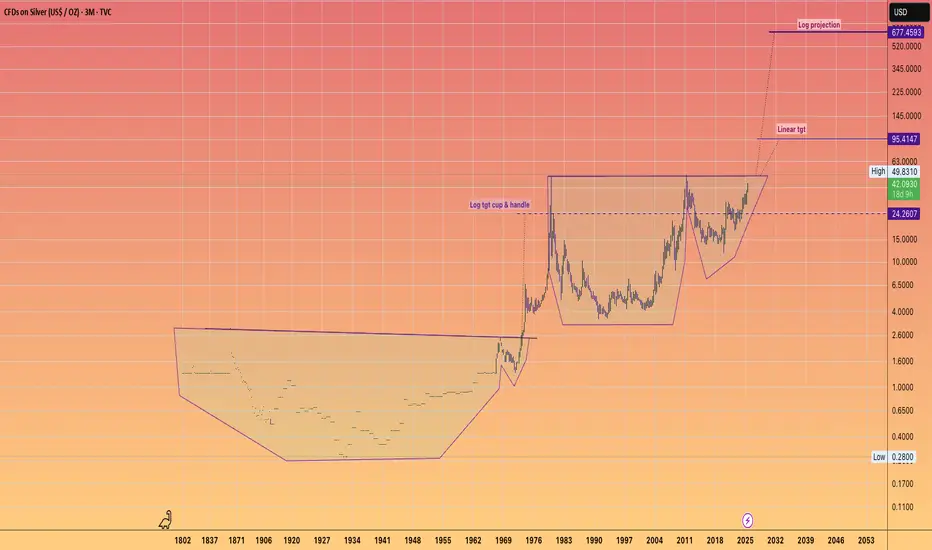
SILVER Accelerating to $95This is the full history of Silver.
With it's two GIANT Cup & Handle Patterns.
Big Patterns = Big Moves !!!
I find myself uncertain about the kind of world we would inhabit if Silver were to achieve the LOG projections in a chaotic disorderly manner.
We are undoubtedly stepping into a period of significant transformation across various sectors for global society in the coming decade or two.
Finance. Governance, Technology—let's seize the moment and take full advantage of the incredible opportunities available to us.
Gold (XAUUSD) – Technical Outlook
🟢 Bullish Scenario:
Key Level (Pivot): 3630
If price holds above 3630, bullish momentum may extend towards:
🎯 First target: 3656 (resistance)
🎯 If 3656 breaks strongly → continuation towards:
🎯 Second target: 3675
🎯 Third target: 3697
🔴 Bearish Scenario:
If price fails and sustains below 3630, bearish move may develop towards:
🎯 First support: 3595 (a strong support zone)
🎯 If 3595 breaks decisively → continuation towards:
🎯 Second target: 3546
📌 Summary:
3630 = decision zone
3656, 3675, 3697 = upside targets
3595, 3546 = downside targets

Silver/USD:Poised for a Breakout After 50 Years of ConsolidationIn my latest analysis of the Silver/USD chart, I've identified a significant resistance level at $48 USD. This level has been a formidable barrier for decades, but a breakout could signal a major shift. If Silver/USD manages to break through this resistance, we could see a target of $580 USD, representing a substantial upside potential.
Historically, after breaking out, assets often retest previous highs, so a retest of the $48 level might occur before a sustained move higher. This setup comes after an unprecedented 50-year consolidation period, suggesting that Silver/USD is gearing up for a long-term trend. This trade could unfold over the next five years, offering a compelling opportunity for long-term investors.
