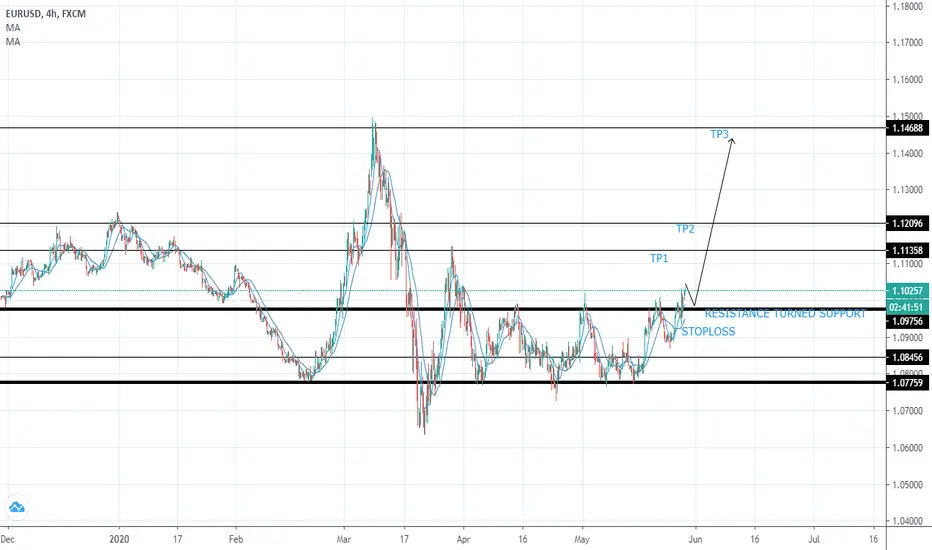
LET'S WAIT AND SEEAs we can see, price broke out of the ranging channel, let's see if it makes a retest at that level which will play out to become resistance turned support, then we enter the trade with appropriate candlestick confirmation. keep it simple.
Simplertrading

AUDCAD IF this Then that Hey guys, if you can't tell already, i make trading simple. IF this Then that. Here Audcad broke a right shoulder with this strong bullish impulse move IF the market decides to come back down and retest i will take the buy- but where is it going? If you look ABOVE your head there is of course another H&S pattern that has not given us the Right shoulder yet, which is where i would sell, however if AC wants to continue to be bullish and break structure we'll just take the Buy. 50 pip zone... are you okay with catching potentially 50 pips up and 50 pips down. :)
-PGP

EURUSD LongSome nice clean and simple analysis. We can see that the price has closed above previous resistance levels, came back down to retest that area and formed a nice little triangle at the same time and is now at the end of the triangle. Should we see a break above the triangle we can expect this pair to keep moving to the upside. My targets for this pair will be around the previous resistance areas.

USDCHF LongPretty simple idea. I'm looking to go long on USDCHF, the price is moving in an uptrend and where the next touch of the line is looking to be is also a pretty solid support zone and also the 38.2% level on the Fib and will most likely be at the 20 level on the RSI or even lower. This is looking to be a great opportunity to buy.

CADJPY4 individual strategies combined into one, simple to use. when a buy is valid the candle will turn GREEN with a {BUY} label. when a sell is valid the candle will turn RED with a {SELL} label. this works on ALL timeframes and pairs!
Loads of pips caugth here on CADJPY


USD/JPY SHORT - 20. FEB. 2020Price made a strong impulse to the upside and almost hit previous weekly resistance (the white line). Make sure you check the bigger time frames and wait for the daily candle to close before entering this trade. Use proper risk management!

NZD/CHF - Buy Once Again - Feb 20.Price has approached the weekly support {the white line}. We can also see clear divergence on 4H with Stochastics oversold. It's better to wait for the price to touch the white line but I am going long right now with a small lot. Good luck!


USD/JPY - LONG - 1. FEB. 2020Price has reached the weekly trend line and it is located in the zone where a lot of support/resistance has happened.
"Comment", "Like" and "Follow" are appreciated!
Have a great week everyone!


GBPJPY A BUY MAYBEDue to the market being very bullish it is a higher probability that the market will go long. The Bears might push down to the support line and then the market may pick up and go long.
I am new to trading so any feedback will be great :)

BRENT CRUDE HEAD N SHOULDERS STRATEGY
Created a Inverse Head n Shoulder
Upward RSI divergence
Crossed 100 MA
Target 10-11% of breakout
Please let me know if any corrections or recommendations


LINK - Buy opportunity Trade criteria:
- Significant bearish divergence
- Retest of support in uptrend
- Trend line converges with horizontal support
- Correction after major pump
What do you guys think of this trade? Let me know your thoughts in the comments!

Will bitcoin break the resistance? Support and resistancesBitcoin testing "Resistance #1", if it breaks my next target is around 11690 USD
The upwards trending resistance line which goes through "Resistance #1" is important too, if it breaks I think we will see a parabolic movement to the "Resistance #2"
If Bitcoin fails at "Resistance #1" i'm looking for retracement back to 7900-8450 USD support zone
I think that upwards trendline on the RSI is so important, last time when it's broken to the down side Bitcoin dumped too.

Bullish triangle pattern on BitcoinThis is a plain and simple pattern. No need to complicate this. If BTC breaks the upside with quotes over ~8300 USD the bullish trend will continue (more likely). At least until ~9000-9400 USD
If the unlikely scenario happens that BTC breaks to the downside (like ~7200 USD and lower) we'll see further falling prices.

USD/JPY Long PositionFX:USDJPY
Entry Level: 109.850
TP: 11.850
SL: 108.42
Ratio: 2:1
Based on the daily chart, the price has closed at a key support level which it hit in mid september 2018. Note that after that it hit that resistance level, it went on a major bull run, which saw the price go from a low of 109.900 (current), to hit highs of 114.00 !! In addition, the current candle is a long wick, signalling a potential reverse as buyers are coming in. US-China trade talks are close to reaching an agreement, which should see the dollar rise back to its average moving price ranges.

USDJPY SELLthe price comes in bearish trend and brings line of trend with 3 touches broke its previous support and it is testing quite this pulling several wicks the price is losing strength and would be the level being 61.8%

NZDUSD BUYThe price has just broken a strong bearish trend line and this bullish formation broke its previous resistance and is trying to set it up as a floor, since its new floor is also at a fibo level

AUDJPY SELL (RISK TRADE)risk trade the price is in formation of trilpe ceiling and possibly a third fall as it has already done 2 times past!

CADJPY SELLThe price broke the trend line and is in the formation of a bearish trend line, plus it broke and tested its previous support as a roof and the roof level is 78.6% of the fibo of good option to sell
