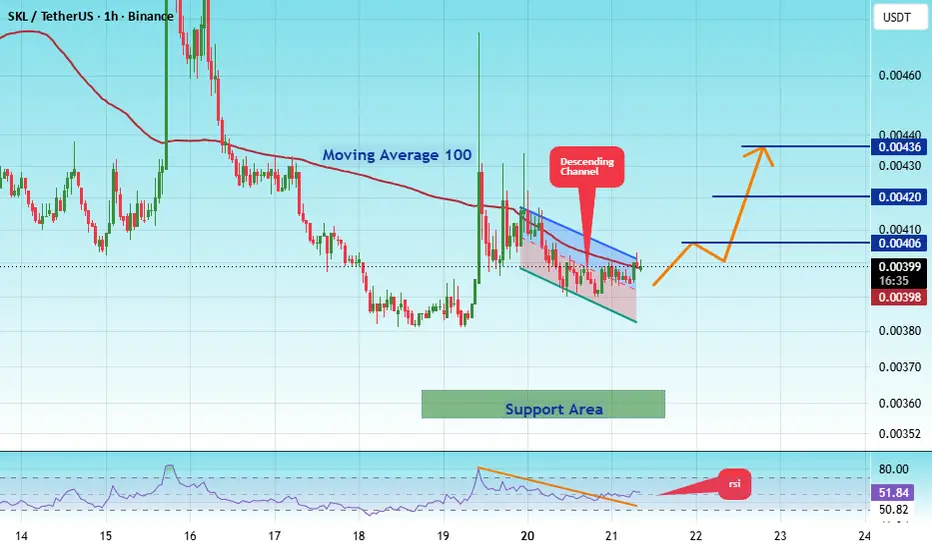
#SKLUSDT Final Liquidity Zone Before Expansion ?#SKL
The price is moving within a descending channel on the 1-hour timeframe; it has reached the lower boundary and appears poised for a rebound, suggesting a potential upward move upon retesting this level.
The Relative Strength Index (RSI) indicates a bearish trend, but an upward breakout is likely due to oversold conditions on the 1-hour chart.
An orange trend line supports the potential upward rebound.
There is initial support at 0.00380, acting as a primary support zone.
A key support
SKLUSDT
SKL/USDT: Long Setup — Base Rebound Target +110%SKALE ( LSE:SKL ) is forming a solid accumulation base around the **$0.0038 – $0.0040** demand zone following a prolonged consolidation phase. Early volume expansion and momentum indicators turning upward signal a potential shift toward buyers, opening up a high-reward breakout leg toward major macro resistance levels.
A confirmed high-volume break over $0.0042 activates buyer momentum for a strong trend continuation into upper overhead supply pools.
*(Educational analysis only. Always manage
#SKLUSDT Final Liquidity Zone Before Expansion ?#SKL
The price is moving within a descending channel on the 1-hour timeframe and has reached the lower boundary. It is now poised for a bounce and is expected to retest this boundary.
The Relative Strength Index (RSI) indicates a downward trend, which is likely to continue given the overbought conditions.
There is a key support zone in green at 0.00358, and the price has bounced off this zone several times, making it a strong support level.
The price is trending towards the 100-period moving
#SKLUSDT Final Liquidity Zone Before Expansion ?#SKL
The price is moving within a descending channel on the 1-hour timeframe and has reached the lower boundary. It is now poised for a bounce and is expected to retest this boundary.
The Relative Strength Index (RSI) indicates a downward trend, which is likely to continue given the overbought conditions.
There is a key support zone in green at 0.00356. The price has bounced off this zone several times, making it a strong support level.
The price is trending towards the 100-period moving ave
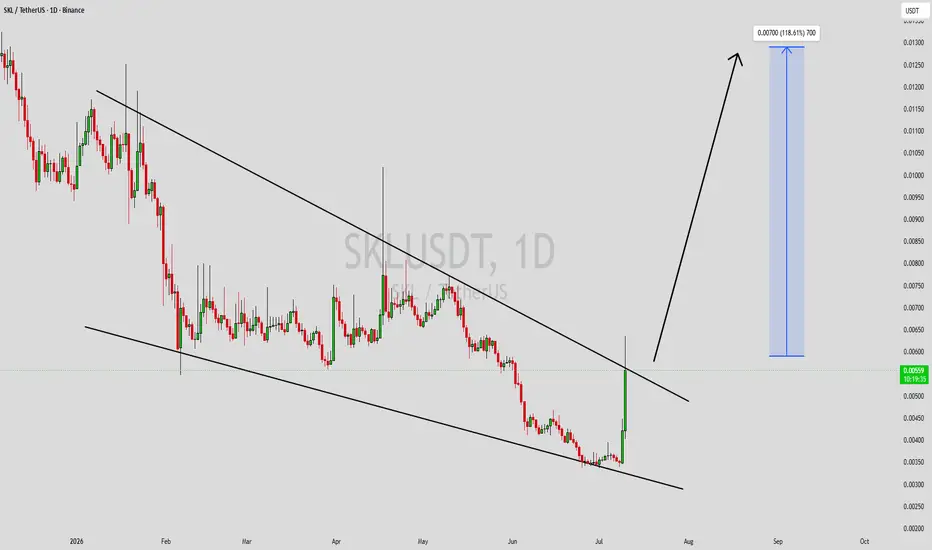
SKLUSDT Forming Falling WedgeSKLUSDT is forming a clear falling wedge pattern, a classic bullish wave signal that often indicates an upcoming breakout. The price has been consolidating within a narrowing range, suggesting that selling pressure is weakening while buyers are beginning to regain control. With consistent volume confirming accumulation at lower levels, the setup hints at a potential bullish breakout soon. The projected move could lead to an impressive gain of around 90% to 100% once the price breaks above the we
#SKLUSDT Final Liquidity Zone Before Expansion ?#SKL
The price is moving within a descending channel on the 1-hour timeframe and has reached the lower boundary. It is now poised for a bounce and is expected to retest this boundary.
The Relative Strength Index (RSI) indicates a downward trend, which is likely to continue given the overbought conditions.
There is a key support zone (in green) at 0.00550. The price has bounced off this zone several times, making it a strong support level.
The price is trending towards the 100-period moving a
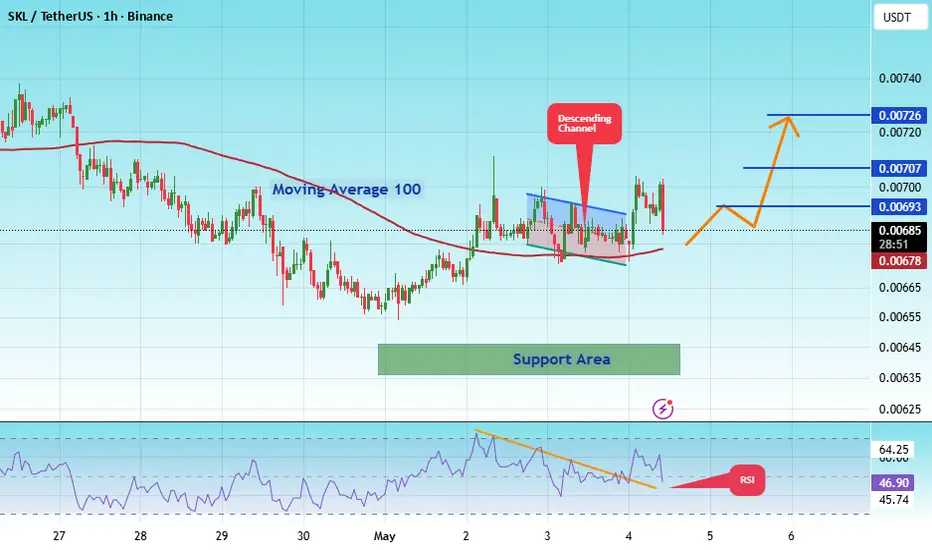
#SKLUSDT - shorters will get rekt!#SKL
The price is moving within a descending channel on the 1-hour timeframe and has reached the lower boundary. It is now poised for a bounce and is expected to retest this boundary.
The Relative Strength Index (RSI) indicates a downward trend, which is likely to continue given the overbought conditions.
There is a key support zone (in green) at 0.00635. The price has bounced off this zone several times, making it a strong support level.
The price is trending towards the 100-period moving a
SKLUSDT Forming Bullish MomentumSKLUSDT is forming a clear bullish momentum pattern, a classic bullish reversal signal that often indicates an upcoming breakout. The price has been consolidating within a narrowing range, suggesting that selling pressure is weakening while buyers are beginning to regain control. With consistent volume confirming accumulation at lower levels, the setup hints at a potential bullish breakout soon. The projected move could lead to an impressive gain of around 90% to 100% once the price breaks above
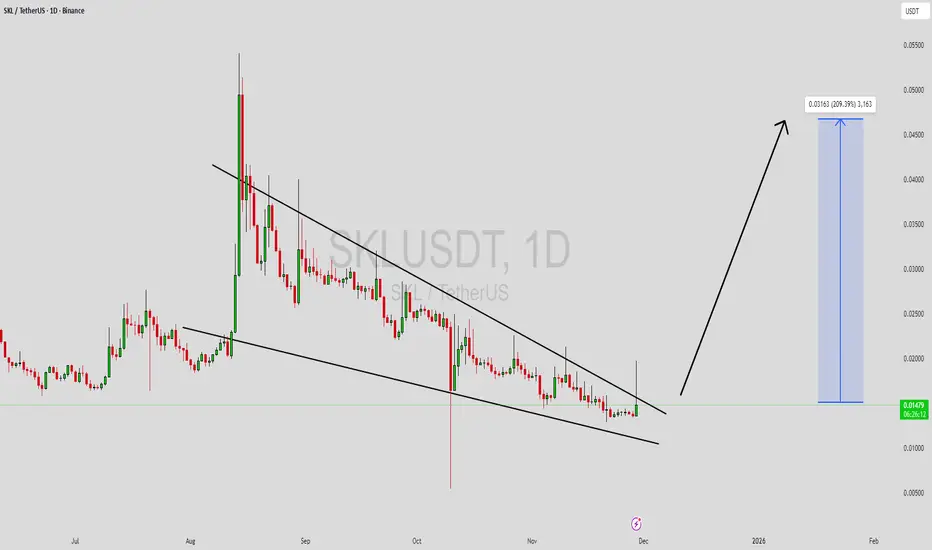
SKLUSDT Forming Falling WedgeSKLUSDT is forming a basic falling wedge reversal signal that often indicates an upcoming breakout. The price has been consolidating within a narrowing range, suggesting that selling pressure is weakening while buyers are beginning to regain control. With consistent volume confirming accumulation at lower levels, the setup hints at a potential bullish breakout soon. The projected move could lead to an impressive gain of around 190% to 200% once the price breaks above the wedge resistance.
This
SKLUSDT Forming Falling WedgeSKLUSDT is forming a falling wedge patter, a classic bullish reversal setup that signals potential trend change after a sustained downtrend. The pattern is tightening, showing that selling pressure is weakening while buyers are gradually stepping in. The good trading volume further supports the likelihood of a strong breakout ahead. Based on current technical structure and investor sentiment, SKLUSDT holds an expected gain potential of 90% to 100%+, making it an attractive opportunity for trader
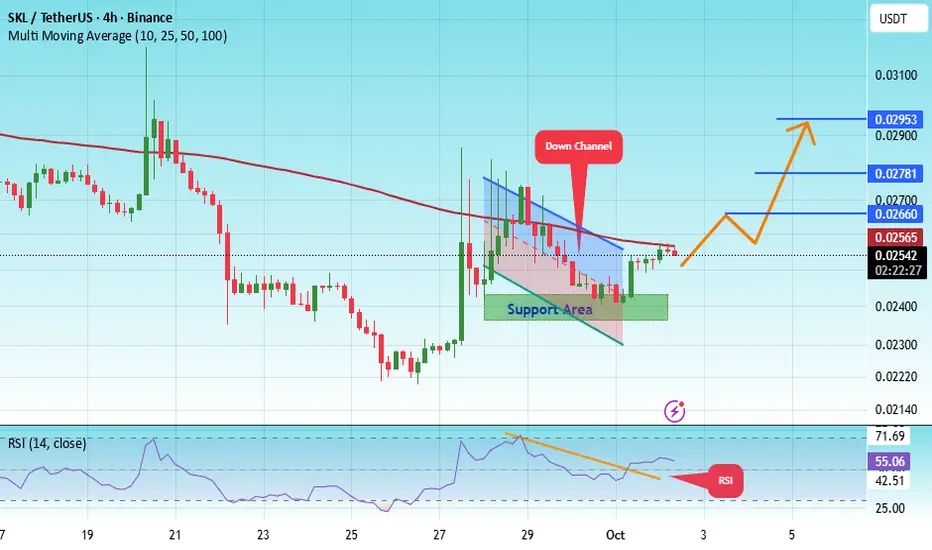
#SKL/USDT - shorters will get rekt!#SKL
The price is moving within a descending channel on the 1-hour frame, adhering well to it, and is heading for a strong breakout and retest.
We have a bearish trend on the RSI indicator that is about to be broken and retested, which supports the upward move.
There is a major support area in green at 0.02412, representing a strong support point.
We are heading for consolidation above the 100 moving average.
Entry price: 0.02545
First target: 0.02660
Second target: 0.02781
Third target: 0.
#SKL/USDT#SKL
The price is moving within a descending channel on the 1-hour frame, adhering well to it, and is heading for a strong breakout and retest.
We have a bearish trend on the RSI indicator that is about to be broken and retested, which supports the upward breakout.
There is a major support area in green at 0.02800, representing a strong support point.
For inquiries, please leave a comment.
We are in a consolidation trend above the 100 Moving Average.
Entry price: 0.02970
First target: 0.03
SKLUSDT Forming Bullish WaveSKLUSDT is showing signs of forming a strong bullish wave pattern, which could be a major signal for an upcoming explosive move. The structure indicates that price action is gradually building momentum and preparing for a breakout. With solid trading volume supporting this setup, SKLUSDT has the potential to deliver massive upside gains in the near term, with expectations ranging from 190% to 200%+.
This bullish wave pattern suggests accumulation and growing investor confidence. Historically, s
SKL/USDT — Consolidation at a Critical Demand Zone, Big Move?Currently, SKL/USDT is trading around 0.0296 USDT, sitting right inside the historical demand zone (0.026 – 0.030) that has acted multiple times as a strong pivot. This area is a decision point: whether the bulls defend it or the bears break it will define the next major trend.
---
🔎 Structure & Price Pattern
1. Key Demand Zone (yellow box)
Price is consolidating after a sharp rejection from the August spike. This zone reflects accumulation, where buyers are absorbing supply to prevent a dee
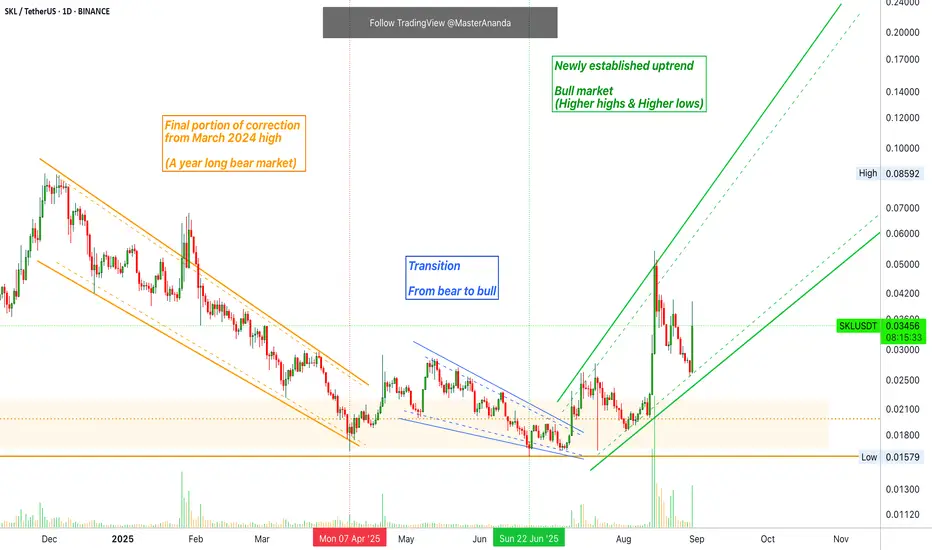
A Newly Established Uptrend Means Higher Highs · Skale NetworkThis is another perfect example of a trading pair "not dropping with Bitcoin." This is the theme today as I am trying to share some strength for those who need most, those who need to wait.
This market proof will show you, without a shadow of doubt, that the Cryptocurrency market is actually rising and will continue to do so. Which means that the best option is to hold or buy, not to sell because prices are going up and are doing so strong.
Bitcoin peaked 14-Aug and has been dropping until th
SKL Market Update📊 LSE:SKL Market Update
LSE:SKL has formed a key red resistance zone 🔴 where sellers are still active.
If buyers manage a confirmed breakout, it could signal the continuation of the bullish trend ✅
👉 The first target on breakout is the green line level 🎯
👉 Breaking this zone would show strong buyer momentum and open the door for further upside.
⚠️ Reminder: Always wait for confirmation — resistance zones often bring heavy selling pressure before a clear move.
Multiple altcoins · The 2025 bull market is onBIOUSDT:
Here we have three weeks closing green and the highest volume ever as Bitcoin retraces. No altcoin can grow this strongly if Bitcoin is now in a bear market. No altcoin would start a bullish wave if Bitcoin is entering correction mode. The only time the altcoins grow is when Bitcoin is rising or sideways within a bull market, at other times the altcoins drop. Seeing bullish altcoins confirms a bullish Bitcoin.
BTCUSDT:
Bitcoin has been red seven days, since 14-August. Is this the
SKLUSDT – Possible Reversal in PlaySKL shows a change of character (ChoCH) after long consolidation and now trying to push upward. Price already retested the zone, giving a chance for continuation if momentum holds.
Entry: 0.0310 - 0.0307
Stoploss: 0.0297
Targets:
0.0326
0.0339
0.0360
Let’s see if SKL can maintain strength and push into higher targets.
SKL/USDT Analysis — Key Decision Zones
This coin has been among the top gainers over the last three days.
Currently, it is in a correction phase and is approaching the local buy zone at $0.0414–$0.039. Given the weak price action, it is likely that we’ll see a reaction from this zone.
Above the current price, there is also a very important zone at $0.047–$0.0515, with significant volume-based profit-taking already positioned for short bias. Upon a test of this zone and a confirmed reaction, a short position could be considered.
SKLUSDT Forming Bullish PennantSKLUSDT is currently trading within a bullish pennant pattern, a technical structure that often signals a potential bullish reversal once price breaks above the channel resistance. The steady trading volume indicates active participation from both buyers and sellers, but with the pattern narrowing, the balance is slowly tipping in favor of the bulls. Based on the current chart structure, a confirmed breakout could pave the way for a 40% to 50%+ upside move in the near term.
The price action sho
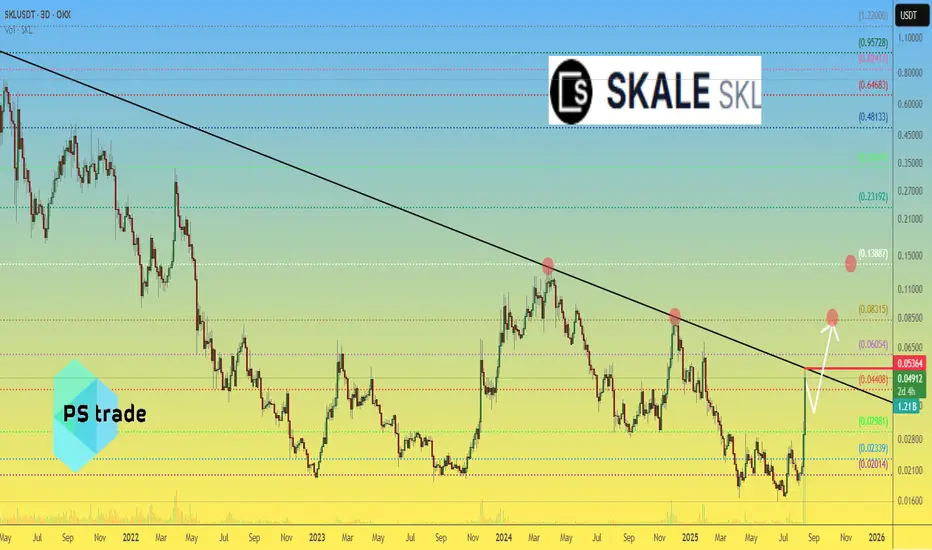
Skale SKL price analysis📉 Today, CRYPTOCAP:BTC launched a “red attack” — the daily candle erased the last 3 in a row!
Altcoins are holding surprisingly strong, and #SKL’s price is literally “glued” to the trendline, refusing to give up 😏
No wonder: a trendline break happens either now — with momentum & volume — or the price surrenders to a corrective trend.
📊 OKX:SKLUSDT Plan:
1️⃣ Break and close above $0.054 → only then consider entering a long.
2️⃣ Pullback to ~$0.035 → accumulate positions and aim upward to $0.
Skyrocketing $SKL 4H Trading Setup with RSI WarningBINANCE:SKLUSDT
Skyrocketing LSE:SKL 4H Trading Setup with RSI Warning
Trading Levels:
Entry: 1.00 (0.05060 USDT) - The level where the initial purchase is planned.
DCA (Dollar-Cost Averaging): 1.135 (0.05474 USDT) - An additional buying point if the price rises.
SL (Stop Loss): 1.272 (0.05894 USDT) - The level where the loss would be limited.
TP (Take Profit):
TP1: 0.786 (0.04040 USDT)
TP2: 0.618 (0.03577 USDT)
TP3: 0.5 (0.03277 USDT)
TP4: 0.0194 (0.0194 USDT) - A significantly lower tar
SKLUSDT Forming Descending ChannelSKLUSDT is currently trading within a descending channel pattern, a technical structure that often signals a potential bullish reversal once price breaks above the channel resistance. The steady trading volume indicates active participation from both buyers and sellers, but with the pattern narrowing, the balance is slowly tipping in favor of the bulls. Based on the current chart structure, a confirmed breakout could pave the way for a 40% to 50%+ upside move in the near term.
The price action