CADJPY FREE SIGNAL|SHORT|
✅CADJPY has tapped into a premium supply zone after sweeping liquidity above previous highs. Smart money shows distribution signs with bearish displacement underway — targeting inefficiency below.
—————————
Entry: 109.230
Stop Loss: 109.610
Take Profit: 108.600
Time Frame: 2H
—————————
SHORT🔥
✅Like and subscribe to never miss a new idea!✅
Smartmoneyconcept

EUR-JPY Free Signal! Sell!
Hello,Traders!
EURJPY SMC based signal. Price has reacted sharply from a premium supply zone, forming a bearish displacement and potential CHoCH on lower timeframes. Expecting a move into discount levels as liquidity below the recent equal lows gets targeted.
-------------------
Stop Loss: 177.959
Take Profit: 177.510
Entry: 177.744
Time Frame: 3H
-------------------
Sell!
Comment and subscribe to help us grow!
Check out other forecasts below too!
Disclosure: I am part of Trade Nation's Influencer program and receive a monthly fee for using their TradingView charts in my analysis.

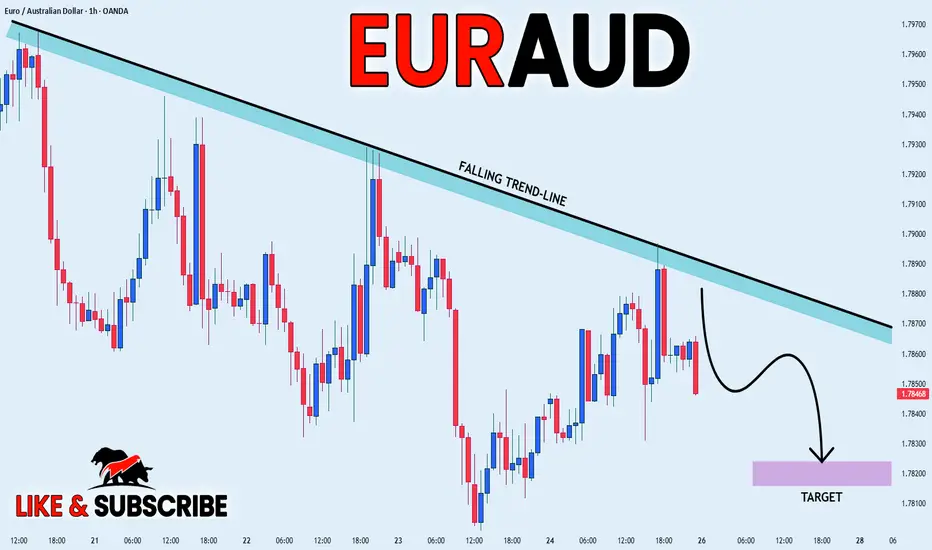
EURAUD WILL GO DOWN|SHORT|
✅EURAUD is respecting the falling trendline, showing rejection from premium levels. Liquidity has been collected above the recent swing, suggesting smart money may aim for the downside to rebalance inefficiency toward the target zone. Time Frame 2H.
SHORT🔥
✅Like and subscribe to never miss a new idea!✅
EUR-CHF Free Signal! Sell!
Hello,Traders!
EURCHF SMC based signal. Price tapped into a key supply zone, showing clear rejection with wicks and momentum shift to the downside. Expecting a short-term retracement toward the target zone below.
-------------------
Stop Loss: 0.9259
Take Profit: 0.9243
Entry: 0.9252
Time Frame: 3H
-------------------
Sell!
Comment and subscribe to help us grow!
Check out other forecasts below too!
Disclosure: I am part of Trade Nation's Influencer program and receive a monthly fee for using their TradingView charts in my analysis.

EURGBP LOCAL SHORT|
✅EURGBP has reached the supply level and is showing signs of rejection from premium pricing. Smart money may look to engineer a retracement toward discounted levels as liquidity above recent highs has been swept. Targeting the lower inefficiency zone for a potential re-balance. Time Frame 2H.
SHORT🔥
✅Like and subscribe to never miss a new idea!✅

EUR-USD Bullish Bias! Buy!
Hello,Traders!
EURUSD SMC based forecast shows price reacting from the horizontal demand area with strong bullish momentum. Liquidity beneath previous lows has been swept, indicating potential continuation to the upside toward the target level. Time Frame 5H.
Buy!
Comment and subscribe to help us grow!
Check out other forecasts below too!
Disclosure: I am part of Trade Nation's Influencer program and receive a monthly fee for using their TradingView charts in my analysis.

NAS100 1H: Bulls vs Bears at the Line📊 NAS100 – 1 Hour Analysis
Hello friends,
Here’s my NAS100 analysis for you.
Looking at the 1-hour chart, I want to highlight a critical level.
👉 If NAS100 breaks above 25,038 and closes a candle there, the next move could point higher.
👉 If NAS100 fails to break 25,038, then a pullback toward 24,267 may come into play.
🙏 Every like is my biggest motivation to keep sharing these analyses.
Thanks to everyone supporting me!

US100 STRONG BREKAOUT|LONG|
✅US100 Price has successfully broken through the key resistance and all-time-high level, confirming bullish intent. As long as the breakout holds above structure, we anticipate continuation toward the next premium zone and liquidity resting at higher highs. Time Frame 3H.
LONG🚀
✅Like and subscribe to never miss a new idea!✅

SILVER Local Long! Buy!
Hello,Traders!
SILVER SMC based analysis shows price reacting from the horizontal demand area where liquidity has been swept and bullish order flow may soon resume. Expecting a possible push upward toward the next target level once internal structure confirms a shift. Time Frame 5H.
Buy!
Comment and subscribe to help us grow!
Check out other forecasts below too!
Disclosure: I am part of Trade Nation's Influencer program and receive a monthly fee for using their TradingView charts in my analysis.

EURJPY FREE SIGNAL|SHORT|
✅EURJPY has reached a premium zone near a clear supply level, where smart money could be offloading long positions. Expecting a potential reversal setup as liquidity is engineered above previous highs.
—————————
Entry: 177.57
Stop Loss: 177.80
Take Profit: 177.10
Time Frame: 2H
—————————
SHORT🔥
✅Like and subscribe to never miss a new idea!✅

USD-JPY Free Signal! Sell!
Hello,Traders!
USDJPY SMC based setup forming as price taps into the horizontal supply area, showing rejection and loss of bullish momentum. Smart money may now shift order flow to the downside, aiming for liquidity resting below recent lows.
-------------------
Stop Loss: 153.295
Take Profit: 152.612
Entry: 153.024
Time Frame: 3H
-------------------
Sell!
Comment and subscribe to help us grow!
Check out other forecasts below too!
Disclosure: I am part of Trade Nation's Influencer program and receive a monthly fee for using their TradingView charts in my analysis.

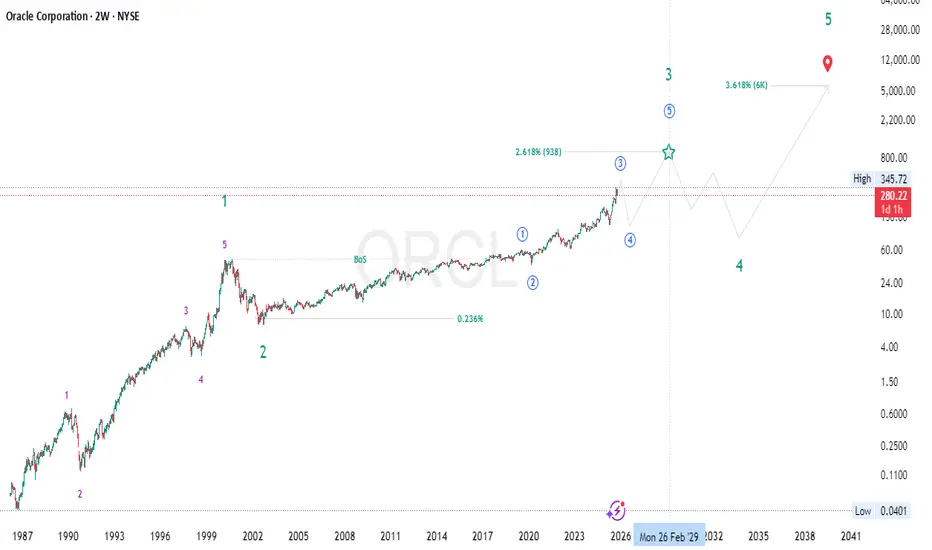
ORACALE (ORCL) Rally! Cycle 3 → $400, Eyes on Supercycle $6,000🌀 ORACLE (ORCL) – Elliott Wave Supercycle Analysis | Smart Money & Fibonacci Confluence
🔭 Macro Perspective
Oracle’s long-term chart (NYSE: ORCL) showcases a powerful Supercycle (III) wave in motion — a multi-decade expansion phase fueled by institutional participation, structural growth, and technological innovation.
The internal Cycle waves (1–5) are clearly defined, with current price action positioned deep within Cycle Wave (3) — the strongest segment of this major bullish leg.
🟢 Supercycle Wave (I) (1987 – 2000)
Elliott Behavior: The first grand impulsive advance, representing Oracle’s rise during the early software and database revolution.
Fibonacci Structure: Wave (3) extended toward the 2.618× of Wave (1), typical of an early institutional growth wave.
SMC Dynamics:
Breaks of structure (BoS) at each impulsive stage.
Liquidity sweeps before rallies — consistent smart money accumulation patterns.
Fundamentals: Explosive earnings growth through enterprise software adoption and global market expansion.
💥 Conclusion: The dot-com peak in 2000 completed Supercycle (I).
🔵 Supercycle Wave (II) (2000 – 2002)
Nature: The sharp, emotion-driven retracement following the tech bubble.
Fibonacci Retracement: Retraced into the 0.236 zone of (I), providing the long-term discount region for accumulation.
SMC Characteristics:
Liquidity grab beneath 1998–1999 structure.
Long accumulation base confirming institutional re-entry.
Fundamentals: Oracle streamlined operations and built the groundwork for enterprise-level solutions.
🧱 Bottom: Wave (II) ended around 2002 — the base of today’s decades-long uptrend.
🟣 Supercycle Wave (III) (2002 – 2030s, ongoing)
This ongoing macro impulsive wave contains five internal Cycle Waves (1–5) .
⚪ Cycle Wave (1) (2002 – 2019)
Elliott Context: A powerful, sustained impulsive leg lasting nearly two decades.
Structure: Clean five-wave advance with strong extensions during 2010–2019.
Fibonacci Note: The move achieved near the 1.618× extension relative to its starting point.
SMC Insight:
Consistent higher highs and higher lows throughout the period.
BoS continuation patterns confirming institutional markup.
Fundamentals: Expansion of Oracle’s business model — cloud transition, data analytics, and enterprise software dominance.
📈 End: Cycle (1) peaked near 2019 , completing the first internal impulsive leg of Supercycle (III).
🔵 Cycle Wave (2) (2019 – 2020)
Nature: A sharp yet shallow correction that coincided with the global market decline (COVID crash).
Fibonacci Retracement: Retraced around the 0.236–0.382 zone of Wave (1).
SMC Dynamics:
Liquidity sweep under 2018–2019 structure.
Fast accumulation pattern — strong re-accumulation footprint.
Fundamentals: Short-term market shock, but Oracle’s fundamentals remained intact and rebounded swiftly.
🧭 Conclusion: Cycle (2) ended in 2020, setting the foundation for the explosive ongoing Cycle (3) rally.
🟢 Cycle Wave (3) (2020 – ~2026, in progress)
Elliott Context: The most powerful internal impulsive wave — currently unfolding.
Target Zone: Projected to complete near $380–$400 , expected around late 2025 to early 2026 .
Fibonacci Extension: The 2.618× extension of Wave (1) perfectly aligns near $400.
SMC & Market Structure:
Continuous BoS and HH–HL formations — clear institutional control.
No macro distribution yet; structure remains intact.
Liquidity inducements near highs suggest ongoing markup phase.
Price Action: Aggressive impulses, shallow retracements, and orderly continuation patterns.
Fundamentals:
Rapid expansion in Cloud Infrastructure (OCI), AI-driven services, and recurring revenue models.
Sustained EPS growth and improved margin performance support wave maturity.
🚀 Expectation: Completion near $400 will likely trigger a Cycle (4) corrective structure before the final impulsive push.
🟠 Cycle Wave (4) (Projected: 2026 – 2028)
Elliott Behavior: A corrective phase — retracing part of the strong Cycle (3) run.
Fibonacci Retracement: Expected correction into the 0.236–0.382 zone of Wave (3), roughly $200–$280.
SMC Insight:
Break of structure (BoS) near top zones to induce liquidity.
Re-accumulation base forming after liquidity sweep below key supports.
Market Psychology: Cooling from euphoria, consolidation, and rebalancing of valuations.
Fundamentals: Period of stabilization after several years of aggressive expansion.
📉 Outlook: Likely forms the structural foundation for the next rally phase (Cycle 5).
🟢 Cycle Wave (5) (Projected: 2028 – early 2030s)
Elliott Context: The final impulsive leg completing Supercycle (III).
Target Zone: Fibonacci 3.618× extension (~$900–$950) of Cycle (1).
SMC Structure:
Final markup phase with strong BoS continuation patterns.
Climax rallies as retail sentiment peaks.
Price Action: Parabolic trend, thin retracements, and expanding volatility.
Fundamentals: Oracle could cement its dominance in global data, AI, and enterprise infrastructure markets.
💎 Completion: Cycle (5) will mark the end of Supercycle (III), leading into the long-term corrective Supercycle (IV).
🔶 Supercycle Wave (IV) (Projected: 2030s – 2040s)
Nature: Major macro correction after decades of expansion.
Fibonacci Depth: Likely retraces into the 0.382–0.5 zone of (III).
SMC Behavior: Distribution → liquidity sweep → re-accumulation.
Market Context: Could align with macroeconomic tightening or sectoral rotation.
📊 Purpose: To reset valuations and build energy for the final Supercycle (V).
🟩 Supercycle Wave (V) (Projected: 2040s – 2050s)
Elliott Context: The final impulsive wave of Oracle’s century-long trend.
Fibonacci Target: 3.618× expansion (~$6,000).
SMC Behavior: Final institutional markup followed by distribution and secular reversal.
Fundamentals: Could coincide with Oracle’s role as a global AI–data infrastructure leader.
🚀 Legacy Wave: The culmination of decades of innovation and expansion.
⚙️ Macro Summary
Accumulation (1980s–1990s) – Smart money foundation.
Expansion (2000s–2020s) – Institutional markup phase.
Distribution (2030s) – Macro correction and rotation.
Re-accumulation (Post-2040s) – Long-term reset for future cycles.
🧠 Technical & Fundamental Alignment
✨ Elliott Structure: Clear impulsive (I–V) sequence with macro rhythm.
✨ Fibonacci Confluence: $400 (2.618× of Wave 1) & $900 (3.618× of Wave 1).
✨ SMC: Institutional control with clean BoS → reaccumulation → continuation.
✨ Price Action: Aggressive bullish order flow with no macro distribution yet.
✨ Fundamentals: Oracle’s AI + Cloud strategy drives sustainable growth.
🌍 Conclusion
Oracle (ORCL) continues to trend within Supercycle (III) — the most powerful long-term wave.
Cycle Wave (3): In progress, targeting $380–$400 by end of 2025 / early 2026.
Cycle Wave (4): Anticipated retracement toward $200–$280 zone.
Cycle Wave (5): Final impulsive run toward $900+ into the early 2030s.
📈 Macro Bias: Long-term bullish — institutional structure intact.
📊 Short-term Outlook: Momentum strong but nearing Cycle 3 completion; prepare for corrective rotation.
💬 Summary: Oracle’s price evolution beautifully mirrors its technological growth story — a near-perfect alignment of Elliott Wave symmetry , Smart Money structure , and fundamental strength . The completion of Cycle 3 near $400 will open the door to an ideal re-entry opportunity for the next macro leg higher.
#ORCL 📈 #Oracle 💼 #ElliottWave 🌊 #WaveAnalysis 🔹 #Supercycle 🚀 #Fibonacci 📊 #SmartMoney 💎 #PriceAction 🕯️ #MarketStructure 🏗️ #LongTermBull 🟢 #StockAnalysis 💹 #TechnicalAnalysis ⚙️ #Investing 💰 #TradingViewIdeas 💡
💬 Respected traders and analysts!
Your insights matter. Share your views, confirmations, or constructive criticism in the comments below. Let’s discuss ORCL’s structural evolution, Elliott Wave setup, and long-term Supercycle potential 🚀📈.
— Team FIBCOS 💎
SMART MONEY CONCEPT📊 Bearish Analysis (EUR/USD – 15M)
The market created a fake out at the 15M Order Block (1.1614 – 1.1620), followed by a bearish Break of Structure (BOS).
This indicates institutions induced buyers before rejecting the price downwards.
🔎 Key points of the analysis:
• OB-15M: Rejection zone at 1.1614 – 1.1620
• Fake Out: Clear manipulation before the bearish move
• BOS: Structure break confirming bearish intent
• Sell-Side Liquidity: Target at 1.1592
🎯 Setup:
• Entry (Sell): 1.1614
• Stop Loss: 1.1620
• Take Profit: 1.1592
• Risk/Reward: 1:3
💡 Institutional narrative: Distribution → Manipulation → Bearish continuation towards liquidity.
GOOD LUCK TRADERS….;)

EURGBP FREE SIGNAL|SHORT|
✅EURGBP has reached a premium zone tapping into a strong supply level where smart money could engineer distribution. Expecting a reaction to the downside as liquidity is targeted below the previous swing lows.
—————————
Entry: 0.8721
Stop Loss: 0.8730
Take Profit: 0.8708
Time Frame: 3H
—————————
SHORT🔥
✅Like and subscribe to never miss a new idea!✅

GOLD Free Signal! Sell!
Hello,Traders!
GOLD SMC based setup forming after price mitigated the horizontal supply area and showed clear rejection. Smart money is likely offloading long positions here before targeting liquidity below recent equal lows.
-------------------
Stop Loss: 4,188$
Take Profit: 4,093$
Entry: 4,139$
Time Frame: 3H
-------------------
Sell!
Comment and subscribe to help us grow!
Check out other forecasts below too!
Disclosure: I am part of Trade Nation's Influencer program and receive a monthly fee for using their TradingView charts in my analysis.

EUR-GBP Local Short! Sell!
Hello, Traders!
EURGBP tapped a key supply area after a liquidity grab, signaling potential smart money distribution. Expect bearish reaction and continuation toward the target level as price seeks balance after inefficiency.
Time Frame 3H.
Sell!
Comment and subscribe to help us grow!
Check out other forecasts below too!
Disclosure: I am part of Trade Nation's Influencer program and receive a monthly fee for using their TradingView charts in my analysis.

GBPAUD FREE SIGNALS|LONG|
✅GBPAUD Price has reached a key discount zone tapping into a high-probability demand area. Smart money could now be accumulating long positions, anticipating a shift in structure toward the next liquidity draw above recent highs.
—————————
Entry: 2.0450
Stop Loss: 2.0425
Take Profit: 2.0481
Time Frame: 2H
—————————
LONG🚀
✅Like and subscribe to never miss a new idea!✅

USD-CAD Free Signal! Buy!
Hello,Traders!
USDCAD Price is reacting from a well-defined horizontal demand area where previous sell-side liquidity was swept. Smart money may now be accumulating long positions for a bullish push toward the next liquidity pool.
-------------------
Stop Loss: 1.3975
Take Profit: 1.4020
Entry: 1.3995
Time Frame: 3H
-------------------
Buy!
Comment and subscribe to help us grow!
Check out other forecasts below too!
Disclosure: I am part of Trade Nation's Influencer program and receive a monthly fee for using their TradingView charts in my analysis.

NZDUSD LOCAL SHORT|
✅NZDUSD is currently trading inside a premium zone within a key supply area, where liquidity above previous highs has likely been engineered. A shift in market structure from here could confirm a short setup toward the next draw on liquidity. Time Frame 2H.
SHORT🔥
✅Like and subscribe to never miss a new idea!✅

Lucky Cement Ready for Major Upside | Demand Tested, Supply NextHello Billionaires!!
Lucky Cement (LUCK) has successfully completed its Head & Shoulders pattern, reaching into the demand zone and now showing early signs of reversal momentum.
📊 Technical Breakdown:
✅ Head & Shoulders completed — possible end of distribution phase
💎 Demand zone tested and held strong
🔷 Triangle pattern breakout forming
🎯 Targeting Complete Supply Zone (550–560 PKR)
🧠 Smart Money structure: accumulation → expansion → distribution
⚡ Possible Scenario:
Short-term retracement toward demand to grab liquidity before a strong impulsive move toward the major supply zone.
💬 Watch for bullish confirmations near 430–435 PKR for a potential rally toward 550+ PKR.

GOLD BEARISH BIAS|SHORT|
✅XAUUSD broke its main ascending trendline, and gold is now showing bearish structure with potential continuation toward the next downside target. Price has retested the broken trendline before extending lower and we are seeing a clear rejection.Time Frame 2H.
SHORT🔥
✅Like and subscribe to never miss a new idea!✅

CAD-CHF Will Fall! Sell!
Hello,Traders!
CADCHF is approaching a horizontal supply area where institutional selling pressure may return. A reaction from this zone could trigger a bearish continuation toward the next liquidity pocket. Time Frame 5H.
Sell!
Comment and subscribe to help us grow!
Check out other forecasts below too!
Disclosure: I am part of Trade Nation's Influencer program and receive a monthly fee for using their TradingView charts in my analysis.

AUDCHF SHORT FROM SUPPLY ZONE|
✅AUDCHF is showing rejection from a major supply zone, suggesting that smart money is preparing for a bearish continuation toward the lower liquidity pool. The setup remains valid while below the supply range. Time Frame 3H.
SHORT🔥
✅Like and subscribe to never miss a new idea!✅
