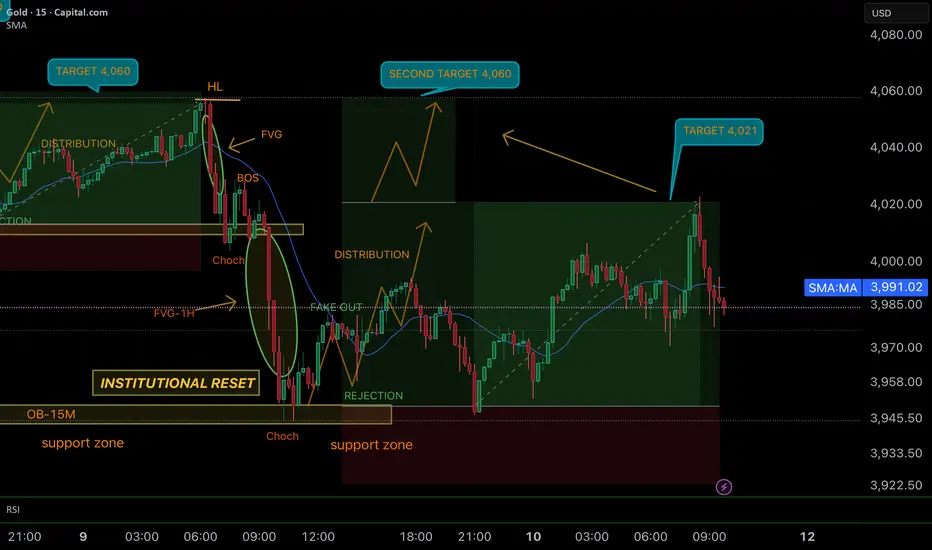
SMART MONEY CONCEPT (SMC)📊 SMC Trade Recap – GOLD 15M
• Both targets achieved: 4,021 ✅ and 4,060 ✅.
• Price respected the support zone after the institutional reset and followed the SMC roadmap step by step.
• The bullish cycle completed with precision: reset → liquidity grab → rejection → distribution → targets hit.
• This is the kind of setup that shows how patience + structure = consistency.
💡 Motivational Caption (English)
“Both targets smashed 🎯🎯 – structure never lies.
Institutional footprints led us step by step into a perfect bullish cycle.
Patience, discipline, and SMC… that’s the formula 🚀📈.”
GOOD JOB TRADERS……. ;)
Smartmoneyconcept

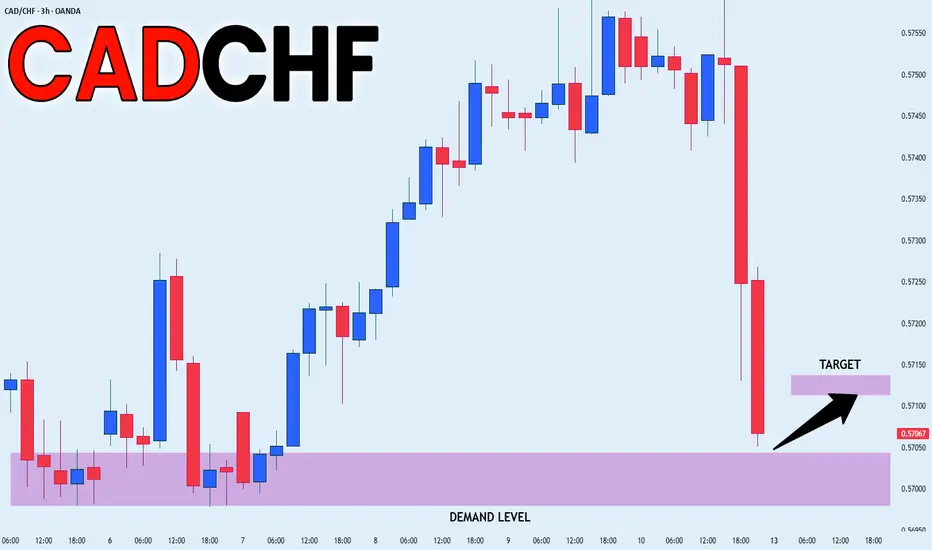
CADCHF RISKY LONG|
✅CADCHF Smart Money targets the demand level where price is likely to react. Liquidity beneath equal lows may soon be swept before expansion toward 0.5715 to rebalance inefficiency. Time Frame 3H.
LONG🚀
✅Like and subscribe to never miss a new idea!✅
EUR-CAD Strong Breakout! Buy!
Hello,Traders!
EURCAD breaks above the key horizontal level, signaling Smart Money expansion after liquidity grab beneath structure. Price may now rebalance inefficiency toward 1.6300, confirming bullish intent. Time Frame 3H.
Buy!
Comment and subscribe to help us grow!
Check out other forecasts below too!
Disclosure: I am part of Trade Nation's Influencer program and receive a monthly fee for using their TradingView charts in my analysis.

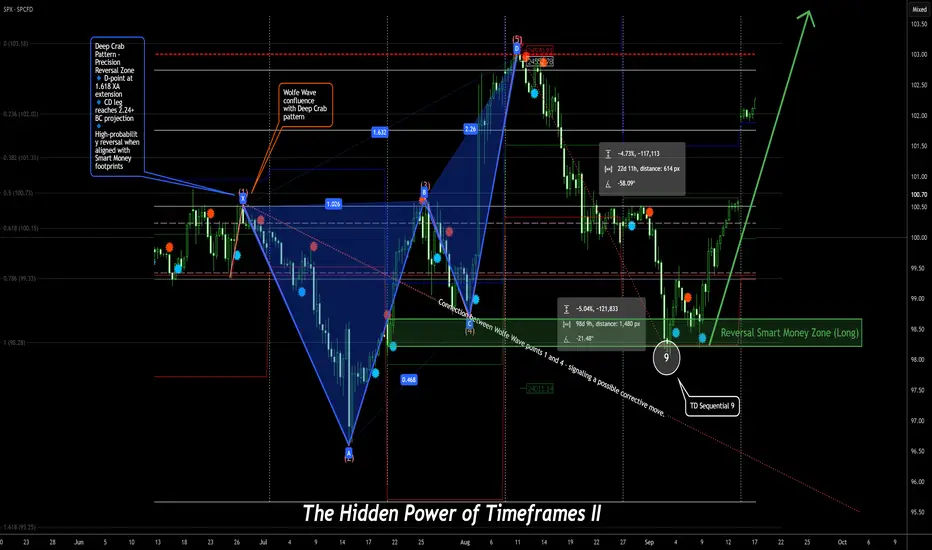
The Hidden Power of Timeframes – Part 2 🔮 The Hidden Power of Timeframes – Part 2 Connection Confluence” – The Invisible Architecture of Precise Trades
Seeing the Invisible
Welcome to Part 2.
If Part 1 gave you clarity on how timeframes interact, we now go one level deeper — into the unseen forces that move beneath the surface of every chart.
🧠 The question is:
“How can I recognize where structure is headed — before it even forms?”
🧠 It’s Not Just About Alignment – It’s About Multi-Timeframe Confluence
The magic doesn’t lie in one indicator or one pattern.
It’s born in the interplay of powerful concepts:
🌀 Wolfe Waves forming at the edges of Order Blocks
🧬 Harmonic Patterns merging with RSI or MACD divergences
🔢 TD Sequential counts signaling exhaustion at precise turning points
🕯️ Japanese Candlesticks confirming what orderflow already whispers
🔐 Smart Money footprints revealing where the crowd dreams — and where those dreams get crushed
This is more than technical analysis.
This is about reading intention — before it becomes visible.
⏳ Multi-Timeframe Fractals – The Echo of the Market
The market is fractal.
What unfolds on a 15-minute chart can mirror the Daily — and often previews the next big move on the Weekly.
📌 Example Scenario:
✅ Bullish divergence on the 4H chart
✅ Aligns with a Gartley pattern on the Daily
✅ Completes just as a TD9 count signals exhaustion on the Weekly
✅ While retesting a monthly liquidity pool
That’s not coincidence — that’s Signal Confluence.
And those who read it are always one step ahead of the market.
🛰️ Smart Money & Orderflow – Trade the Why, Not Just the What
Smart Money doesn’t chase candles.
It trades intent, imbalance, and psychology.
🛠️ Tools of the Trade:
Fair Value Gaps (FVG)
Order Blocks
Liquidity Sweeps
Breaker Blocks
Displacement & Inducement
Retail traders chase patterns.
Smart Money chases the dreams of retail.
🔗 The Real Edge: Seeing Connections Others Miss
A Wolfe Wave is just a shape
An Elliott Wave is just a count
A TD9 is just a number
But when…
🌀 A Wolfe Wave forms during the 5th Elliott Wave
🔢 Ends with a TD9 at a liquidity high
🔐 Inside an Order Block...
💥 That’s not just technicals — that’s chess on the chart.
That’s how real precision is born.
That’s how you anticipate moves weeks — or even months — in advance.
🧭 The Meta Skill: Navigating Confluence Across Timeframes
You don’t need to know everything.
You just need to:
✔️ Recognize when timeframes align
✔️ Feel where systems converge on one idea
✔️ Avoid forcing trades when there’s no synergy
✔️ Only act when the market’s story is consistent across all levels
A true edge doesn’t come from more tools —
It comes from clarity in complexity.
🧩 Bonus Insight: Alignment Within a Single Timeframe
Timeframe confluence is powerful.
But don’t underestimate the strength of multiple high-probability signals inside just one timeframe.
Example:
In a 4H chart:
Wolfe Wave
Harmonic Pattern
Orderflow Zone
Divergence
…all pointing to the same reversal area.
That’s not clutter — that’s weighted confluence.
These moments often deliver the most decisive trades.
💬 Comment below – or share this with someone who’s always fighting their own timeframes.
🚀 Let’s trade with precision — not prediction.
GOLD (XAUUSD) – Smart Money Setup | Bullish Outlook Above 3985 Price is currently trading near a key FVG & Demand Zone (Fib 0.5–0.618), showing signs of potential bullish reversal.
If the structure holds above 3985–3970, buyers could target the Weekly High at 4059 after reclaiming the Previous Day High (4022).
Analysis Highlights:
HTF Bias: Bullish – Rejection from demand + liquidity sweep.
Key Levels:
Support: 3985 / 3970 / 3947
Resistance: 4022 / 4059
Trade Idea: Waiting for liquidity grab → bullish CHoCH → entry confirmation.
Target Zones: 4022 → 4059
Invalidation: Break and close below 3947 zone.

USDJPY POTENTIAL LONG|
✅USDJPY price taps into a clean demand level, showing potential for bullish continuation. Under ICT logic, this setup aligns with a reaccumulation phase before expansion to take buy-side liquidity near 151.50. Time Frame 12H.
LONG🚀
✅Like and subscribe to never miss a new idea!✅

DXY Demand Area! Buy!
Hello,Traders!
DXY pulls back into a well-defined horizontal demand area, aligning with ICT displacement logic. A bullish reaction from this level may confirm accumulation before expansion toward 99.10 liquidity. Time Frame 3H.
Buy!
Comment and subscribe to help us grow!
Check out other forecasts below too!
Disclosure: I am part of Trade Nation's Influencer program and receive a monthly fee for using their TradingView charts in my analysis.

EURUSD FREE SIGNAL|LONG|
✅EURUSD breaks above a key level, confirming bullish order flow under ICT principles. Smart Money likely targeting buy-side liquidity above recent highs, with clean displacement suggesting continuation.
—————————
Entry: 1.1614
Stop Loss: 1.1599
Take Profit: 1.1640
Time Frame: 1H
—————————
LONG🚀
✅Like and subscribe to never miss a new idea!✅

GOLD Free Signal! Buy!
Hello,Traders!
GOLD breaks above a key horizontal level, confirming bullish momentum as Smart Money drives price toward premium zones. The breakout suggests continuation to the 4,035$ target while respecting liquidity structure.
-------------------
Stop Loss: 3,993$
Take Profit: 4,035$
Entry: 4,016$
Time Frame: 1H
-------------------
Buy!
Comment and subscribe to help us grow!
Check out other forecasts below too!
Disclosure: I am part of Trade Nation's Influencer program and receive a monthly fee for using their TradingView charts in my analysis.

GOLD BULLISH CONTINUATION EXPECTED|LONG|
✅XAUUSD confirms a clean breakout above the key level, shifting order flow bullish under ICT principles. A retest may follow before continuation, with price expected to seek buy-side liquidity near 4,030$. Time Frame 1H.
LONG🚀
✅Like and subscribe to never miss a new idea!✅

CAD-CHF Free Signal! Buy!
Hello,Traders!
CADCHF taps into a horizontal demand area after an impulsive sell-off, suggesting Smart Money accumulation. The reaction aligns with bullish intent as liquidity below recent lows is swept.
-------------------
Stop Loss: 0.5699
Take Profit: 0.5719
Entry: 0.5710
Time Frame: 2H
-------------------
Buy!
Comment and subscribe to help us grow!
Check out other forecasts below too!
Disclosure: I am part of Trade Nation's Influencer program and receive a monthly fee for using their TradingView charts in my analysis.

EURCAD BULLISH BREAKOUT|LONG|
✅EURCAD shows a clean breakout above the key level, confirming a bullish shift in market structure. ICT concepts suggest a potential retest before continuation toward 1.63000 where buy-side liquidity rests. Time Frame 3H.
LONG🚀
✅Like and subscribe to never miss a new idea!✅

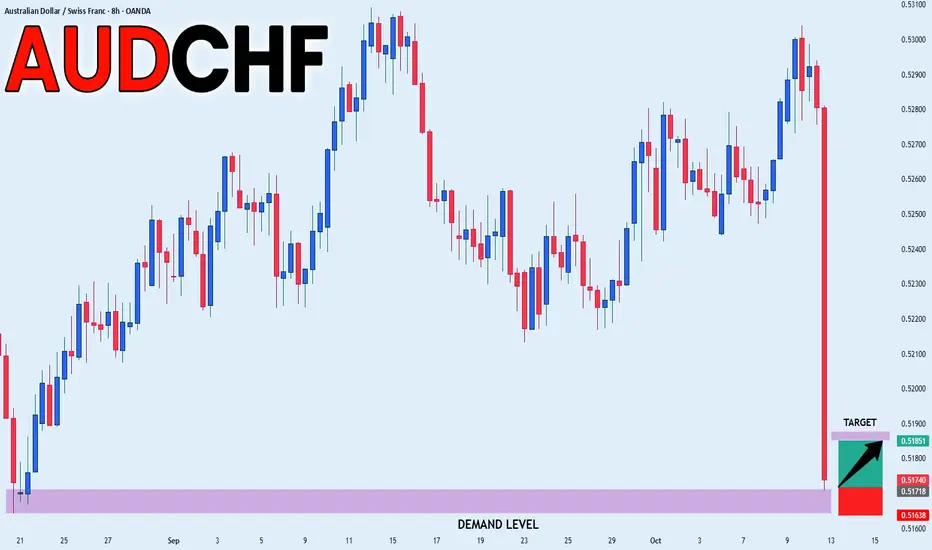
AUDCHF FREE SIGNAL|LONG|
✅AUDCHF shows a strong displacement after tapping into the demand level, signaling ICT-style bullish order flow. The rejection wick confirms accumulation, with price expected to target 0.51851 as short-term liquidity pull.
—————————
Entry: 0.51740
Stop Loss: 0.51638
Take Profit: 0.51851
Time Frame: 8H
Risk: High
—————————
LONG🚀
✅Like and subscribe to never miss a new idea!✅
EUR-USD Local Short! Sell!
Hello,Traders!
EURUSD is reacting from the horizontal supply area after a retracement move, showing early signs of Smart Money distribution. The rejection candle suggests bearish continuation toward 1.1580 target. Time Frame 4H.
Sell!
Comment and subscribe to help us grow!
Check out other forecasts below too!
Disclosure: I am part of Trade Nation's Influencer program and receive a monthly fee for using their TradingView charts in my analysis.

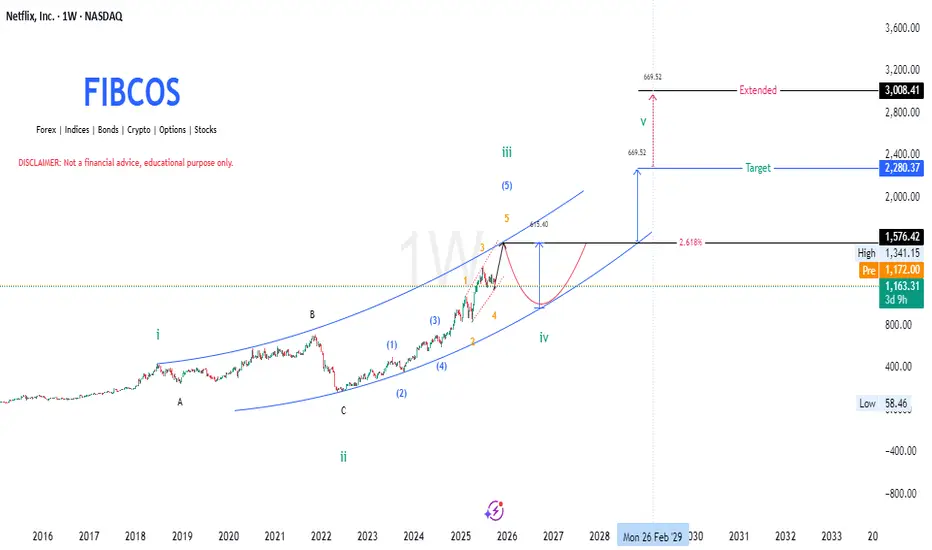
Netflix (NFLX) - Descriptive Analysis by FIBCOS📘 NFLX 2009–2029 Descriptive Analysis
This is a detailed Elliott Wave Theory -based outlook for Netflix (NFLX) stock from around 2009 to the projected future of 2029, and it incorporates Fibonacci retracement & extensions, Smart Money Concepts (SMC) , and Price Action structure within a channel.
Let’s break this down chronologically and structurally:
🌀 Wave Theory Confluence (Elliott Wave Structure)
The long-term structure of Netflix (NFLX) from 2009 to the projected 2029 period follows a classic Elliott Wave cycle, now realigned with the cycle top in mid-2018 and the macro correction ending in mid-2022.
1. Cycle Wave i (2009–2018):
NFLX entered a powerful multi-year rally, forming five sub-waves within this first major impulse. This long rally ended in mid-2018 , marking the top of Cycle Wave i .
2. Cycle Wave ii – ABC Correction (2018–2022):
From the 2018 top, the price entered a prolonged and complex 4-year correction, unfolding as a classic A-B-C corrective structure.
Wave A began the decline with a sharp markdown.
Wave B was a fake recovery, leading to Wave C, a deeper liquidation into mid-2022 , completing the correction.
This phase aligns with a major redistribution cycle where smart money exited positions, and retail investors were caught in hope rallies.
3. Cycle Wave iii (2022–2025):
After finding a bottom in mid-2022, the stock launched a new impulsive rally , forming five sub-waves (1–5) of a powerful Wave iii
Momentum accelerated in wave 3 of iii (typical in Elliott Wave), and the structure is now peaking as of late 2025, around $1,576.42.
This marks the expected completion of Wave iii, with signals pointing toward a correction.
4. Cycle Wave iv (Expected 2025–2027):
A corrective wave iv is expected to unfold, possibly returning toward the lower bound of the long-term ascending channel.
According to the principle of alternation , since wave ii was deep and complex, wave iv may be shallower or more sideways.
5. Cycle Wave v (Expected 2027–2029):
After the wave iv correction, a final impulsive leg — Wave v — is expected to push the price higher, targeting around $2,280.37 , with a potential extended move to $3,008.41 .
This will complete the macro 5-wave cycle that began in 2009.
📐 Fibonacci Confluence
The Fibonacci structure supports these wave formations:
The 2.618 extension of the previous impulse wave (measured from the 2022 bottom) projects a price target near $2,280.37 , aligning with historical extension zones.
The extended target at $3,008.41 aligns with the upper boundary of the long-term channel — often reached during euphoric final waves.
Prior retracements during wave ii and the anticipated retracement in wave iv fall into common Fibonacci pullback zones (0.382–0.618).
Fibonacci tools confirm that price has behaved symmetrically within the wave cycles, and provide high-probability zones for both correction and expansion.
🧠 Smart Money Concept (SMC)
From a Smart Money perspective, the chart reflects a complete institutional cycle:
Distribution Zone (2017–2018):
Smart money exited during the late stages of Cycle Wave i. This aligns with the cycle top in mid-2018 , often accompanied by overvaluation and high optimism.
Re-Accumulation Phase (2018–2022):
The 4-year correction allowed institutional players to accumulate at discounted prices during wave C. Retail was largely shaken out, and liquidity was swept multiple times.
Expansion Phase (2022–2025):
From the 2022 bottom, price moved sharply upward in a clean impulse (Wave iii), confirming institutional interest. Gaps, strong breakouts, and efficient trends reflected low-resistance expansion driven by smart money.
Future Distribution (2029?):
Around the projected $2,280–$3,008 range (Wave v), expect distribution signs —including deviation from trend, order block mitigation, and liquidity grabs. These are typical before a larger market reset.
Smart Money Concepts help explain the why behind each wave: fear and euphoria don’t happen randomly — they are often orchestrated phases of value transfer.
📊 Price Action Structure
The long-term price action of NFLX reinforces the wave count and market psychology:
2009–2018 (Wave i):
Price action showed a steady trend of higher highs and higher lows , with smooth breakouts and momentum-driven runs.
2018–2022 (Wave ii correction):
A breakdown in structure occurred. Lower highs and a wide, overlapping correction defined this multi-year distribution. Key support levels were breached and retested as resistance — a classic bearish shift in structure.
2022–2025 (Wave iii):
Clean, impulsive movement resumed. Breakouts, bullish flags, and retests marked key continuation zones. Market structure flipped back bullish with efficient rallies.
2025–2027 (Wave iv expected):
A retracement is likely toward previous demand zones , possibly aligning with wave 4 of the lower-degree impulse, respecting Elliott’s guideline of wave 4 often retracing to the territory of wave 4 of the previous degree.
2027–2029 (Wave v projection):
Anticipate price pushing into new highs, with potential overextension . However, bearish divergence and slowing momentum could foreshadow the macro top.
This structure shows how technical behavior mirrors emotional and fundamental phases — from greed to fear, and back again.
📆 Timeline Summary (2009–2029)
2009–2018:
Powerful multi-year impulse forms Cycle Wave i , ending in mid-2018.
2018–2022:
A deep, multi-legged ABC correction forms Cycle Wave ii , ending in mid-2022.
2022–2025:
Explosive impulsive rally forms Cycle Wave iii , currently completing around $1,576.42.
2025–2027 (Expected):
A corrective pullback forms Cycle Wave iv , likely more sideways or shallow in structure.
2027–2029 (Expected):
Final rally completes Cycle Wave v , with price targets between $2,280.37 and $3,008.41 , ending the macro Elliott structure.
🔚 Conclusion
With the cycle top revised to mid-2018 and the correction ending mid-2022 , the chart structure becomes even more aligned with classic Elliott Wave theory and Smart Money behavior.
Netflix’s long-term chart is a perfect confluence of:
Elliott Wave structure (impulse → correction → impulse),
Fibonacci precision,
Institutional manipulation (SMC), and
Clear price action behavior.
The roadmap to 2029 shows exciting bullish potential, but also highlights the need for caution near projected macro top zones — where institutional distribution may quietly unfold again.
📘 DISCLAIMER: This is a structural, educational market outlook. Not financial advice. Please do your own due diligence and risk management.
#Netflix, #NFLX, #Nasdaq #WaveTheory, #Fibonacci, #SmartMoney, #PriceAction
USD-JPY Demand Area Below! Buy!
Hello,Traders!
USDJPY is approaching a wide demand area, where Smart Money may engineer a liquidity grab before reversing. Expect price to react from 150.300 zone, targeting 152.000 as inefficiency gets rebalanced. Time Frame 12H.
Buy!
Comment and subscribe to help us grow!
Check out other forecasts below too!
Disclosure: I am part of Trade Nation's Influencer program and receive a monthly fee for using their TradingView charts in my analysis.

SMART MONEY CONCEPT ( SMC)📊 SMC Trade Update – GOLD 15M
• First target 4,021 ✅ achieved.
• Trade now secured at Break Even (BE) – no risk on the table.
• Institutions are still pushing price in distribution mode toward the second target at 4,060.
• This is textbook SMC: reset → fake out → rejection → distribution → targets.
💡 Motivational Caption
“First TP hit 🎯 – now we let the institutions do the heavy lifting.
Risk = 0 ✅ Potential = unlimited 🚀
This is the power of trading with structure.”
GOOD JOB TRADERS……. ;)
CADJPY FREE SIGNAL|LONG|
✅CADJPY forms a bullish structure after reclaiming the demand level, signaling Smart Money interest in premium buys. Liquidity sweep below 108.800 confirms accumulation before a move toward 109.460 target.
—————————
Entry: 109.051
Stop Loss: 108.664
Take Profit: 109.460
Time Frame: 7H
—————————
LONG🚀
✅Like and subscribe to never miss a new idea!✅

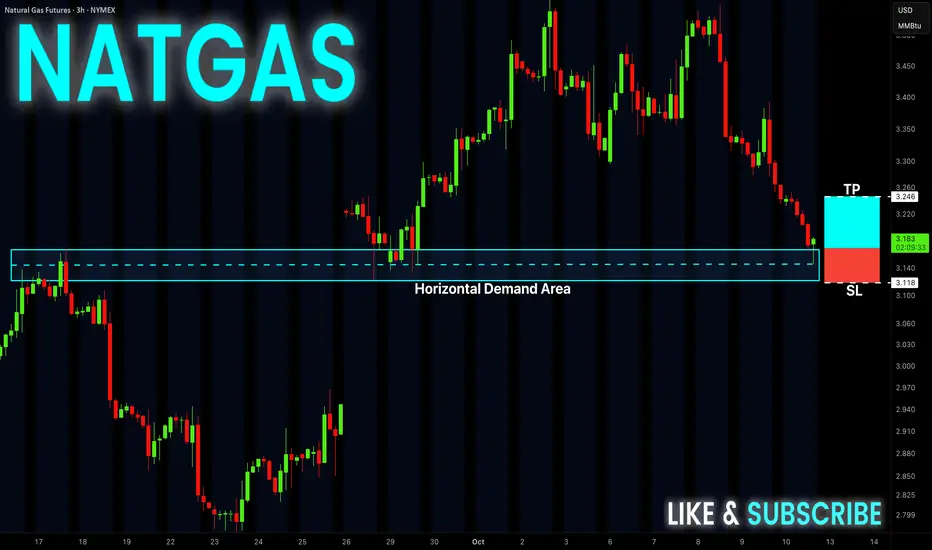
NATGAS Free Signal! Buy!
Hello,Traders!
NATGAS tapped into the horizontal demand area, showing clear signs of Smart Money accumulation. A bullish reaction is expected toward 3.246$, with liquidity resting above recent highs.
-------------------
Stop Loss: 3.118$
Take Profit: 3.246$
Entry: 3.183$
Time Frame: 3H
-------------------
Buy!
Comment and subscribe to help us grow!
Check out other forecasts below too!
Disclosure: I am part of Trade Nation's Influencer program and receive a monthly fee for using their TradingView charts in my analysis.
CADCHF WILL GROW|LONG|
✅CADCHF is consolidating above the demand level, signaling accumulation within a bullish structure. Smart Money likely aims to engineer liquidity before driving price toward the 0.5770 target zone, continuing the uptrend. Time Frame 3H.
LONG🚀
✅Like and subscribe to never miss a new idea!✅

GBPCAD Risky Long! Buy!
Hello,Traders!
GBPCAD is reacting from the horizontal demand area after a deep push into discount pricing. Smart Money shows signs of accumulation, suggesting potential bullish recovery toward 1.8600 to rebalance inefficiency. Time Frame 3H.
Buy!
Comment and subscribe to help us grow!
Check out other forecasts below too!
Disclosure: I am part of Trade Nation's Influencer program and receive a monthly fee for using their TradingView charts in my analysis.

GBPUSD WILL KEEP FALLING|SHORT|
✅GBPUSD confirms a bearish breakout below the supply level as price rejects premium pricing. Smart Money distribution aligns with bearish order flow, suggesting continuation toward the 1.3220 liquidity pool for rebalancing. Time Frame 6H.
SHORT🔥
✅Like and subscribe to never miss a new idea!✅

CRUDE OIL REBOUND AHEAD|LONG|
✅WTI OIL has tapped into the demand level after a sharp decline, showing signs of accumulation. A reaction from this discount area could drive price higher toward 61.10$, where liquidity above minor highs is resting. Time Frame 2H.
LONG🚀
✅Like and subscribe to never miss a new idea!✅
