EUR-USD Bearish Bias! Sell!
Hello,Traders!
EURUSD breaks below the horizontal supply area and is now retesting it as new resistance. Smart Money distribution is evident, and bearish continuation toward the 1.1540 target is expected as inefficiency gets filled. Time Frame 6H.
Sell!
Comment and subscribe to help us grow!
Check out other forecasts below too!
Disclosure: I am part of Trade Nation's Influencer program and receive a monthly fee for using their TradingView charts in my analysis.
Smartmoneyconcept

XAUUSD - Bullish Reversal Zone Forming Near 3945 | SMCGold (XAUUSD) is showing potential bullish signs after reacting from the previous day’s low at 3945.
Price tapped into the Fibonacci 0.5–0.618 retracement zone, aligning perfectly with demand imbalance on the 15-min timeframe.
Key Insights:
📉 Previous Day Low: 3945 acts as liquidity grab zone
🟨 Fib Confluence: 0.5–0.618 golden pocket
🔄 Expectation: Possible pullback → higher low → push toward 3990–4020
📈 Bullish confirmation above 3980
🚫 Invalid below 3940 (clean break of structure)
This setup aligns with Smart Money Concepts (SMC) — expecting a liquidity sweep + market structure shift before continuation.

EURUSD BEARISH BREAKOUT|SHORT|
✅EURUSD confirms a clean breakout below the key level, showing bearish continuation as price rejects premium pricing. Liquidity has been cleared above structure, and Smart Money targets the 1.1520 zone for rebalancing. Time Frame 6H.
SHORT🔥
✅Like and subscribe to never miss a new idea!✅

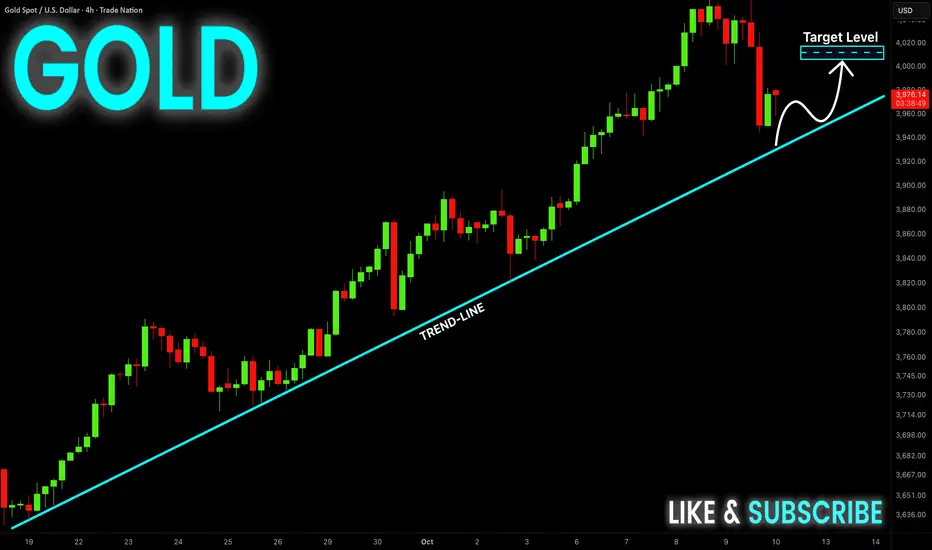
GOLD Long From The Trend-Line! Buy!
Hello,Traders!
GOLD is expected to retest the ascending trendline as Smart Money accumulates around dynamic support. Liquidity has been swept above prior highs, and a correction into discount pricing could spark a bullish continuation toward 4,000$. Time Frame 4H.
Buy!
Comment and subscribe to help us grow!
Check out other forecasts below too!
Disclosure: I am part of Trade Nation's Influencer program and receive a monthly fee for using their TradingView charts in my analysis.
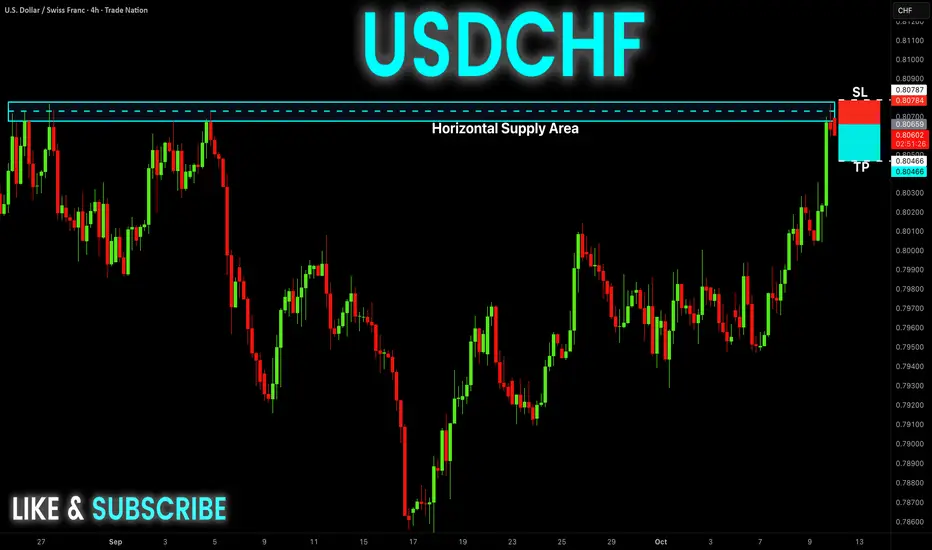
USD-CHF Free Signal! Sell!
Hello,Traders!
USDCHF taps into the horizontal supply area where Smart Money distributes orders. Liquidity above previous highs has been swept, confirming bearish intent with downside target at 0.8046 as imbalance fills. Time Frame 4H.
-------------------
Stop Loss: 0.8078
Take Profit: 0.8046
Entry: 0.8060
Time Frame: 4H
-------------------
Sell!
Comment and subscribe to help us grow!
Check out other forecasts below too!
Disclosure: I am part of Trade Nation's Influencer program and receive a monthly fee for using their TradingView charts in my analysis.
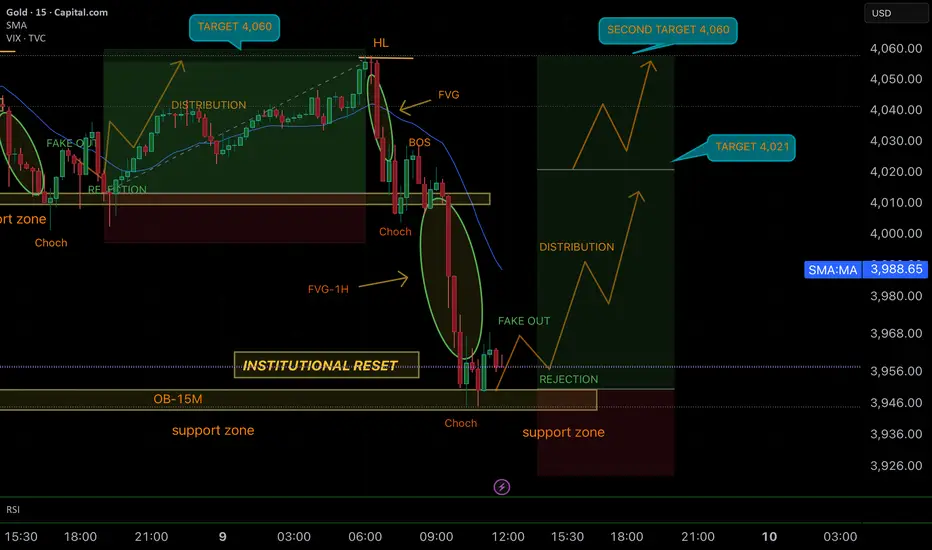
SMART MONEYN CONCEPT (SMC)📊 SMC Analysis – GOLD 15M
• After reaching the High (HL) near 4,060, price broke down with a Break of Structure (BOS), creating a clear institutional reset.
• Price tapped into the 1H Fair Value Gap (FVG-1H) and the 15M Order Block (OB-15M) inside the support zone.
• A Change of Character (ChoCH) plus a fake out formed before rejecting strongly back into bullish territory.
• Current projection: institutions may drive price into a new distribution phase, first targeting 4,021, with a second target at 4,060.
• Setup remains valid while price holds above the support zone and the FVG imbalance is respected.
🚀 Takeaway for traders: Institutional resets aren’t the end of the trend — they’re liquidity grabs to fuel the next leg. Stay patient and follow the footprints.
GOOD LUCK TRADERS… ;)
GOLD FREE SIGNAL|SHORT|
✅XAUUSD forms a clean double top at overbought levels, confirming rejection from premium price levels. The neckline breakout signals Smart Money distribution, with downside targets near 3,920$ as liquidity gets drawn lower.
—————————
Entry: 3,988$
Stop Loss: 4,055$
Take Profit: 3,920$
Time Frame: 3H
—————————
SHORT🔥
✅Like and subscribe to never miss a new idea!✅

GOLD Local Long From 4000$! Buy!
Hello,Traders!
GOLD taps perfectly into the 4000$ demand area where Smart Money accumulates long positions after sweeping liquidity below intraday lows. A bullish reaction toward 4,024$ is expected as price rebalances inefficiency. Time Frame 15M.
Buy!
Comment and subscribe to help us grow!
Check out other forecasts below too!
Disclosure: I am part of Trade Nation's Influencer program and receive a monthly fee for using their TradingView charts in my analysis.

NZDCAD WILL GO DOWN|SHORT|
✅NZDCAD trades within the supply level after a corrective pullback, showing signs of distribution. Price is likely to reject this premium area as Smart Money positions short toward the 0.8030 target zone. Time Frame 2H.
SHORT🔥
✅Like and subscribe to never miss a new idea!✅

GBP-CAD Bearish Breakout! Sell!
Hello,Traders!
GBPCAD confirms a bearish breakout below the ascending trendline, signaling a potential shift in market structure. Smart Money likely engineered liquidity above before breaking down, targeting 1.8620 for rebalancing. Time Frame 3H.
Sell!
Comment and subscribe to help us grow!
Check out other forecasts below too!
Disclosure: I am part of Trade Nation's Influencer program and receive a monthly fee for using their TradingView charts in my analysis.

SMART MONEY CONCEPT (SMC)📊 SMC Trade Review – GOLD 15M
• The setup respected the support zone, showing a fake out and then a strong distribution leg to the upside.
• Target zones at 4,050 – 4,060 were projected, and price reached more than 75% of the planned move before reversing.
• Even without the full TP, the trade followed the plan with precision: liquidity grab → rejection → bullish continuation.
• This is a clear example of consistency and risk management paying off.
💡 Motivational Caption (English)
“Not every trade will hit full TP… and that’s okay. ✅
Taking 75% of the move with discipline is still a win.
Trading is not about perfection, it’s about consistency. 🚀📈”
GOOD JOB TRADERS ;)

SMART MONEY CONCEPT (SMC)📊 SMC Analysis – GOLD 15M
• After the reset with a strong reaction from the support zone, price confirmed bullish intent.
• We saw a fake out followed by a clean rejection, signaling institutional absorption of liquidity.
• The FVG and OB-15M have been respected, reinforcing the bullish bias.
• Current projection: distribution phase pushing price higher toward the new target at 4,060.
• Market structure remains bullish with potential to create new Higher Highs (HH).
🚀 This setup shows how patience pays off: reset → absorption → continuation. Institutions are still leading price to new highs.
Be very careful and good luck TRADERS… ;)

GBPNZD RISKY LONG|
✅GBPNZD is reacting from a clean demand level after liquidity grab below short-term lows. Price structure remains bullish, suggesting a possible continuation toward the 2.3200 target zone as Smart Money accumulates long positions. Time Frame 2H.
LONG🚀
✅Like and subscribe to never miss a new idea!✅

ETHEREUM Free Signal! Buy!
Hello,Traders!
ETHEREUM rebounds from the horizontal demand area, confirming Smart Money accumulation within discount territory. Liquidity has been swept below recent lows, opening the way for expansion toward 4,659$ as inefficiency gets filled.
-------------------
Stop Loss: 4,406$
Take Profit: 4,659$
Entry: 4,531$
Time Frame: 4H
-------------------
Buy!
Comment and subscribe to help us grow!
Check out other forecasts below too!
Disclosure: I am part of Trade Nation's Influencer program and receive a monthly fee for using their TradingView charts in my analysis.

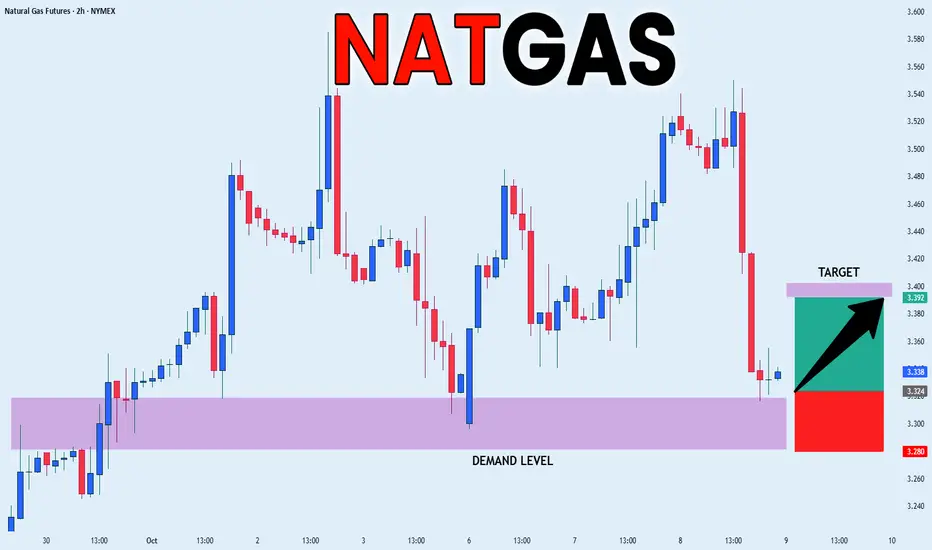
NATGAS FREE SIGNAL|LONG|
✅NATGAS reacts perfectly from the demand level, confirming bullish intent after liquidity sweep below structure. Buyers step in from discounted pricing, aiming for a recovery toward the 3.39$ target zone.
—————————
Entry: 3.33$
Stop Loss: 3.28$
Take Profit: 3.39$
Time Frame: 2H
—————————
LONG🚀
✅Like and subscribe to never miss a new idea!✅
SILVER Free Signal From ATH! Sell!
Hello,Traders!
SILVER hovers just below its all-time high at 50$, showing clear signs of exhaustion as Smart Money distributes near premium pricing. A short-term correction is likely as liquidity above is swept and price seeks rebalancing. Time Frame 3H.
-------------------
Stop Loss: 50.06$
Take Profit: 47.74$
Entry: 48.87$
Time Frame: 3H
-------------------
Sell!
Comment and subscribe to help us grow!
Check out other forecasts below too!
Disclosure: I am part of Trade Nation's Influencer program and receive a monthly fee for using their TradingView charts in my analysis.

USD-CHF Bullish Breakout! Buy!
Hello,Traders!
USDCHF breaks above the descending trendline, confirming a bullish shift in market structure. Smart Money likely engineered liquidity below previous lows before expansion, targeting 0.8040$ as the next key objective. Time Frame 7H.
Buy!
Comment and subscribe to help us grow!
Check out other forecasts below too!
Disclosure: I am part of Trade Nation's Influencer program and receive a monthly fee for using their TradingView charts in my analysis.

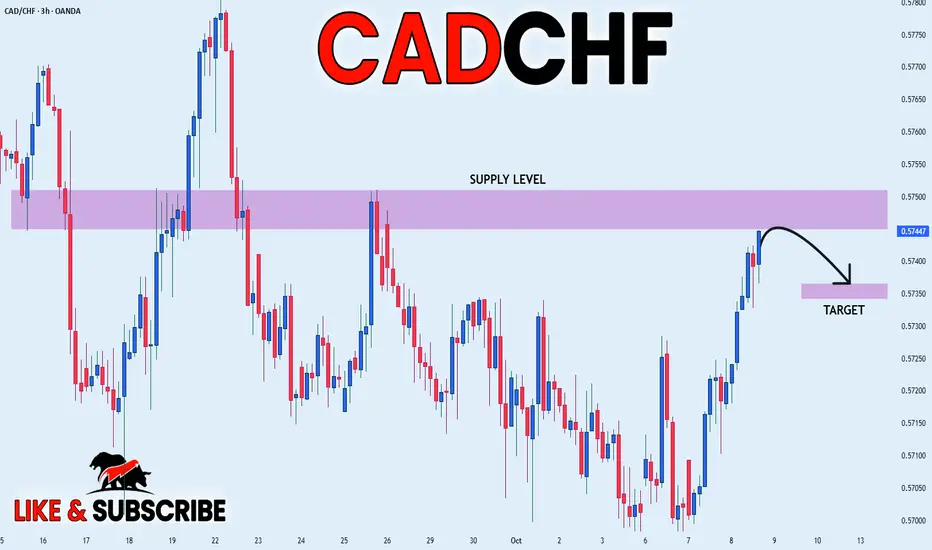
CADCHF SHORT FROM SUPPLY LEVEL|
✅CADCHF is about to retest the supply zone where price previously distributed. Liquidity above equal highs has been engineered, suggesting Smart Money may reprice lower once the zone is mitigated. Time Frame 3H.
SHORT🔥
✅Like and subscribe to never miss a new idea!✅
NZD-CAD Local Short! Sell!
Hello,Traders!
NZDCAD taps into a horizontal supply area after an aggressive bullish move. Price is likely to retrace into premium levels where Smart Money is likely to re-enter shorts, aiming for the 0.8046 target to rebalance inefficiency. Time Frame 3H.
Sell!
Comment and subscribe to help us grow!
Check out other forecasts below too!
Disclosure: I am part of Trade Nation's Influencer program and receive a monthly fee for using their TradingView charts in my analysis.

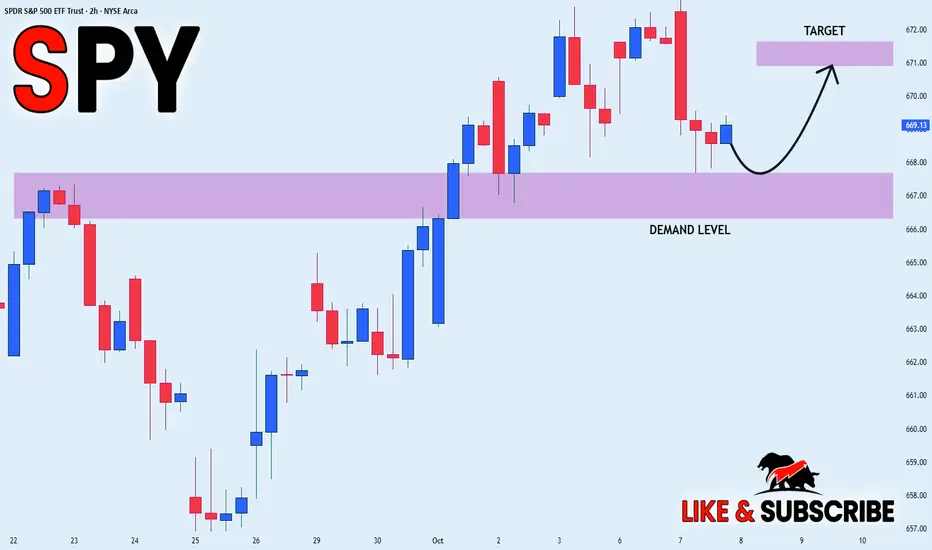
SPY STRONG UPTREND|LONG|
✅SPY showing a strong bullish structure with clear rejections from the demand level. Price continues to form higher lows, confirming institutional support and momentum toward the 671$ target zone. Time Frame 2H.
LONG🚀
✅Like and subscribe to never miss a new idea!✅
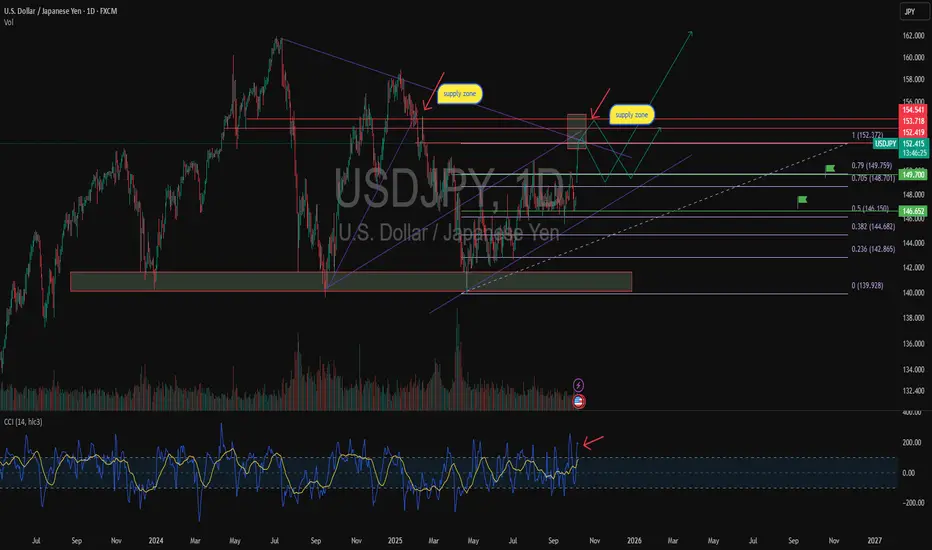
USDJPY: CCI divergence and pullback from supply zoneUSDJPY forms a bearish divergence on the CCI indicator (4H chart), signaling a potential loss of momentum. The pair is testing the supply zone 153.70–154.50, where large players previously took profits.
A confirmed reversal could lead to a decline toward 152.00 → 149.70 → 146.65, aligning with Smart Money structure and liquidity zones.
Fundamentally, the yen may strengthen amid possible Bank of Japan interventions and stabilizing U.S. bond yields.
The USD remains fundamentally strong due to rate differentials but is short-term overbought.
Bearish CCI divergence and approach to a key supply zone suggest a potential correction lower.
NZDUSD BEARISH BREAKOUT|SHORT|
✅NZDUSD breaks below the key level with strong bearish momentum, confirming a clean breakout setup. Price may retest the broken structure before continuing lower toward the 0.5790 target liquidity zone. Time Frame: 2H.
SHORT🔥
✅Like and subscribe to never miss a new idea!✅

GOLD SHORT FROM ATH 4000$
✅XAUUSD is getting closer to the 4,000$ epic supply level and will soon be forming a potential all-time-high rejection. Liquidity above will be cleared, and Smart Money shows bearish intent toward lower rebalancing levels near 3,920$.
—————————
Entry: 3,982$
Stop Loss: 4,010$
Take Profit: 3,920$
Time Frame: 4H
—————————
SHORT🔥
✅Like and subscribe to never miss a new idea!✅
