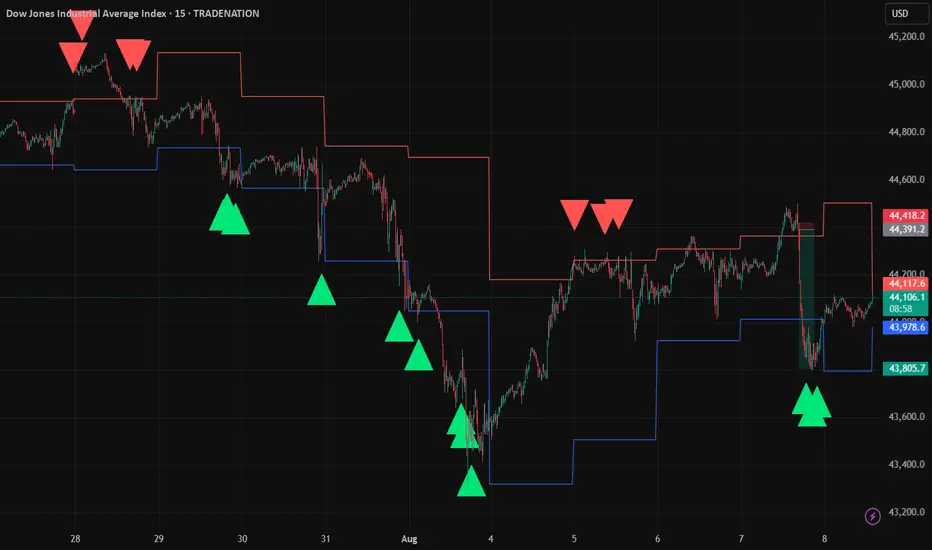
US30 Liquidity Grab Strategy – 15m Chart (1m Precision Entries)Description:
This idea showcases my Liquidity Grab Entry Signals strategy, optimized for US30.
The setup identifies daily high/low liquidity zones with a sensitivity buffer, then confirms reversals using strong engulfing candles.
Key Points:
Daily Liquidity Levels plotted automatically.
Buffer Zone detects price interaction with liquidity.
Engulfing Confirmation for higher probability entries.
Long when price rejects daily low with bullish engulfing.
Short when price rejects daily high with bearish engulfing.
While the precision entries are taken on the 1-minute chart, this 15-minute chart is shown for publication purposes in line with TradingView rules.
Example (Yesterday & Today):
Multiple clean rejections at daily liquidity zones.
Clear 1:15–1:20 R:R potential with minimal drawdown.
Risk Management:
Suggested SL: 10–15 points beyond liquidity zone.
Suggested TP: the next key level.
Precise 1 min entry shown here:
Smartmoneyconcept
GBP_CAD SHORT FROM RESISTANCE|
✅GBP_CAD is set to retest a
Strong resistance level above at 1.8511
After trading in a local uptrend for some time
Which makes a bearish pullback a likely scenario
With the target being a local support below at 1.8430
SHORT🔥
✅Like and subscribe to never miss a new idea!✅

GBPUSD Technical Breakdown – High-Probability Rejection Play📉 GBPUSD Technical Breakdown – High-Probability Rejection Play
🔥 Clean Structure | Strong Confluences | Smart Money Insight
This GBPUSD setup is a textbook example of price action meeting institutional behavior.
🧠 Key Observations:
• Break of Structure (BOS) identified multiple times confirming clear trend shifts.
• Price tapped into a well-defined resistance zone and showed an aggressive rejection, validating seller presence.
• Liquidity grab from the highs led to an immediate drop, marking the start of bearish momentum.
🎯 Target Zones:
• First TP: 1.33009
• Second TP: 1.32375
• Final Target: 1.31443 (aligned with major support zone and BOS retest)
🛡 Why This Setup Matters:
• Strong rejection from premium zone
• BOS confirms direction
• Volume and structure align for high RR potential
• Clean imbalance fill expectations
✅ Plan:
Sell from rejection zone with SL above the wick high. Trail stops as price approaches each target.

EUR-USD Support Ahead! Buy!
Hello,Traders!
EUR-USD is making a local
Bearish correction but
We are bullish biased mid-term
So after the pair hits the horizontal
Support of 1.1577 we will be
Expecting a local bullish rebound
Buy!
Comment and subscribe to help us grow!
Check out other forecasts below too!
Disclosure: I am part of Trade Nation's Influencer program and receive a monthly fee for using their TradingView charts in my analysis.

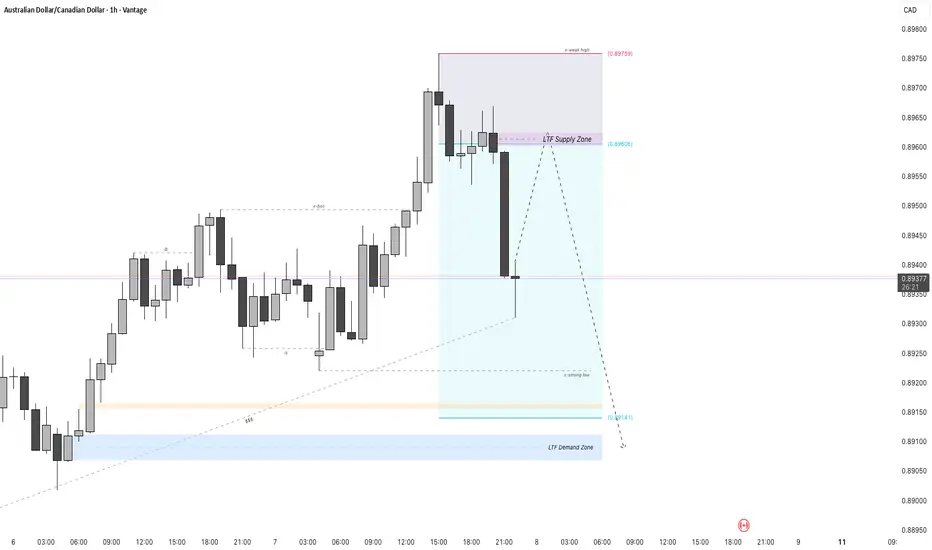
AUDCAD - 1H Chart Using Smart Money ConceptsThis trading plan follows the Smart Money Concept (SMC) methodology, emphasizing institutional price behavior to anticipate potential market moves.
Market Context:
The price recently experienced a strong bearish move from a Higher Time Frame (HTF) Supply Zone around 0.8960, leading to a sharp decline. The current price is at a potential support area near a previous Order Block located around 0.8940.
Major Zones:
LTF Supply Zone (0.8960 region): This is a significant resistance area where institutional sellers previously entered, causing the strong downward move. A retest of this zone could provide a high-probability short setup if price rallies back here.
LTF Demand Zone (around 0.8914): This is a strong support area indicated by the chart that may act as a buyer accumulation zone.
Price Action & Structure:
The chart shows key Smart Money Concept structures including:
Order Blocks (OB): Areas where institutions likely placed orders before strong price moves.
Break of Structure (BOS): Recent bearish structure break confirms a shift in momentum downward.
Trading Bias and Plan:
The plan considers a bearish continuation bias after a potential retracement.
Traders should watch for price to retrace up towards the LTF Supply Zone (the identified resistance zone) before entering short positions. This retracement offers an opportunity to enter with better risk to reward near institutional selling areas.
Confirmation signals like rejection candles or liquidity tests at the supply zone enhance the setup validity.
If the supply zone fails to hold and price breaks higher, the scenario invalidates and traders should reassess.
Targets and Risk Management:
Initial targets can be set near the LTF Demand Zone and further below near strong lows identified on the chart.
Protective stop losses should be placed above the supply zone or above recent swing highs to minimize risk from false breakouts.
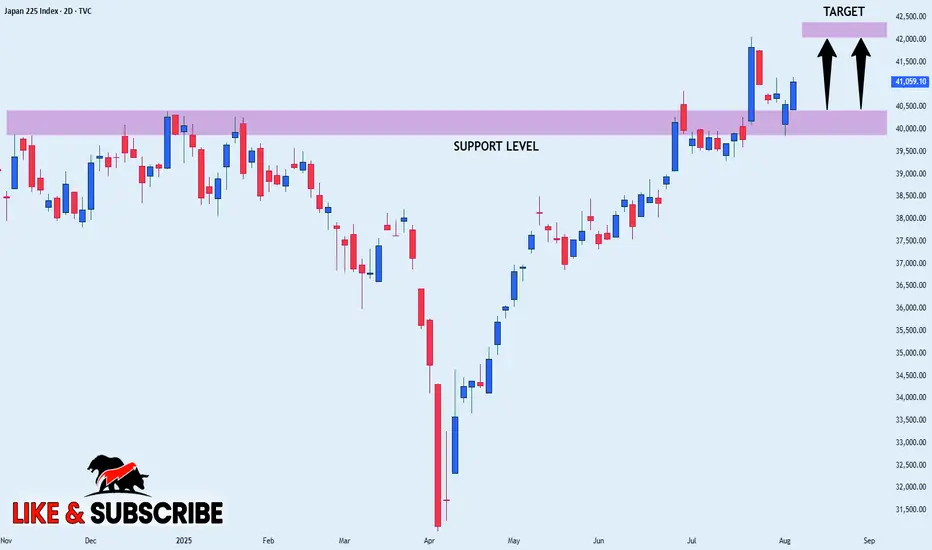
NIKKEI WILL KEEP GROWING|LONG|
✅NIKKEI is trading in an uptrend
And the index was making a bearish correction
But it has now retested a horizontal support level of 40,500
From where we are already seeing a bullish
Reaction and I am expecting the index to go further up
LONG🚀
✅Like and subscribe to never miss a new idea!✅
BITCOIN Bullish Breakout! Buy!
Hello,Traders!
BITCOIN made a bullish
Breakout of the key horizontal
Level of 115,5k$ and the
Breakout is confirmed so
We are bullish biased and
We will be expecting a
Further bullish move up
Buy!
Comment and subscribe to help us grow!
Check out other forecasts below too!
Disclosure: I am part of Trade Nation's Influencer program and receive a monthly fee for using their TradingView charts in my analysis.

NATGAS WILL FALL|SHORT|
✅NATGAS made a retest of the
Strong horizontal resistance level of 3.150$
And as you can see the price is already
Making a local pullback from
The level which sends a clear
Bearish signal to us therefore
We will be expecting a
Further bearish correction
SHORT🔥
✅Like and subscribe to never miss a new idea!✅

EUR-NZD Local Long! Buy!
Hello,Traders!
EUR-NZD made a retest
Of the horizontal support
Level of 1.9540 from where
We are already seeing a
Local bullish rebound so
We will be expecting a
Further bullish move up
Buy!
Comment and subscribe to help us grow!
Check out other forecasts below too!
Disclosure: I am part of Trade Nation's Influencer program and receive a monthly fee for using their TradingView charts in my analysis.

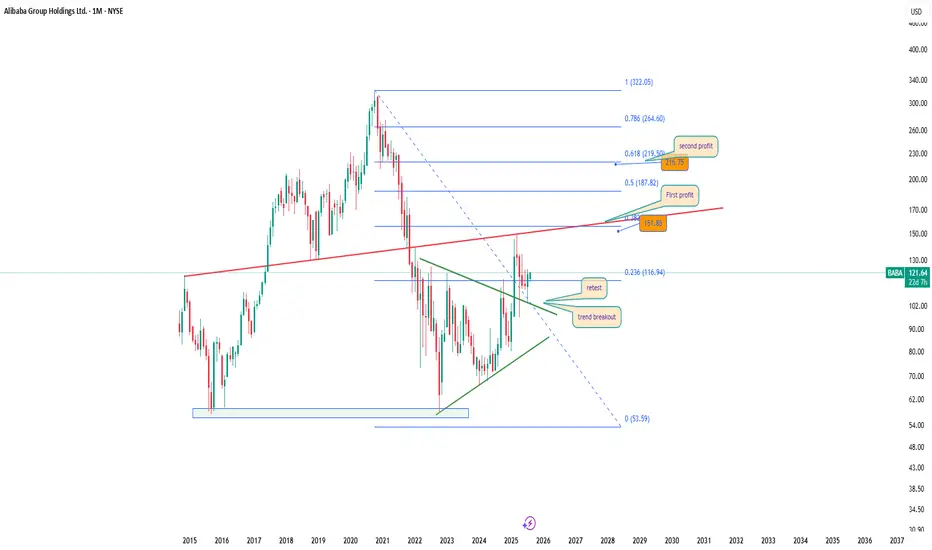
BABA 1M: Chinese favorite rising againTechnical setup:
Breakout from long-term triangle
Retest of trendline confirmed
Price holds above Fibo 0.236 (116.94)
First resistance: 151.85
Fibo targets:
→ 0.5: 187.82
→ 0.618: 219.50
Trade plan:
→ Hold after successful retest
→ Add on dips to 116–118
Targets: 151.85 / 187.82 / 219.50
Fundamentals:
Alibaba is restructuring around cloud and AI. Regulatory pressure from China is easing, and earnings are stabilizing. Buybacks and renewed institutional interest provide strong mid-term support.
Conclusion:
Alibaba may fall seven times, but rise eight — especially when Fibo and price action agree.
SILVER WILL GO UP|LONG|
✅SILVER is going up
Now and the pair made a bullish
Breakout of the key horizontal
Level of 37.73$ and the breakout
Is confirmed so we are bullish
Biased and we will be expecting
A further bullish move up
LONG🚀
✅Like and subscribe to never miss a new idea!✅

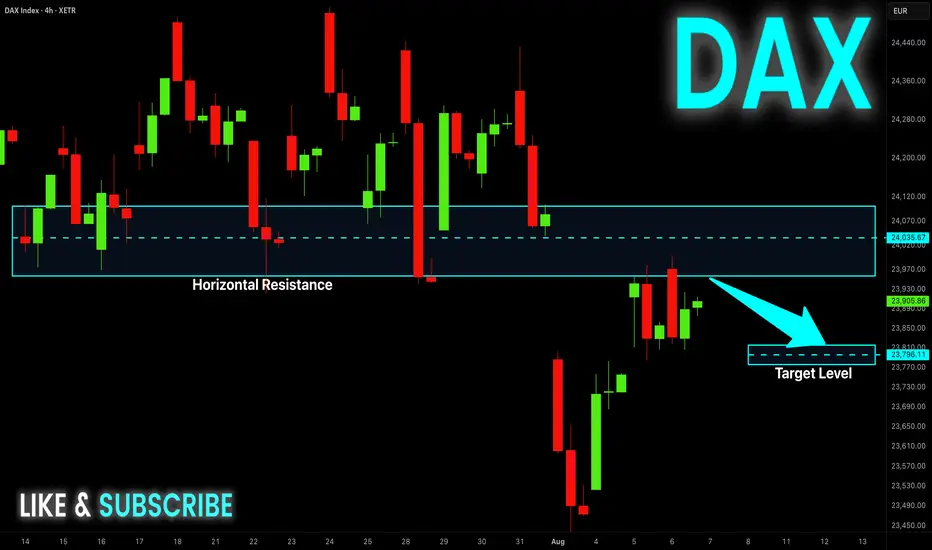
DAX Potential Short! Sell!
Hello,Traders!
DAX went up nicely
But is now about to hit
A horizontal resistance
Around 24,000 so after
The retest we will be
Expecting a local pullback
Sell!
Comment and subscribe to help us grow!
Check out other forecasts below too!
Disclosure: I am part of Trade Nation's Influencer program and receive a monthly fee for using their TradingView charts in my analysis.
BITCOIN PULLBACK FROM SUPPLY AREA|SHORT|
✅BITCOIN price grew again
To retest the resistance of 116k
But it is a strong key level
So we are seeing a bearish reaction
And we will likely see a
Further bearish move down
SHORT🔥
✅Like and subscribe to never miss a new idea!✅
NZD-CAD Bullish Flag Breakout! Buy!
Hello,Traders!
NZD-CAD made a bullish
Breakout from the bullish
Flag pattern and the breakout
Is confirmed so we are
Bullish biased and we will
Be expecting a further
Bullish move up
Buy!
Comment and subscribe to help us grow!
Check out other forecasts below too!
Disclosure: I am part of Trade Nation's Influencer program and receive a monthly fee for using their TradingView charts in my analysis.

AUD_JPY BEARISH BIAS|SHORT|
✅AUD_JPY has retested a key resistance level of 96.000
And as the pair is already making a bearish pullback
A move down to retest the demand level below at 95.500 is likely
SHORT🔥
✅Like and subscribe to never miss a new idea!✅

NZD-JPY Will Go Down! Sell!
Hello,Traders!
NZD-JPY made a retest
Of the horizontal resistance
Level of 87.700 from where
We are already seeing a bearish
Reaction so we area locally
Bearish biased and we will
Be expecting a local
Bearish move down
Sell!
Comment and subscribe to help us grow!
Check out other forecasts below too!
Disclosure: I am part of Trade Nation's Influencer program and receive a monthly fee for using their TradingView charts in my analysis.

NZD_USD LOCAL SHORT|
✅NZD_USD is going up now
But a strong resistance level is ahead at 0.5950
Thus I am expecting a pullback
And a move down towards the target of 0.5920
SHORT🔥
✅Like and subscribe to never miss a new idea!✅

EUR-USD Bullish Breakout! Buy!
Hello,Traders!
EUR-USD is going up now
And the pair made a bullish
Breakout of the key horizontal
Level of 1.1593 and the breakout
Is confirmed so we are bullish
Biased and we will be
Expecting a further
Bullish move up
Buy!
Comment and subscribe to help us grow!
Check out other forecasts below too!
Disclosure: I am part of Trade Nation's Influencer program and receive a monthly fee for using their TradingView charts in my analysis.

XAUSD : M30 Long BiasThis trading plan adopts a bullish bias, anticipating an upward move initiated with an entry into the Fair Value Gap (FVG) zone highlighted on the chart.
Key Components of the Plan:
Entry Zone:
The primary entry for a long position is upon price entering the FVG area (Fair Value Gap). This gap represents a price imbalance, often caused by institutional buying or selling, where the market tends to revisit to fill the gap before continuing its trend. Buying at this zone provides a good risk-reward profile.
Price Context :
Current price is approaching the FVG after a prior strong bullish move, indicating the possibility of a pullback to accumulate before price continuation.
Target Area:
Expect the price to move upward from the FVG zone towards higher levels, potentially reaching recent swing highs or resistance zones mapped by Smart Money Concepts such as order blocks or liquidity targets.
Stop Loss Placement:
A prudent stop loss can be placed just below the lower boundary of the FVG zone or below the strong recent low, to protect against extended downside moves invalidating the trade setup.
Trade Rationale:
The plan leverages smart money concepts where institutional buying in the FVG zone creates a strong demand area for positioning long. This is backed by the technical structure seen in the chart and typical market behavior of filling such gaps.

NZDUSD - M30 Bias LongThis trading plan carries a bullish bias aimed at capitalizing on a probable upward continuation after a well-defined pullback zone. The core idea is to wait for a pullback into a high-probability entry area derived from the Golden Ratio level of the Fibonacci retracement. This Fibonacci zone acts as a natural retracement level where institutional buyers may seek to accumulate positions.
Within this Fibonacci pullback zone lies a Fair Value Gap (FVG) — a price imbalance indicating an area that price tends to revisit and fill during corrections. This FVG acts as an additional confluence factor, strengthening the demand and support within this zone.
The overall expectation is that after this pullback and order flow confirmation, price will resume the upward trajectory toward the Base 1 supply zone at the higher price level marked on the chart. This Base 1 zone represents a strong resistance zone or target where traders can plan their exit or partial profit-taking.
From a fundamental perspective, the trade is supported by a weakening USD, which generally favors NZD/USD strength. This fundamental factor complements the technical Smart Money Concepts setup, increasing the confidence in a bullish continuation.
Key Points:
Bias: Long, targeting upward momentum continuation after pullback.
Entry Zone: Pullback zone at Golden Ratio Fibonacci level with FVG inside
Confluence: FVG provides demand zone strength and better entry quality.
Target: Move to Base 1 supply/resistance zone.
Fundamental Support: Weak USD supports NZD strength.
Trading Concept: Smart Money Concepts focusing on institutional order blocks, Fibonacci retracement, and liquidity gaps.

XAUUSD - 4-Hour Chart with Smart Money Concepts - Long BiasThis trading plan takes a bullish bias outlook based on the Smart Money Concepts framework and fundamental analysis of a weakening USD. The current price action shows Gold approaching a critical Base 1 zone (demand/order block) around the 3375-3390 level, which acts as a key support area where institutional buying pressure is likely to emerge.
Above the current price, there is a well-defined High Time Frame (HTF) Supply Zone that represents a potential resistance area filled with liquidity. This zone provides a target for the expected upward move and highlights where sellers may enter to push prices lower again after the rally.
This setup also incorporates the concept of Fair Value Gap (FVG) visible near the Base 1 area, indicating a price imbalance that price often revisits to fill before continuing its trend. The FVG adds confluence to the potential demand zone, reinforcing the likelihood of a strong bounce from this area.
Fundamentally, the USD is considered weak at this moment, which further supports the bullish outlook for Gold prices, as USD weakness generally propels Gold higher due to its inverse relationship.
The proposed price path anticipates a short-term pullback into the Base 1 zone or FVG area, followed by a strong rally toward the HTF Supply Zone near 3430-3440. This reaction is expected to offer favorable risk-to-reward opportunities for long positions.
Key Points:
Bias: Long, looking for buying opportunities near Base 1 demand zone and FVG area.
Supply Zone: HTF Supply Zone above as a target and liquidity cluster.
Liquidity: Presence of buy liquidity within the Base 1 and FVG zones to fuel the upward move. Fundamental Support: USD weakness supports Gold rally.
Smart Money Concept: Trading around institutional order blocks and FVG for optimal entries.
Price Expectation: Pullback to Base 1/FVG then rally to HTF Supply Zone.

CAD_JPY STRONG UPTREND|LONG|
✅CAD_JPY is trading in an uptrend
Along the rising support line
Which makes me bullish biased
And the pair is already making
A bullish rebound from the support
So a further move up is expected
With the target of retesting the
Level above at 107.705
LONG🚀
✅Like and subscribe to never miss a new idea!✅

USOIL FREE LONG SIGNAL|
✅CRUDE OIL retested the strong support level of 65.14$
After trading in a local downtrend from some time
Which makes a bullish rebound a likely scenario
With the Take Profit of 65.93 and SL of 64.69$
LONG🚀
✅Like and subscribe to never miss a new idea!✅
