EUR-GBP Risky Long! Buy!
Hello,Traders!
EURGBP tapped into a demand level after clearing sell-side liquidity. The market structure shows a clean displacement to the upside, signaling bullish order flow as price seeks to rebalance inefficiency above. Time Frame 3H.
Buy!
Comment and subscribe to help us grow!
Check out other forecasts below too!
Disclosure: I am part of Trade Nation's Influencer program and receive a monthly fee for using their TradingView charts in my analysis.
SMC

US 30 UpdateNext move on the way, focus on proper risk management & stay discipline. Wishing you successful trades..!
Key Reason:
1. Market structure was bullish.
2. H1 support area fresh and unmitigated.
3. Hidden OB formation.
4. Wait for retracement and confirmation.
This is not a financial advise take it with your own risk. Let's see how it will work.

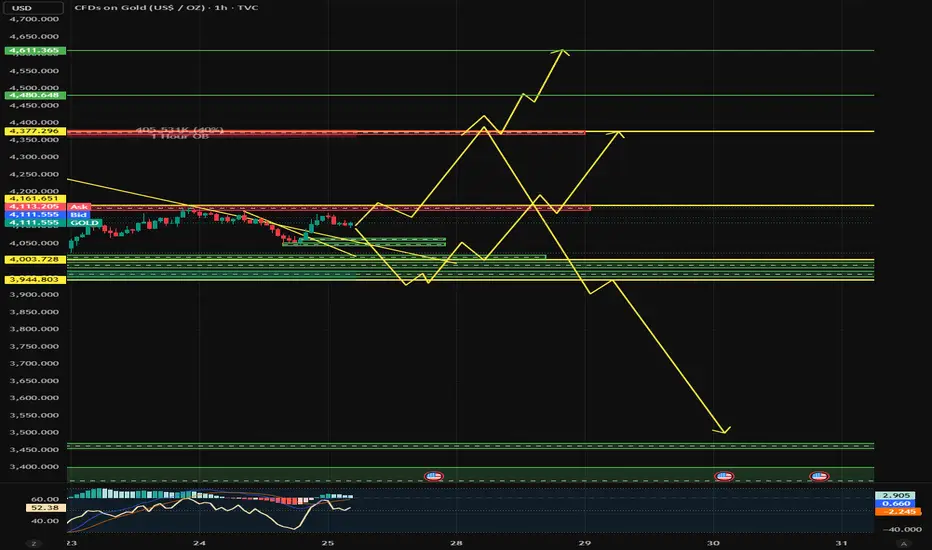
Gold - (XAUUSD) – FOMC Week Setup🟡 Hello Goldies,
Gold enters the final week of October at a macro crossroads — bullish structure intact, but clearly overextended..
📆 FOMC Rate Decision (Wed) → 25 bps cut already priced in, but Powell’s tone will make or break momentum.
🕊️ Dovish = continuation into premium zones
🦅 Hawkish = tactical pullback
📊 US GDP & Core PCE (Thu)
Strong data → USD strength → short-term gold pressure
Softer inflation → opens door for bullish re-expansion
💡 Bottom line: It’s not about the rate — it’s about the narrative.
Weekly Bias
The broader structure stays bullish, but premium fatigue is now visible.
Repeated upper wicks between 4250–4380 suggest exhaustion within the extended rally.
RSI remains deep in overbought territory.
EMAs (5 > 21 > 50 > 100 > 200) hold bullish alignment yet look overstretched.
→ Bias: Bullish macro, vulnerable to tactical correction.
→ Context: Momentum persists, but liquidity tightens on both sides.
Key Structural Zones
🔺 Premium Supply (HTF)
4250–4380 → Primary reaction zone; early signs of institutional distribution.
4500–4650 → Extension supply; achievable under dovish FOMC tone.
💧 Liquidity Gap
4400–3500 → Broad FVG void; clean structure break could accelerate moves toward deeper demand.
🟩 Discount Demand (HTF)
3435–3200 → First reactive structural demand.
3125–2950 → Deep macro base for long-term accumulation.
⚔️ Decision Pivot
3950–4050 → Weekly control zone; defines Q4 path.
Hold → continuation higher.
Lose → liquidity vacuum opens toward 3500.
Scenarios
Bullish Case:
FOMC cut + dovish tone → Defense of 3950–4050 → reacceleration toward 4250–4650.
Confirmations: H4 BOS >4180, RSI >70, EMA5–21 cross.
Bearish Case:
Hawkish tone or strong USD → break below 3950 → slide through 4400–3500 imbalance.
Confirmations: H4 CHoCH + EMA21 break, RSI divergence.
Conclusion (Weekly)
Gold stands at a macro crossroads — structure intact but stretched.
Ceiling: 4250–4380
Pivot: 3950–4050
Hold pivot → 4500–4650 possible. Lose it → 3500 liquidity sweep in play.
Daily Bias
Still bullish but compressed under EMA5–EMA21 — classic pre-breakout compression.
RSI ~58 → balanced momentum.
→ Bias: Bullish macro, neutral near-term.
Key Zones
Supply: 4185–4260 / 4330–4420 / 4500–4550
Decision: 4060–4120 → daily close above = bullish control.
Demand: 4040–3950 / 3860–3755 / 3640–3515
Setups
Hold 4060–4120 → break 4260 → 4330–4550 target.
Fail 4060–4120 → break 3950 → retrace to 3860–3640.
H4 Bias
Fed tone decides short-term trend:
Dovish: breakout above 4245 → 4350–4390.
Hawkish: rejection → retrace to 3950–3900.
Flow:
5 <21 <50 alignment (local pullback), RSI ~50, EMAs 100–200 at 4020/3906 (strong base).
→ Bias: Neutral short-term, bullish macro.
Key Zones
Supply: 4195–4245 / 4355–4390 / 4455–4510
Decision: 4110–4073 (EMA21 confluence)
Demand: 4045–4000 / 3950–3900 / 3840–3800
Above 4110 → bullish continuation.
Below 4073 → retracement to 3950–3840.
H1 Micro Flow
Still corrective, not reversed.
Price compresses around 4115–4095, rejecting 4200 OB.
Supply: 4205–4185 / 4275–4250 / 4355–4335 / 4405–4385
Demand: 4065–4045 / 4005–3985 / 3920–3895
Decision Zone: 4115–4095 (EMA cluster).
Above 4140 → bullish extension.
Below 4090 → retracement toward 4045–3985.
Summary:
Gold is compressing ahead of the FOMC decision — confirmation matters more than anticipation.
Stay patient; this week decides whether we break 4650 or unwind toward 3500.
NZD-CHF Local Short! Sell!
Hello,Traders!
NZDCHF tapped into a horizontal supply area, showing signs of rejection after a liquidity grab above previous highs. Smart Money likely distributing before a move toward the next target zone.Time Frame 3H.
Sell!
Comment and subscribe to help us grow!
Check out other forecasts below too!
Disclosure: I am part of Trade Nation's Influencer program and receive a monthly fee for using their TradingView charts in my analysis.

NZDJPY GROWTH AHEAD|LONG|
✅NZDJPY has reacted from a clean demand level after engineering sell-side liquidity beneath equal lows. Market structure shifted bullish with displacement confirming a potential continuation phase. Time Frame 5H.
LONG🚀
✅Like and subscribe to never miss a new idea!✅

My Steps On how To Improve Forex Trading Win / Loss Ratio In this video we talk about the three elements of the new plan that I have designed based on different types of schools and educational sources.
The plan elements consist of SMC (Smart Money Concepts), Classical School (Support & Resistance, Trend Lines, Febonacci Retracement (not all the time)), and the Stochastic Indicator.
The stochastic is of two timeframes, One is weekly and the other is daily but both are shown on the daily timeframe. This is something that I loved here about TradingView; is the ability to show an indicator of a different timeframe.
Last week I opened a couple of positions based on the new plan, but one of them was opened with haste and not totally adhered to my trading Plan rules.
I show the exact trading rules that I am using and how this will affect my risk management plan.

NZDCHF MOVE DOWN AHEAD|SHORT|
✅NZDCHF is retracing toward a premium supply level where institutional order flow likely shifts bearish. The market engineered buy-side liquidity to mitigate imbalance before continuation lower toward the next draw on liquidity. Time Frame 5H
SHORT🔥
✅Like and subscribe to never miss a new idea!✅

NZD-JPY Will Go Up! Buy!
Hello,Traders!
NZDJPY respected the horizontal demand area, confirming bullish order flow with a clean break of structure. Liquidity beneath the last swing low has been taken, suggesting continuation higher toward the next target level.Time Frame: 3H
Buy!
Comment and subscribe to help us grow!
Check out other forecasts below too!
Disclosure: I am part of Trade Nation's Influencer program and receive a monthly fee for using their TradingView charts in my analysis.

CADJPY FREE SIGNAL|SHORT|
✅CADJPY has tapped into a premium supply zone after sweeping liquidity above previous highs. Smart money shows distribution signs with bearish displacement underway — targeting inefficiency below.
—————————
Entry: 109.230
Stop Loss: 109.610
Take Profit: 108.600
Time Frame: 2H
—————————
SHORT🔥
✅Like and subscribe to never miss a new idea!✅

EUR-JPY Free Signal! Sell!
Hello,Traders!
EURJPY SMC based signal. Price has reacted sharply from a premium supply zone, forming a bearish displacement and potential CHoCH on lower timeframes. Expecting a move into discount levels as liquidity below the recent equal lows gets targeted.
-------------------
Stop Loss: 177.959
Take Profit: 177.510
Entry: 177.744
Time Frame: 3H
-------------------
Sell!
Comment and subscribe to help us grow!
Check out other forecasts below too!
Disclosure: I am part of Trade Nation's Influencer program and receive a monthly fee for using their TradingView charts in my analysis.

Gold > Previous Day Highs?Gold looks interesting from $4,100 - could act as a potential bullish pivot point to target previous day highs.
Kind regards,
Aman

$GU Bullish in the new week?Simple analysis, just looking at potential targets, and seeing these equal highs (EQH) and previous day highs (PDH).
This key level of 1.33 could act as a pivot point, so I'll be interested in monitoring this in the new week open.
Kind regards,
Aman

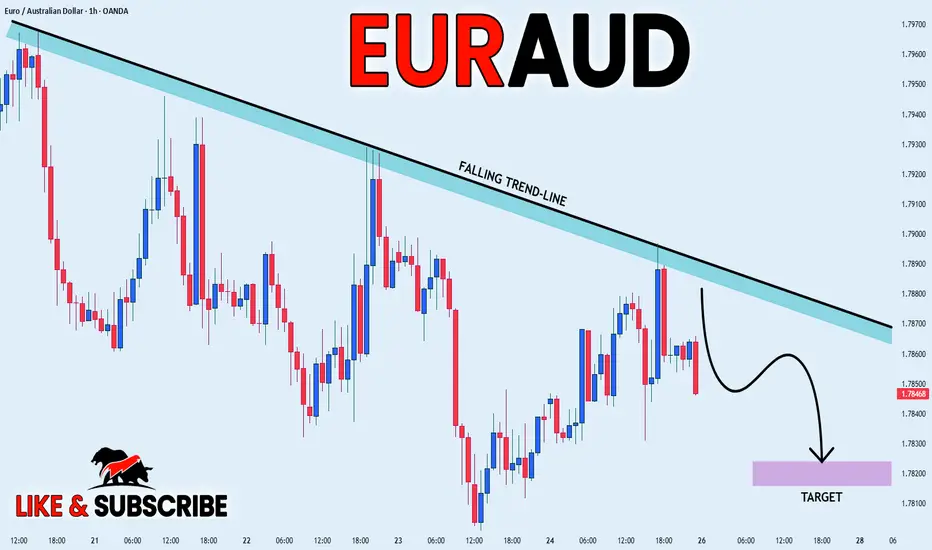
EURAUD WILL GO DOWN|SHORT|
✅EURAUD is respecting the falling trendline, showing rejection from premium levels. Liquidity has been collected above the recent swing, suggesting smart money may aim for the downside to rebalance inefficiency toward the target zone. Time Frame 2H.
SHORT🔥
✅Like and subscribe to never miss a new idea!✅
EUR-CHF Free Signal! Sell!
Hello,Traders!
EURCHF SMC based signal. Price tapped into a key supply zone, showing clear rejection with wicks and momentum shift to the downside. Expecting a short-term retracement toward the target zone below.
-------------------
Stop Loss: 0.9259
Take Profit: 0.9243
Entry: 0.9252
Time Frame: 3H
-------------------
Sell!
Comment and subscribe to help us grow!
Check out other forecasts below too!
Disclosure: I am part of Trade Nation's Influencer program and receive a monthly fee for using their TradingView charts in my analysis.

EURGBP LOCAL SHORT|
✅EURGBP has reached the supply level and is showing signs of rejection from premium pricing. Smart money may look to engineer a retracement toward discounted levels as liquidity above recent highs has been swept. Targeting the lower inefficiency zone for a potential re-balance. Time Frame 2H.
SHORT🔥
✅Like and subscribe to never miss a new idea!✅

EUR-USD Bullish Bias! Buy!
Hello,Traders!
EURUSD SMC based forecast shows price reacting from the horizontal demand area with strong bullish momentum. Liquidity beneath previous lows has been swept, indicating potential continuation to the upside toward the target level. Time Frame 5H.
Buy!
Comment and subscribe to help us grow!
Check out other forecasts below too!
Disclosure: I am part of Trade Nation's Influencer program and receive a monthly fee for using their TradingView charts in my analysis.

NAS100 1H: Bulls vs Bears at the Line📊 NAS100 – 1 Hour Analysis
Hello friends,
Here’s my NAS100 analysis for you.
Looking at the 1-hour chart, I want to highlight a critical level.
👉 If NAS100 breaks above 25,038 and closes a candle there, the next move could point higher.
👉 If NAS100 fails to break 25,038, then a pullback toward 24,267 may come into play.
🙏 Every like is my biggest motivation to keep sharing these analyses.
Thanks to everyone supporting me!

US100 STRONG BREKAOUT|LONG|
✅US100 Price has successfully broken through the key resistance and all-time-high level, confirming bullish intent. As long as the breakout holds above structure, we anticipate continuation toward the next premium zone and liquidity resting at higher highs. Time Frame 3H.
LONG🚀
✅Like and subscribe to never miss a new idea!✅

XAUUSD: Watch for Breakout +70$ Move Timeframe: 1H
Gold is consolidating between 4055 support and 4126 resistance.
A breakout on either side could trigger a $70 move.
Bullish Bias: Break and hold above 4126 → next target 4200 area.
Bearish Bias: Break and close below 4055 → continuation toward 3950 zone.
Invalidation:
If price re-enters the range after breakout, bias becomes invalid.
📊 Overall momentum still favors bears, as lower highs and strong rejections from 4120–4130 keep pressure downward.

SILVER Local Long! Buy!
Hello,Traders!
SILVER SMC based analysis shows price reacting from the horizontal demand area where liquidity has been swept and bullish order flow may soon resume. Expecting a possible push upward toward the next target level once internal structure confirms a shift. Time Frame 5H.
Buy!
Comment and subscribe to help us grow!
Check out other forecasts below too!
Disclosure: I am part of Trade Nation's Influencer program and receive a monthly fee for using their TradingView charts in my analysis.

EURJPY FREE SIGNAL|SHORT|
✅EURJPY has reached a premium zone near a clear supply level, where smart money could be offloading long positions. Expecting a potential reversal setup as liquidity is engineered above previous highs.
—————————
Entry: 177.57
Stop Loss: 177.80
Take Profit: 177.10
Time Frame: 2H
—————————
SHORT🔥
✅Like and subscribe to never miss a new idea!✅

USD-JPY Free Signal! Sell!
Hello,Traders!
USDJPY SMC based setup forming as price taps into the horizontal supply area, showing rejection and loss of bullish momentum. Smart money may now shift order flow to the downside, aiming for liquidity resting below recent lows.
-------------------
Stop Loss: 153.295
Take Profit: 152.612
Entry: 153.024
Time Frame: 3H
-------------------
Sell!
Comment and subscribe to help us grow!
Check out other forecasts below too!
Disclosure: I am part of Trade Nation's Influencer program and receive a monthly fee for using their TradingView charts in my analysis.

US30 Bearish Leg from $46,800Hi everyone,
Sharing a 15m US30 chart for you guys.
This morning, price traded above previous days high and then gave a bearish reaction.
On the shared chart I have the Asian Low (AL) marked out, which has not been swept or traded below yet.
So this could potentially be a good interim bearish target.
This current $46,800 price level could potentially act as a pivot point if the correct confluences form on the lower time frame such as the 5m chart.
Confluences @ $46,800:
- 61.8% FIB
- OB area
- 1h FVG area
Kind regards,
Aman
