$BTCUSDT Analysis - Oct 8 | 4H Time FrameBINANCE:BTCUSDT Analysis - 4H
Hello and welcome to another analysis from the Satoshi Frame team!
I’m Abolfazl, and today we’re going to analyze Bitcoin on the 4-hour timeframe.
Bitcoin has been rejected from the $120,000 level, and we currently expect it to move toward the all-time high.
You can look for entry confirmations on the 15-minute timeframe.
See you in the next analyses!
Stay tuned with the Satoshi Frame team...
SMC

USD-CHF Bullish Breakout! Buy!
Hello,Traders!
USDCHF breaks above the descending trendline, confirming a bullish shift in market structure. Smart Money likely engineered liquidity below previous lows before expansion, targeting 0.8040$ as the next key objective. Time Frame 7H.
Buy!
Comment and subscribe to help us grow!
Check out other forecasts below too!
Disclosure: I am part of Trade Nation's Influencer program and receive a monthly fee for using their TradingView charts in my analysis.

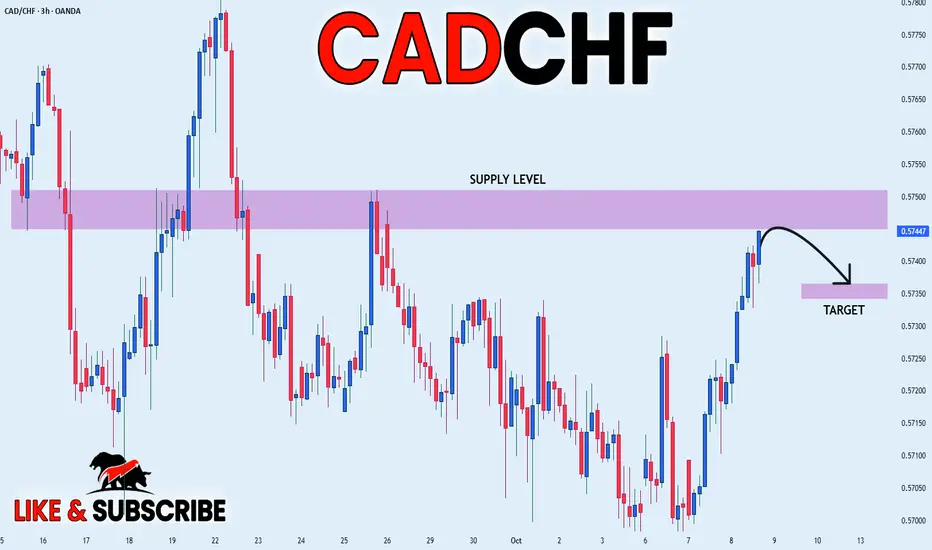
CADCHF SHORT FROM SUPPLY LEVEL|
✅CADCHF is about to retest the supply zone where price previously distributed. Liquidity above equal highs has been engineered, suggesting Smart Money may reprice lower once the zone is mitigated. Time Frame 3H.
SHORT🔥
✅Like and subscribe to never miss a new idea!✅
NZD-CAD Local Short! Sell!
Hello,Traders!
NZDCAD taps into a horizontal supply area after an aggressive bullish move. Price is likely to retrace into premium levels where Smart Money is likely to re-enter shorts, aiming for the 0.8046 target to rebalance inefficiency. Time Frame 3H.
Sell!
Comment and subscribe to help us grow!
Check out other forecasts below too!
Disclosure: I am part of Trade Nation's Influencer program and receive a monthly fee for using their TradingView charts in my analysis.

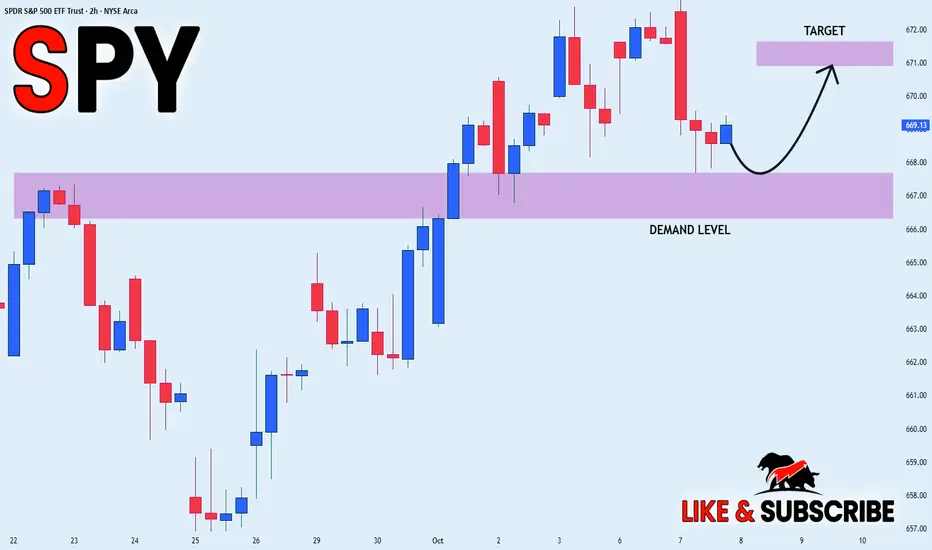
SPY STRONG UPTREND|LONG|
✅SPY showing a strong bullish structure with clear rejections from the demand level. Price continues to form higher lows, confirming institutional support and momentum toward the 671$ target zone. Time Frame 2H.
LONG🚀
✅Like and subscribe to never miss a new idea!✅
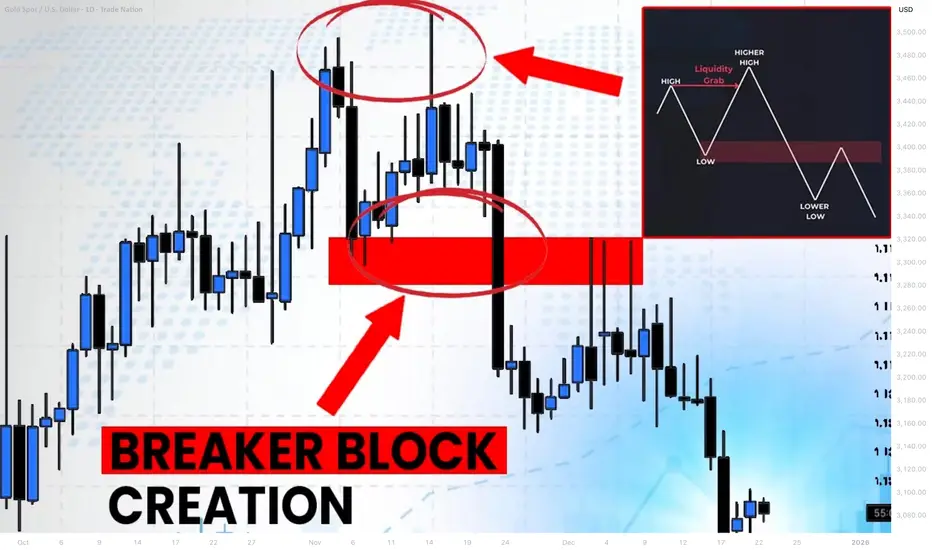
What is Bullish/Bearish Breaker Block & How to Find It Easily
Breaker blocks are easier to find than you think.
In this article, I will share with you very efficient price models for the identification of Order Blocks and Breaker Blocks.
You will learn their meaning, how to draw and use them in trading Smart Money Concepts SMC.
Bullish Trend Model & Breaker Block.
Let's start with an essential theory .
Please, examine a following price model:
In a classic bullish structure where the price consistently updates Higher Highs HH and Higher Lows HH, a bullish order block zone will be the area based on the last Higher How.
I will explain how to draw that zone in the examples below.
In some instances, a bullish order block zone will fail to deliver a bullish wave. Its bearish breakout will follow after its test instead.
It will be a critical event that is called a market structure shift in Smart Money Concepts SMC.
A formation of a new low will signify a violation of a bullish trend and a highly probable change of the market sentiment.
A broken bullish order block zone will turn into a Bearish Breaker Block.
The zone from where the next bearish wave will most likely follow.
It will provide a very safe place to sell from.
Market structure shift in a bullish trend is not a random event.
It usually occurs after a test of a significant supply zone with a liquidity grab.
It can help you to predict the change of the sentiment way before it happens.
That's an example of such a price model on GBPAUD forex pair.
We see a confirmed bullish liquidity sweep in uptrend after a test of a historic supply zone.
A bearish wave followed then and a bullish order block zone was broken.
To draw Order Block Zone, I picked the level of the last higher low as its lower boundary and a low of a body of that candlestick as the upper boundary.
After a breakout, it turned into a Bearish Breaker Block.
A bearish continuation occurred after its test.
Bearish Trend Model & Breaker Block.
Please, check this model:
In a classic bearish structure where the price consistently updates Lower Lows LL and Lower Highs LH, a bearish order block zone will be the area based on the last Lower High.
In some instances, a bearish order block zone will fail to deliver a bearish wave. Its bullish breakout will follow after its test instead.
It will be a significant event that is called a bullish market structure shift in Smart Money Concepts SMC.
A formation of a new high will signify a violation of a bearish trend and a highly probable change of the market sentiment.
A broken bearish order block zone will turn into a Bullish Breaker Block.
The zone from where the next bullish wave will most likely follow.
It will provide a very safe place to buy from.
Market structure shift in a bearish trend is not a random event.
It usually occurs after a test of a significant demand zone with a liquidity grab.
That's a real example of such a price model on WTI Crude Oil.
A bearish structure was violated after a test of a demand zone.
A bearish order block was broken, and it turned into a Bullish Breaker Block Zone then.
(Drawing a bullish order block zone, I picked the level of the last lower high as its upper boundary and a high of a body of that candle as its lower boundary )
A bullish movement followed after a deep test of that.
A proper combination of structure mapping and liquidity analysis will help you to predict a market structure shirt and a breaker block creation before they happen.
The models that I shared will help you to confirm bullish and bearish breaker blocks trading Forex or any other markets with Smart Money Concepts SMC ICT.
❤️Please, support my work with like, thank you!❤️
I am part of Trade Nation's Influencer program and receive a monthly fee for using their TradingView charts in my analysis.
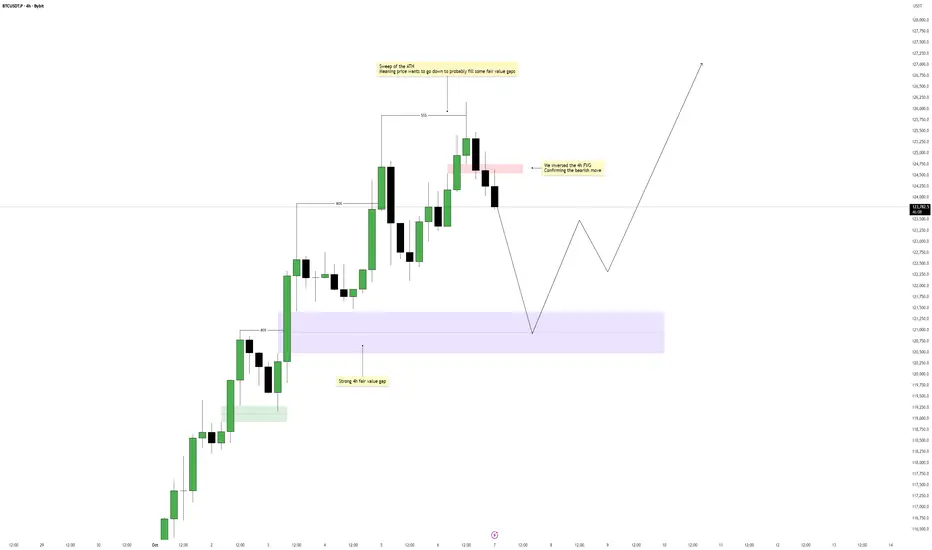
Bitcoin – Short-Term Weakness, Long-Term StrengthBitcoin has recently swept the all-time high, triggering a short-term reaction from liquidity resting above that level. This move often signals that the market has completed its buy-side run and is now seeking to rebalance inefficiencies created during the aggressive push upward. The current structure indicates that price is shifting momentum in the short term, preparing for a deeper retracement before resuming its bullish trajectory.
Imbalance and Structure Shift
Following the liquidity sweep, a clear 4-hour imbalance (IFVG) has formed, acting as the first sign of bearish pressure entering the market. This inefficiency shows that the prior move lacked sufficient counter-orders, meaning price may need to return there to restore balance. The bearish move was further confirmed as price inverted a smaller 4-hour FVG, signaling a potential continuation to the downside in the short term.
Bearish Scenario
If the market continues to respect the newly formed IFVG, we could see a sustained bearish retracement develop. Price may use this imbalance as a draw, seeking to fill deeper inefficiencies left behind during the prior expansion. This corrective phase is not necessarily a trend reversal but rather a short-term redistribution phase before buyers potentially step back in from lower levels.
Bullish Scenario
Once the 4-hour fair value gap below is filled, the market could begin forming a base for a new bullish leg. The liquidity collected from the downside move and the rebalancing of inefficiencies would give price enough fuel for a strong continuation higher. Traders should look for a clean market structure shift or displacement from that demand area as the signal of renewed bullish intent.
Expectations and Outlook
In summary, Bitcoin appears to be in a healthy retracement phase after sweeping liquidity at the highs. The 4-hour imbalance provides a clear short-term target for price to seek, and once filled, the bullish structure could resume. This setup favors patience, waiting for confirmation that the downside rebalancing is complete before anticipating another impulsive rally.
Conclusion
Overall, Bitcoin’s structure suggests a temporary bearish move to fill the 4-hour FVG, followed by a potential bullish continuation once that inefficiency is resolved. Watching how price reacts upon entering that zone will be key in determining whether the next expansion phase begins.
___________________________________
Thanks for your support!
If you found this idea helpful or learned something new, drop a like 👍 and leave a comment, I’d love to hear your thoughts! 🚀
NZDUSD BEARISH BREAKOUT|SHORT|
✅NZDUSD breaks below the key level with strong bearish momentum, confirming a clean breakout setup. Price may retest the broken structure before continuing lower toward the 0.5790 target liquidity zone. Time Frame: 2H.
SHORT🔥
✅Like and subscribe to never miss a new idea!✅

GOLD SHORT FROM ATH 4000$
✅XAUUSD is getting closer to the 4,000$ epic supply level and will soon be forming a potential all-time-high rejection. Liquidity above will be cleared, and Smart Money shows bearish intent toward lower rebalancing levels near 3,920$.
—————————
Entry: 3,982$
Stop Loss: 4,010$
Take Profit: 3,920$
Time Frame: 4H
—————————
SHORT🔥
✅Like and subscribe to never miss a new idea!✅

WHATS UP WITH BITCOIN?
✅BITCOIN went up by almost 16.5% in under 11 days and established a new All-Time-High. An absolutely incredible run, so no wonder we are now seeing a bearish correction.
The take profit wave and the local opportunistic selling pressure might take the price back down to around 118,000$ demand area. This is where we can start buying from again as I am sure a new ATH will be established soon!
LONG🚀
✅Like and subscribe to never miss a new idea!✅

AUD-USD Free Signal! Buy!
Hello,Traders!
AUDUSD reacts strongly from the horizontal demand area, confirming bullish displacement as Smart Money defends discount levels. With liquidity swept below structure, price seeks to rebalance inefficiency toward 0.6599$.
-------------------
Stop Loss: 0.6574$
Take Profit: 0.6599$
Entry: 0.6585$
Time Frame: 1H
-------------------
Buy!
Comment and subscribe to help us grow!
Check out other forecasts below too!
Disclosure: I am part of Trade Nation's Influencer program and receive a monthly fee for using their TradingView charts in my analysis.

ETHEREUM Local Long! Buy!
Hello,Traders!
ETHEREUM reacts perfectly from the horizontal demand area, showing bullish intent as Smart Money rebalances inefficiency. A move toward the 4,560$ target level remains probable as demand continues driving expansion. Time Frame 2H.
Buy!
Comment and subscribe to help us grow!
Check out other forecasts below too!
Disclosure: I am part of Trade Nation's Influencer program and receive a monthly fee for using their TradingView charts in my analysis.

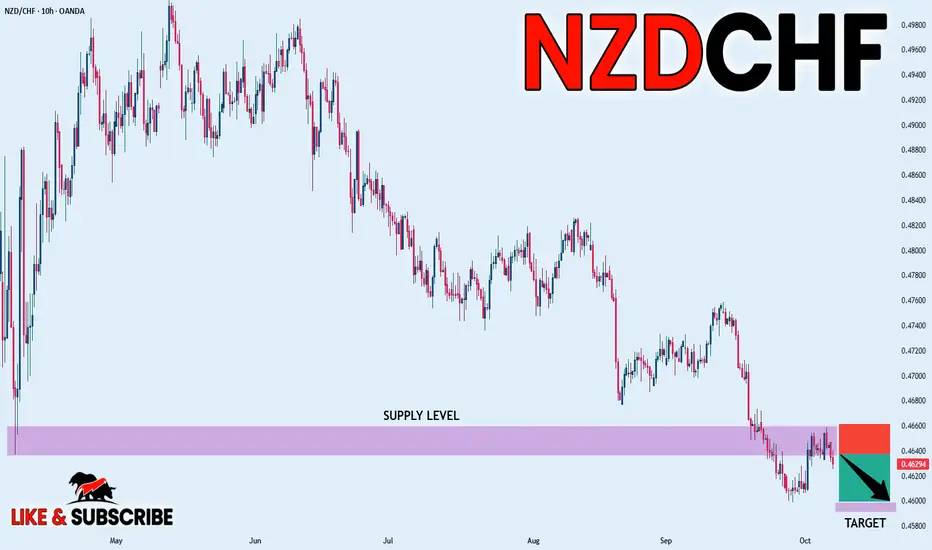
NZDCHF FREE SIGNAL|SHORT|
✅NZDCHF forms a clear double top inside the supply level, signaling exhaustion of buyers. Price rejects premium range and confirms bearish intent as liquidity shifts lower toward the target zone.
—————————
Entry: 0.4620
Stop Loss: 0.4645
Take Profit: 0.4580
Time Frame: 10H
—————————
SHORT🔥
✅Like and subscribe to never miss a new idea!✅
EUR-USD Will Grow! Buy!
Hello,Traders!
EURUSD taps into a horizontal demand area where Smart Money seeks to accumulate long positions. The strong reaction from discount pricing suggests a probable expansion toward the 1.1700 target level as buy-side liquidity gets cleared. Time Frame 3H.
Buy!
Comment and subscribe to help us grow!
Check out other forecasts below too!
Disclosure: I am part of Trade Nation's Influencer program and receive a monthly fee for using their TradingView charts in my analysis.

EURUSD wave structure analysis on 15 minute time frame1H, 4H swing is bullish
M15 swing is bearish
possibility of price falling to the demand zone of H1 frame

EUR-AUD Local Short! Sell!
Hello,Traders!
EURAUD taps into the horizontal supply area, showing a clear bearish displacement as Smart Money seeks to rebalance inefficiency. A retest of the zone is expected before continuation lower. Time Frame 3H.
Sell!
Comment and subscribe to help us grow!
Check out other forecasts below too!
Disclosure: I am part of Trade Nation's Influencer program and receive a monthly fee for using their TradingView charts in my analysis.

AUDUSD FREE SIGNAL|SHORT|
✅AUDUSD reacts strongly from the supply level, rejecting premium structure and confirming bearish order flow continuation. Price aims for the 0.6600 liquidity pool with confluence from previous imbalance.
—————————
Entry: 0.6620
Stop Loss: 0.6628
Take Profit: 0.6600
Time Frame: 1H
Setup Risk: High
—————————
SHORT🔥
✅Like and subscribe to never miss a new idea!✅

ETHEREUM BULLISH BREAKOUT|LONG|
✅ETHUSD shows a clean breakout above the key level as ICT traders anticipate continuation toward the next liquidity pool near 4,760$. Price may retest the breakout zone before pushing higher. Time Frame 2H.Setup Risk: High!
LONG🚀
✅Like and subscribe to never miss a new idea!✅

SILVER Bullish Continuation! Buy!
Hello,Traders!
SILVER holds above the horizontal demand level, showing bullish intent as Smart Money defends premium reaccumulation zones. Expect a move toward 4,885$ to rebalance inefficiency and collect buy-side liquidity. Time Frame 1H.
Buy!
Comment and subscribe to help us grow!
Check out other forecasts below too!
Disclosure: I am part of Trade Nation's Influencer program and receive a monthly fee for using their TradingView charts in my analysis.

EURJPY STRONG GAP UP|LONG|
✅EURJPY gapped up, broke above the structure, and is now retesting the demand area. A rebound here could send price back toward the 176.400¥ target as liquidity above recent highs gets cleared. Time Frame 2H.
LONG🚀
✅Like and subscribe to never miss a new idea!✅

BITCOIN Bullish Bias! Buy!
Hello,Traders!
BITCOIN is testing the upper boundary of a key order cluster, hinting at possible bullish expansion. A confirmed break above could open the way for continuation toward the 126,000$ target zone. Time Frame 8H.
Buy!
Comment and subscribe to help us grow!
Check out other forecasts below too!
Disclosure: I am part of Trade Nation's Influencer program and receive a monthly fee for using their TradingView charts in my analysis.

Building a Trading Plan: The 2nd StepMy trading journey has been defined by a search for consistency. For years, I operated under the belief that a trading plan was a strict list of entry and exit rules. I would follow these rules, yet my results remained unpredictable. The turning point came when I began to understand what is a successful Forex trading plan is. Surely, it is not a rigid document, but a dynamic decision-making system.
The first component of this system is identifying the trading range. This foundational step seems simple, but I learned that its execution is critical. The range establishes the market's current context. It defines the battle between buyers and sellers, creating a clear framework for all subsequent analysis. Without accurately identifying this zone, every decision that follows is built on an unstable foundation. I spend a significant portion of my analysis time confirming these boundaries, knowing that everything else depends on it.
The second component, and the one that brought the entire process into focus for me, is the concept of inducement. In the methodology I am testing, inducement represents a key liquidity area. It is a level where the market is likely to see significant activity from larger participants. Learning to identify these zones clarifies both ends of the trading range. It was no longer just a box on a chart; it became a map with highlighted areas of strategic importance.
This understanding created a powerful filter. It helped me distinguish between a simple break of a level and a meaningful move targeting a specific liquidity pool. My plan specifically focuses on what is classified as a major inducement, which allows me to ignore the minor. This step directly addressed the inconsistency in my earlier trading, as it provided a logical reason for price action beyond basic support and resistance.
Perhaps the most important lesson has been the dynamic nature of a true trading plan. The market is not static, and neither can a Forex trading plan be. I recall a specific backtesting session analyzing the GBPUSD pair on the 15 Minute time frame where a clear change of character occurred. The price action broke a previously defined range. A clear rule shows the difference between a break of strucutre and change of character. Now, I just need to redefine the new trading range with the help of the inducement level. As simple as that.
This proves that a plan’s value is not in preventing change, but in providing a structured method to adapt to it. The plan I am building is a living system. It guides me not only on when to enter a trade but, just as crucially, on when to stand aside and reassess the market structure. This ongoing process of learning and adaptation is, for me, the true essence of what a Forex trading plan must be.

$XAUUSD Analysis - Oct 6 | 15m Time FrameFX:XAUUSD Analysis - 15m
Hello and welcome to another analysis from the Satoshi Frame team!
I’m Abolfazl, and today we’re going to analyze XAUUSD on the 15-minute timeframe.
Gold is showing a strong bullish trend on the 15-minute timeframe, so I recommend avoiding sell positions and focusing only on buy setups.
The marked zones are suitable for trading opportunities.
Price may also react to Fibonacci levels, and the OTE range offers a good area for potential entries.
See you in the next analyses!
Stay tuned with the Satoshi Frame team...
