EURUSD Daily Forecast Update Profit Take -Q3| W39 | D25 | Y25| 📅 Q3 | W39 | D25 | Y25|
📊 EURUSD Daily Forecast
🔍 Analysis Approach:
I’m applying Smart Money Concepts, focusing on:
Identifying Points of Interest on the Higher Time Frames (HTFs) 🕰️
Using those POIs to define a clear trading range 📐
Refining those zones on Lower Time Frames (LTFs) 🔎
Waiting for a Break of Structure (BoS) for confirmation ✅
This method allows me to stay precise, disciplined, and aligned with the market narrative, rather than chasing price.
💡 My Motto:
"Capital management, discipline, and consistency in your trading edge."
A positive risk-to-reward ratio, paired with a high win rate, is the backbone of any solid trading plan 📈🔐
⚠️ Losses?
They’re part of the mathematical game of trading 🎲
They don’t define you — they’re necessary, they happen, and we move forward 📊➡️
🙏 I appreciate you taking the time to review my Daily Forecast.
Stay sharp, stay consistent, and protect your capital
— FRNGT 🚀
#
FX:EURUSD
SMC

ETHERUM FREE SIGNAL|LONG|
✅ETHUSD reacts from higher-timeframe support, running sell-side liquidity before shifting orderflow bullish. Entry at discount seeks draw on liquidity above, targeting imbalance fill near 4360$.
—————————
Entry: 4,169$
Stop Loss: 4,050$
Take Profit: 4,360$
Time Frame: 7H
—————————
LONG🚀
✅Like and subscribe to never miss a new idea!✅

BITCOIN Bullish Breakout! Buy!
Hello,Traders!
BTCUSD reclaims key horizontal level after liquidity sweep, signaling strength. Breakout confirms bullish intent with Smart Money driving price toward 114,341 target to fill imbalance overhead. Time Frame 3H.
Buy!
Comment and subscribe to help us grow!
Check out other forecasts below too!
Disclosure: I am part of Trade Nation's Influencer program and receive a monthly fee for using their TradingView charts in my analysis.

CRUDE OIL FREE SIGNAL|SHORT|
✅CRUDE OIL is going up now
But a strong resistance level is ahead at
Thus I am expecting a pullback and we
Will be able to enter a the following short trade:
------------------------
Entry: 86.500
Stop Loss: 86.700
Take Profit: 86.100
------------------------
SHORT🔥
✅Like and subscribe to never miss a new idea!✅

GOLD Free Signal! Sell!
Hello,Traders!
GOLD is trading in a strong uptrend. And it is oversold now, so as the price has formed a double top pattern, we will be expecting a bearish correction. The confirmation for the entry will be the breakout of the neckline.
------------------
Stop Loss: 3,791$
Take Profit: 3,710$
Entry: 3,754$
Time Frame: 3H
------------------
Sell!
Comment and subscribe to help us grow!
Check out other forecasts below too!
Disclosure: I am part of Trade Nation's Influencer program and receive a monthly fee for using their TradingView charts in my analysis.

NZD_CHF SWING BEARISH BREAKOUT|SHORT|
✅NZD_CHF broke the key
Structure level of 0.4640
While trading in an local
Downtrend, which makes me
Bearish biased, and and I think
That after the retest of the
Broken level is complete,
A bearish continuation will follow
SHORT🔥
✅Like and subscribe to never miss a new idea!✅

GBP-AUD Long From Support! Buy!
Hello,Traders!
GBPAUD taps into horizontal support, clearing sell-side liquidity. Buyers step in at discount, suggesting a reaction toward 2.0414 as price seeks to rebalance inefficiency left above.Time Frame 3H.
Buy!
Comment and subscribe to help us grow!
Check out other forecasts below too!
Disclosure: I am part of Trade Nation's Influencer program and receive a monthly fee for using their TradingView charts in my analysis.

NZD_USD BEARISH BREAKOUT|SHORT|
✅NZD_USD price breaks key support zone, confirming bearish orderflow. Smart Money shows breakout with liquidity run, targeting lower demand near 0.5810 as sellers take control after structure shift.
SHORT🔥
✅Like and subscribe to never miss a new idea!✅

EUR-USD Support Below! Buy!
Hello,Traders!
EUR-USD price sweeps liquidity below demand, tapping into discount zone. Smart Money expects reversal with bullish orderflow targeting 1.1755, aligning with structure shift and mitigation of imbalance.
Buy!
Comment and subscribe to help us grow!
Check out other forecasts below too!
Disclosure: I am part of Trade Nation's Influencer program and receive a monthly fee for using their TradingView charts in my analysis.

ETH and BTC seeking further lows?Everything explained in video, please let me know if I missed anything or any other thoughts 🙏🏾

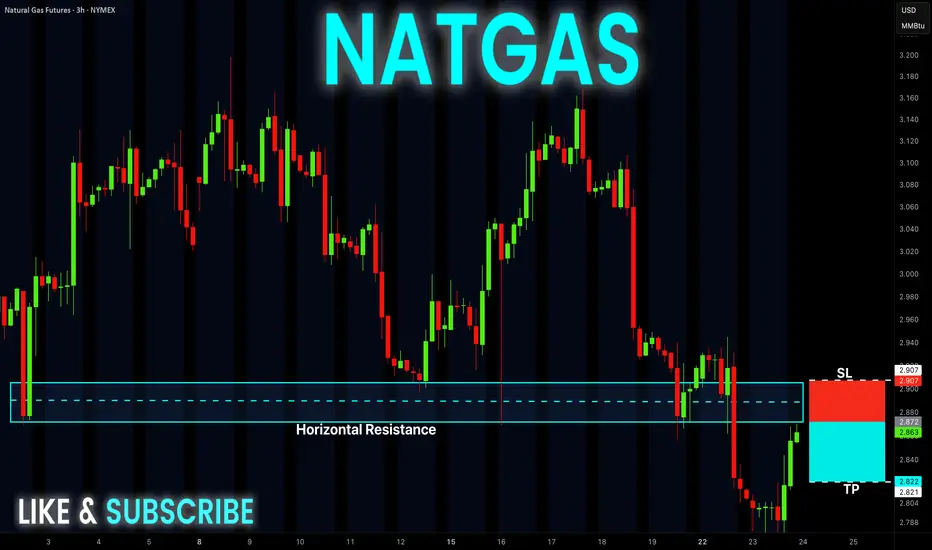
NATGAS Free Signal! Sell!
Hello,Traders!
NATGAS is making a bullish
Correction move, but a horizontal
Resistance area is ahead
Around 2.890$ and after
The retest a local bearish
Pullback is to be expected
So we will be able to enter
A following short trade:
------------------
Stop Loss: 2.907
Take Profit: 2.822
Entry: 2.872
Time Frame: 3H
------------------
Sell!
Comment and subscribe to help us grow!
Check out other forecasts below too!
Disclosure: I am part of Trade Nation's Influencer program and receive a monthly fee for using their TradingView charts in my analysis.
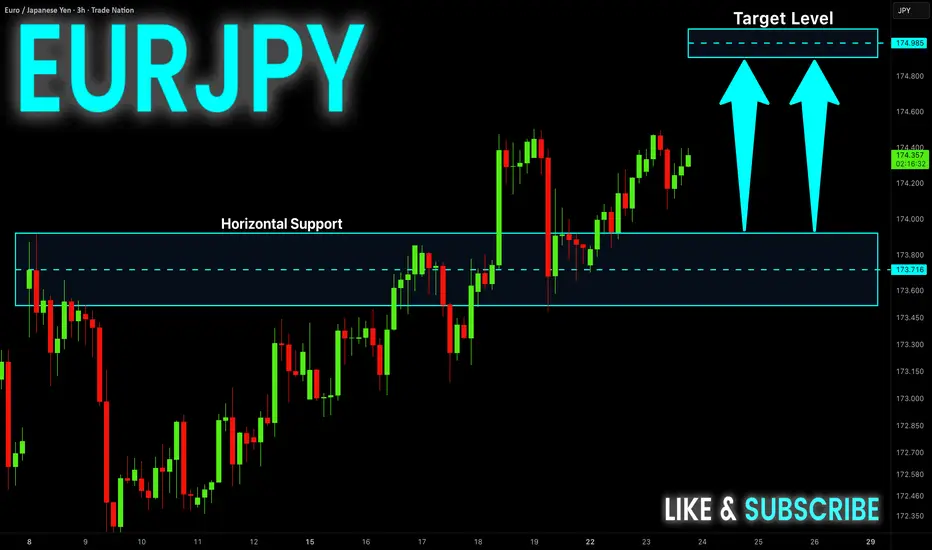
EUR-JPY Will Keep Growing! Buy!
Hello,Traders!
EUR-JPY is trading in an
Uptrend and the pair is
Already making a nice
Rebound from the horizontal
Support level of 173.800
So we are bullish biased and
A further bullish move up
Is to be expected
Buy!
Comment and subscribe to help us grow!
Check out other forecasts below too!
Disclosure: I am part of Trade Nation's Influencer program and receive a monthly fee for using their TradingView charts in my analysis.
EUR_AUD GROWTH AHEAD|LONG|
✅EUR_AUD is going down now
But a strong support level is ahead around 1.7800
Thus I am expecting a rebound
And a move up towards the target of 1.7923
LONG🚀
✅Like and subscribe to never miss a new idea!✅

EUR-GBP Will Grow! Buy!
Hello,Traders!
EUR-GBP is trading in an
Uptrend and the pair is
Going down to retest
The horizontal support
Around 0.8709 so after
The retest we will be
Expecting a further
Bullish move up
Buy!
Comment and subscribe to help us grow!
Check out other forecasts below too!
Disclosure: I am part of Trade Nation's Influencer program and receive a monthly fee for using their TradingView charts in my analysis.

DXY LOCAL LONG|
✅DXY is going down to retest
A horizontal support around 97.200
Which makes me locally bullish biased
And I think that we will see a rebound
And a move up from the level
Towards the target above at 97.440
LONG🚀
✅Like and subscribe to never miss a new idea!✅

GBP-CAD Will Go UP! Buy!
Hello,Traders!
GBP-CAD is going up now
And the pair is consolidating
Above the key horizontal level
Of 1.8670 and as we are
Bullish biased we will be
Expecting a further
Bullish move up
Buy!
Comment and subscribe to help us grow!
Check out other forecasts below too!
Disclosure: I am part of Trade Nation's Influencer program and receive a monthly fee for using their TradingView charts in my analysis.

Gold - Quick Move!⚡ GOLD – Quick Forecast ⚡
⏱ 5M View (Lower TF)
Price is riding an ascending channel, respecting both trendlines.
Strong impulsive leg (yellow highlight) → market broke higher with momentum.
Now consolidating just under the upper channel line, cooking for the next move.
🔑 Liquidity & Zones
SSL (sell-side liquidity) marked below — prime magnet if price wants a quick dip.
Confluence reload area: Fib 71% + Imbalance fill + SSL zone around 3770–3765.
If tapped, buyers likely reload here for another rocket.
🎯 Play of the Day
Hold current structure = direct push toward 3805–3810 🚀.
Deeper retrace into SSL/71% zone = better entry for continuation long.
Break below channel low? ❌ Idea cooked, bears reclaim flow.
📝 Forecast Summary
📍 Bias : Bullish (buy dips)
🎯 Target : 3805–3810
🪙 Reload Zone: 3765–3770
❌ Invalidation : Break below channel low
EUR/USD forecast (1H)⚡ EUR/USD – Top-Down Breakdown ⚡
🕰 Weekly View
Big picture shows price tapping into HTF resistance zone (1.1850–1.1900).
Structure is still heavy long-term, but bulls have carved a corrective leg upward.
📅 Daily View
Price reacted off discount demand earlier in August, shifting order flow bullish.
Now, price has tested the HTF resistance and left a strong wick → sellers showing interest.
Room below for a deeper retrace into demand.
⏳ 4H View
Multiple i-BOS along the way up, confirming bullish order flow.
Current correction pulled back into a 4H reaction zone → Buy Zone 1 (1.1720s).
If this fails, next major support sits at Buy Zone 2 (1.1580s) aligned with 71% fib & imbalance fill.
⏱ 1H View
Price swept BSL at the top, then sold off into the 4H reaction zone.
Buyers defending here for now, but structure isn’t super clean → liquidity still resting below.
If bulls hold above Buy Zone 1 → bounce back toward 1.1820–1.1850.
If it breaks, we dip deeper into Buy Zone 2 (1.1580s) before bulls reload.
🎯 Forecast Summary
📍 Bias : Bullish corrective, but expecting deeper retrace
🎯 Upside Target: 1.1820–1.1850
🪙 Buy Zones:
Zone 1 → 1.1720s (current)
Zone 2 → 1.1580s (HTF demand)
❌ Invalidation: Break below 1.1550 swing low

USD/CAD Forecast (1H)🔥 USD/CAD Forecast (1H Breakdown)
🕰 Weekly View
Market is sitting in a bigger swing range.
We had a strong sell-off, but bulls are clawing back — retracing into mid-range supply.
Momentum leaning corrective → buyers probing liquidity before any bigger move.
📅 Daily View
Clear demand base built around 1.3720s.
Price stair-stepped higher with higher lows, heading back toward the 1.3890–1.3920 daily supply pocket.
Structure is short-term bullish, but daily still hovering inside a corrective leg.
⏳ 4H View
Several internal BOS (i-BOS) prints on the way up → strong intraday bullish order flow.
We’re now reacting from internal range supply.
Below, SSL + imbalance + fib 71% confluence sits at 1.3780–1.3800 = 🔑 reload zone.
⏱ 1H View
BSL swept, sellers testing the entry zone.
Expecting a pullback into SSL/71% → if buyers hold, 🚀 continuation higher.
If price smashes swing low, bullish idea invalid and shorts take over.
🎯 Forecast Summary
📍 Bias : Bullish but expecting a dip before continuation
🎯 Upside Target: 1.3890–1.3920
🪙 Reload Zone: 1.3780–1.3800
❌ Invalidation: Clean break of swing low

REAL VS FAKE CHOCK🔹 1. Real Choke vs Fake Choke
A **Choke** in ICT/SMC language usually refers to a **block of price action where liquidity is absorbed** and either the trend reverses or continues strongly. It is connected to the idea of **Order Blocks, IDM (Imbalance-Demand-Mitigations)** and **Liquidity Absorption**.
### ✅ Real Choke
* Happens when **genuine liquidity is absorbed** by institutions (big players).
* Price reacts to the choke level → gives a **clear displacement** in opposite direction.
* Characteristics:
* Strong rejection (impulsive move away).
* Volume & imbalance support the move.
* Leaves behind a valid **IDM / FVG / Order Block**.
* Usually aligns with **higher timeframe POI** (HTF OB, FVG, BPR).
👉 **Effect**: Becomes the base for a **true reversal or strong continuation**.
---
### ❌ Fake Choke
* Happens when price **pretends to absorb liquidity** but it’s just a **stop hunt / inducement**.
* Market sweeps liquidity near choke level → then continues in original direction.
* Characteristics:
* Small/weak rejection, no real displacement.
* No proper imbalance or absorption.
* Often formed just to **trap retail traders** thinking reversal is coming.
* Seen in **mid-range / liquidity inducement zones**, not at HTF POI.
👉 **Effect**: Leads to **continuation in same direction** after trapping liquidity.
---
## 🔹 2. Why IDM (Imbalance Demand Mitigation) is Important
**IDM** is the footprint of institutions when they:
* Absorb liquidity,
* Create imbalance, and
* Mitigate their positions later.
It’s important because:
1. **Shows Institutional Interest** → IDM confirms that Smart Money actually participated.
2. **Validates Choke** → If choke has IDM inside it → higher chance it’s **real**.
3. **Gives Entry Points** → IDM zones often become mitigation levels (precise entries with low risk).
4. **Separates Fake vs Real** → Fake chokes usually have no IDM footprint.
---
## 🔹 3. Role of IDM in Reversal & Liquidity Absorption
When market is reversing:
* First, **retail liquidity is collected** (fake choke).
* Then, institutions place **real choke + IDM** to absorb liquidity.
* The IDM ensures that:
* All **supply/demand imbalance** is cleared,
* Institutions get filled,
* Price is ready for a **clean reversal**.
👉 **In Short:**
* **Fake choke** = liquidity grab.
* **Real choke + IDM** = liquidity absorption + reversal base.
---
⚡So, the easiest filter is:
* If a choke has **IDM (clear imbalance & mitigation footprint)** → it’s **real**.
* If not → it’s just a **fake liquidity sweep**.

NZD_CAD LOCAL SHORT|
✅NZD_CAD has retested
A key resistance level of 0.8120
And as the pair is already
Making a bearish pullback
A move down to retest the
Demand level below
At 0.8090 is likely
SHORT🔥
✅Like and subscribe to never miss a new idea!✅

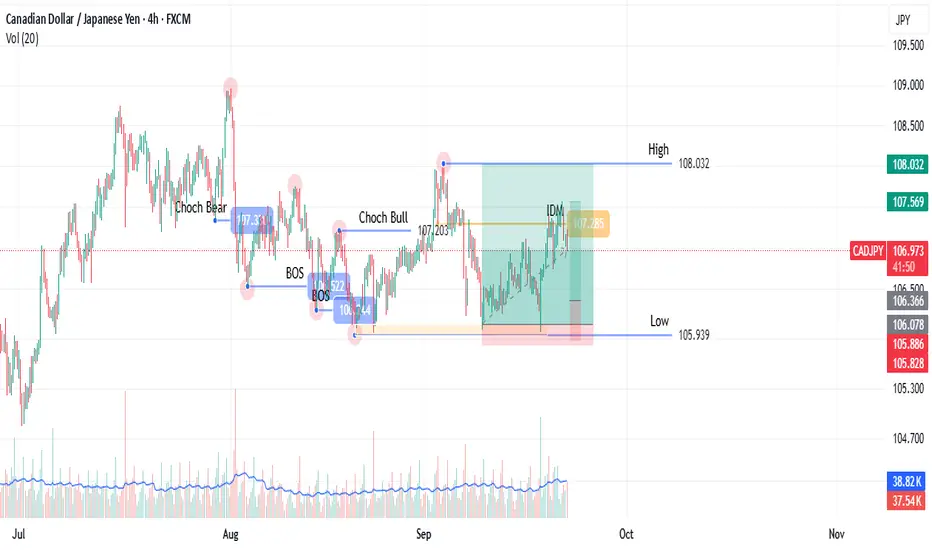
SMC Concept: Defining the Trading Range (Step 1) On CADJPYCAD/JPY, 4H Timeframe (as demonstrated)
This post outlines the first step in a methodology focused on identifying key market structure levels. The goal is to objectively define a trading range, using CAD/JPY as the example.
The Process: Of a bullish Structure
Identify the range Low: Locate the last retracement from the previous high, the low is deepest price level retraced to.
Find the Inducement: Mark the low of the most recent pullback (retracement) before the price made a new high.
Wait for Confirmation: The high is only confirmed once price returns to hit this inducement level. This validates the high as an official range boundary.
A break of the confirmed high is a break of structure (BOS). A break of the confirmed low suggests a change of character (CHoCH), shifting sentiment.
This is the foundational step for identifying future points of interest. The next step involves plotting POIs based on this confirmed range.
This methodology is based on one that I learned from someone else on Youtube, but I have changed many details to suit my style. As a thank you note, I have referred to this person on other paltforms, but unfortunately, I don't think I can do this here as I might be violating this platform's rules.
I will be posting the next steps that would lead to deciding on a trading position on step by step basis.
I am already making videos but I might be using this platforms video option for later posts.
CHF-JPY Will Keep Growing! Buy!
Hello,Traders!
CHF-JPY is trading in an
Uptrend and the pair made
A retest of the horizontal
Support level of 186.000
And a is already making
A bullish rebound so we
Are bullish biased and
We will be expecting a
Further bullish move up
Buy!
Comment and subscribe to help us grow!
Check out other forecasts below too!
Disclosure: I am part of Trade Nation's Influencer program and receive a monthly fee for using their TradingView charts in my analysis.
