Gold 1H – CPI Data Uncertainty Fuels Liquidity Traps at Extremes🟡 XAUUSD – Intraday Smart Money Plan | by Ryan_TitanTrader (19/12)
📈 Market Context
Gold is trading in a tightly engineered range as markets digest the latest U.S. CPI print, which has drawn caution from economists over data reliability and seasonal distortions.
Despite headline inflation showing signs of cooling, analysts warn the data lacks clarity, keeping the Fed firmly data-dependent and USD flows unstable.
This uncertainty-driven backdrop favors liquidity manipulation over clean trends, with Smart Money likely probing both premium and discount zones to trigger stops before committing to expansion.
🔎 Technical Framework – Smart Money Structure (1H)
Current Phase: Rising structure losing momentum near premium supply
Key Idea: Expect liquidity interaction at 4363–4365 (premium) or 4300–4298 (discount) before displacement
Structural Notes:
• Higher-timeframe bullish BOS remains valid but is pausing
• Multiple rejections near highs suggest distribution, not confirmed reversal
• Equal highs above 4360 and sell-side liquidity below 4300 are exposed
• Price is rotating inside a controlled liquidity channel
Liquidity Zones & Triggers:
• 🔴 SELL GOLD 4363 – 4365 | SL 4370
• 🟢 BUY GOLD 4300 – 4298 | SL 4290
Institutional Flow Expectation:
liquidity sweep → MSS / CHoCH → BOS → displacement → FVG / OB retest → expansion
🎯 Execution Rules (matching your exact zones)
🔴 SELL GOLD 4363 – 4365 | SL 4370
Rules:
✔ Sweep above recent equal highs into premium
✔ Bearish MSS / CHoCH on M5–M15
✔ Clear downside BOS with impulsive displacement
✔ Entry via bearish FVG refill or refined supply OB
Targets:
1. 4340
2. 4320
3. 4302 – extension if USD firms post-CPI reassessment
🟢 BUY GOLD 4300 – 4298 | SL 4290
Rules:
✔ Liquidity grab below sell-side lows / channel support
✔ Bullish MSS / CHoCH confirms demand control
✔ Upside BOS with strong bullish displacement
✔ Entry via bullish FVG fill or demand OB retest
Targets:
1. 4325
2. 4350
3. 4380 – extension if CPI skepticism weakens USD
⚠️ Risk Notes
• CPI-related uncertainty increases fake breaks — wait for structure
• No entry without MSS + BOS confirmation
• Expect volatility during U.S. session
• Reduce risk near unscheduled Fed or inflation commentary
📍 Summary
Today’s gold setup is driven by CPI-driven uncertainty and Fed caution, creating prime conditions for liquidity engineering:
• A sweep above 4365 may fade toward 4300–4320
or
• A liquidity grab near 4300 could reload bullish flow toward 4350+
Let structure confirm — Smart Money reacts, retail anticipates. ⚡️
📌 Follow @Ryan_TitanTrader for daily Smart Money gold breakdowns.
Smctrading

Gold 4H – Is 4315 the Smart Money Reload Before 4400?🟡 XAUUSD – Weekly Smart Money Concept Plan
📈 Market Context
Gold starts the new week holding a clear 4H bullish market structure after a decisive BOS from the prior consolidation range. Price is now respecting a rising bullish trendline while consolidating beneath recent highs, suggesting controlled accumulation rather than distribution.
With USD-sensitive headlines and U.S. macro events ahead, Smart Money is likely to engineer a pullback into a discounted zone to rebalance positions before attempting another expansion leg. This environment favors patience and precision, not chasing breakouts.
🔎 Technical Analysis (4H / SMC View)
🟢 Buy Zone: 4316 – 4314
SL: 4306
TP Targets: 4350 → 4380 → 4420+
Rationale:
• Discounted pullback within a strong 4H bullish structure
• Confluence with rising bullish trendline support
• Prior consolidation high acting as demand flip
• Sell-side liquidity resting below 4310 likely to be swept
• High R:R alignment for trend-continuation longs
🔴 Sell Scenario (Conditional):
Only considered if a 4H bearish CHoCH forms below 4306 after a liquidity sweep. Otherwise, shorts are counter-trend and low probability.
⚠️ Risk Management Notes
• Execute only after M15–M30 ChoCH/BOS confirmation — no blind buys.
• Expect stop-hunts and fake breakdowns near London & New York opens.
• Scale out partials at each TP; trail runners only after structure confirms.
• Reduce risk exposure ahead of high-impact USD or Fed-related news.
Summary
Gold remains structurally bullish on the 4H timeframe. The 4316–4314 zone represents a Smart Money reload area where liquidity is likely to be swept before continuation higher.
Patience is the edge this week — let price come to value, let structure confirm, then execute with discipline.
Liquidity leads. Structure confirms. Entries follow.
🚀 Follow @Ryan_TitanTrader for more weekly SMC breakdowns

XAUUSD – Lana prioritizes Buying on the retracement to FibonacciXAUUSD – Lana prioritizes Buying on the retracement to Fibonacci 💛
Quick Summary
Short-term trend: Continued increase
Monitoring frame: H1
Context: Weak liquidity due to upcoming holiday, price has not decisively broken resistance
Strategy: Prioritize Buying, wait for price to retrace to the 50 Fibonacci zone
Market Context
Gold prices continue to maintain an upward momentum and are approaching the historical peak around 4350 USD/ounce. Although it has not completely broken the upper resistance, the upward trend remains strong.
The rise in gold is supported by U.S. employment data showing signs of weakening, expectations of the Fed lowering interest rates soon, and escalating geopolitical tensions, especially concerns related to Venezuela ahead of President Trump's speech.
In conditions of reduced liquidity due to the holiday, the market may fluctuate more slowly, but the main trend still leans towards buying.
Technical View H1
On H1, the upward structure is well maintained. The price is accumulating below a strong resistance zone, indicating the market needs more time to absorb selling pressure.
The 50 Fibonacci zone currently coincides with the support area that reacted strongly yesterday, suitable for waiting for a retracement and then continuing to trade with the trend.
Intraday Trading Scenario
Main Scenario – Buy according to the upward trend
Entry: 4309 – 4312
SL: 4300
TP: 4330 → 4352 → 4390
Lana prioritizes waiting for a slight price adjustment to this zone to enter orders, rather than chasing buys when the price is near resistance.
Trading Notes
Weak liquidity → avoid large orders, prioritize risk management
If the price does not retrace to the waiting zone, Lana is ready to stay out
Observe price reactions at resistance before expecting a breakout
Lana's Notes 🌿
Each setup is just one possibility among many market scenarios. Lana always sets clear stop losses and only trades when the price reaches the planned zone.

XAUUSD (H1) – Gold Trading Plan 12/18 XAUUSD (H1) – Gold Trading Plan 12/18
Wait for CPI to "choose direction" | Break 4355 to Buy, break trendline to Sell
Strategy Summary (understand the plan in 10 seconds)
Before the US CPI data, Gold is likely to hold its price within a range and will only truly "make a big move" when there is confirmation of a structural break. Currently, the price is still following the upward channel, but volume is clearly decreasing → prioritize trading in a break-confirm style, avoid FOMO.
Buy is only valid when surpassing the strong resistance 4355
Short-term sell if the upward trendline breaks
Medium-term sell if the bottom 4306 breaks
Key Levels (important levels according to the chart)
Strong resistance: 4355 (the "door" area for buyers to confirm)
Sell scalping zone: 4354–4355 (short-term reaction area)
Sell zone liquidity: 4392 (liquidity sell area above)
Structural level / important bottom: 4306 (breaking opens the medium-term sell scenario)
FVG / deep liquidity attraction zone: 4248 (target if the market sells off strongly)
Scenario 1: Price Increase (only activated when breaking 4355)
Confirmation condition: Price breaks and holds above 4355 (preferably with a clear H1 candle close).
✅ Buy entry: 4348
SL: 4340
TP1: 4355–4360
TP2: 4392 (sell zone liquidity)
Logic: When volume decreases, false breakouts are very likely. Therefore, only buy when the price surpasses the "directional" resistance area 4355.
Scenario 2: Short-term Price Decrease (prioritize if the upward trendline breaks)
Confirmation condition: Break the lower trendline of the upward channel → sell following the break rhythm.
After breaking, prioritize selling on a retest back to the trendline/near resistance (avoid chasing the bottom).
The first target is usually the liquidity area below around 4306.
Logic: The trendline is the "backbone" of the upward rhythm. Losing the trendline in the context of CPI + weakening volume → the market is likely to have a quick sell-off to sweep liquidity.
Scenario 3: Medium-term Price Decrease (when breaking the bottom 4306)
Confirmation condition: Price clearly breaks 4306.
✅ At that point, prioritize medium-term selling according to the structure.
Expected TP: expand down to deeper support areas, with the FVG 4248 zone being a notable attraction point.
News Context (why "wait for confirmation" today)
The market is waiting for US CPI – inflation data that could change expectations about the Fed's rate cut path, thereby directly impacting the USD and determining the next directional move of XAUUSD. Therefore, today prioritize: wait for a range break + tight risk management.
Risk Management
Maximum risk per order 1–2%.
If SL is hit: stop, wait for re-confirmation (don't revenge trade).
This article shares a perspective and trading plan

Gold 1H – Fed Signals Fuel Liquidity Games Around 4350–4300🟡 XAUUSD – Intraday Smart Money Plan | by Ryan_TitanTrader (18/12)
📈 Market Context
Gold is trading inside a controlled liquidity range as markets react to fresh speculation around the Fed Chair’s stance on rate timing and inflation persistence.
Recent headlines suggest the Fed remains data-dependent despite easing inflation narratives, keeping USD flows choppy and positioning fragile. This backdrop typically favors engineered stop-hunts rather than clean trend continuation, especially around well-defined premium and discount zones.
Smart Money is likely to probe both sides of liquidity before committing to directional expansion.
🔎 Technical Framework – Smart Money Structure (1H)
Current Phase: Rising structure, pausing near premium after BOS
Key Idea: Expect liquidity interaction at 4350–4353 (premium) or 4302–4300 (discount) before displacement
Structural Notes:
• Higher-timeframe BOS keeps bullish context intact
• Recent range shows distribution near highs, not confirmed reversal
• Equal highs near 4350 and sell-side liquidity resting below 4300 are exposed
Liquidity Zones & Triggers:
• 🔴 SELL SCALP 4350 – 4353 | SL 4360
• 🟢 BUY GOLD 4302 – 4300 | SL 4290
Institutional Flow Expectation:
sweep → MSS / CHoCH → BOS → displacement → FVG / OB retest → expansion
🎯 Execution Rules (matching your exact zones)
🔴 SELL SCALP 4350 – 4353 | SL 4360
Rules:
✔ Liquidity sweep above recent equal highs into premium
✔ Bearish MSS / CHoCH on M5–M15
✔ Clear downside BOS with impulsive displacement
✔ Entry via bearish FVG refill or refined supply OB
Targets:
1. 4325
2. 4310
3. 4302 – extension if momentum builds
🟢 BUY GOLD 4302 – 4300 | SL 4290
Rules:
✔ Liquidity grab below sell-side lows / rising trend support
✔ Bullish MSS / CHoCH confirms demand control
✔ Upside BOS with strong bullish displacement
✔ Entry via bullish FVG fill or demand OB retest
Targets:
1. 4320
2. 4350
3. 4380 – extension if USD softens on Fed commentary
⚠️ Risk Notes
• Fed-related headlines can trigger fake breaks — wait for structure
• Avoid entries without clear MSS + BOS alignment
• Expect higher volatility during U.S. session hours
• Reduce risk near unscheduled Fed headlines or speakers
📍 Summary
Today’s gold setup revolves around Fed-driven liquidity engineering:
• A sweep above 4353 may invite a pullback toward 4302–4310
or
• A liquidity grab near 4300 could reload bullish flow toward 4350+
Let structure confirm — Smart Money reacts, retail anticipates. ⚡️
📌 Follow @Ryan_TitanTrader for daily Smart Money gold breakdowns.

XAUUSD – TECHNICAL ANALYSIS ON H1 FRAMEXAUUSD – TECHNICAL ANALYSIS ON H1 FRAME
Lana trades based on liquidity, prioritizing price reactions 💛
Quick Summary
Context: Midweek, gold liquidity is quite weak as holiday sentiment gradually appears
Monitoring Frame: H1
Strategy: Buy at reasonable liquidity zones, sell psychological reactions at resistance
Expectation: No major USD news, difficult to expect strong fluctuations
Market Context
The market is entering a "rest" phase for many traders before the holiday, causing liquidity to decrease significantly. Today, there is no important economic data for USD, so gold is likely to fluctuate within a narrow range and mainly react based on technical factors.
From a macro perspective, recent statements revolving around maintaining a clear distance between the White House and the Federal Reserve show that the market is still very sensitive to inflation control issues. However, the short-term impact is not large, suitable for light and quick trading scenarios.
Technical View H1
On H1, the price is fluctuating around the equilibrium zone after previous fluctuations. The liquidity zones below still play a good supporting role, while above are psychological resistance zones that easily create short-term reactions.
With weak liquidity, Lana does not seek strong breakouts but focuses on price reactions at clear zones.
Intraday Trading Scenario
Main Scenario – Buy based on liquidity
Buy: 4302 – 4306
SL: 4298
This is a price zone with concentrated liquidity. If the price returns and maintains the structure, the possibility of a technical rebound is high.
Alternative Scenario – Sell scalping at resistance
Sell: 4351 – 4355
SL: 4360
This sell order is for scalping, taking advantage of psychological reactions when the price approaches the resistance zone. Not prioritizing holding long orders in the current market conditions.
Trading Notes
Weak liquidity → reduce volume, prioritize quick closing
Avoid expecting large fluctuations when there is no USD news
Observe price reactions at zones, do not enter orders in the middle of the range
Lana's Notes 🌿
Each scenario is just one possibility among many different market scenarios. Lana always prioritizes protecting the account, setting clear stop losses, and is ready to skip if the price does not reach the waiting zone.

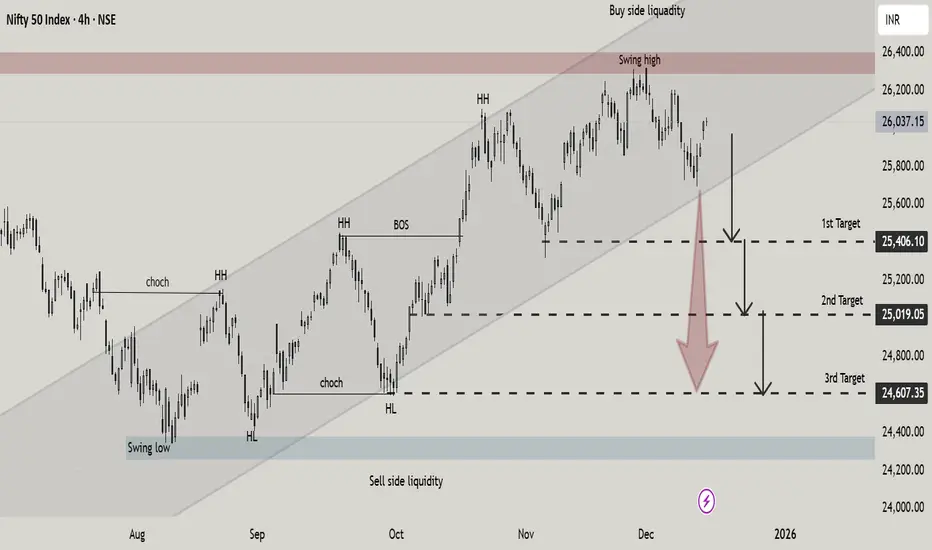
NIFTY 50 Rejection & Downside Targets in Focus NIFTY 50 on the 4H timeframe has reached a key buy side liquidity zone near the upper boundary of an ascending channel. After forming a swing high price shows signs of distribution and potential reversal. A downside move is anticipated toward sell-side liquidity with projected targets at 25,406, 25,019, and 24,607. Bias remains bearish below the recent highs.
#NZDUSD: Three Targets, Swing Buy, Ready For Next Big MoveDear Traders
NZDUSD Chart Analysis SMC+ICT💭📊
🔺The price was rejected at 0.5580, a ‘discounted zone’ price, which was reversed without consolidation or accumulation. The price then moved in an impulse pattern and encountered strong resistance at 0.58320.
🔺A rejection at 0.58320 presents a favourable opportunity for traders to optimise the next significant price impulse. This analysis suggests a potential reversal from 0.5710.
Entry, Take Profit And Stop Loss👨💻📈
🔺 The entry between the blue and red horizontal lines indicates a significant volume zone and can be considered a discounted buying opportunity.
🔺A stop loss can be placed at the red horizontal line or increased based on your own analysis.
🔺We recommend targeting take profit first at the outset. As the price crosses our take profit level, you can consider adjusting the take profit area.
Like And Comment❤️
Team Setupsfx_🏆

GBPUSD Trade SetupMarket:
1. The market bounced from last week's high.
2. Market nearing last week's low.
3. Price entered last week's zone.
Setup:
Buy: 1.33150
TP: 1.33800
SL: 1.32890
RRR: 2.5x
⚠️ Disclaimer ⚠️This journal entry is for educational and documentation purposes only. It does not constitute financial advice or a recommendation to trade. All trading involves risk, and past performance does not guarantee future results. Always conduct your own analysis and consult with a licensed financial professional before making trading decisions.

EURUSD Buy SetupMarket:
1. The market previously broke last week's high.
2. Market nearing zone from last week.
Setup:
Buy: 1.16950
TP: 1.17350
SL: 1.16850
RRR: 5x
⚠️ Disclaimer ⚠️This journal entry is for educational and documentation purposes only. It does not constitute financial advice or a recommendation to trade. All trading involves risk, and past performance does not guarantee future results. Always conduct your own analysis and consult with a licensed financial professional before making trading decisions.

XAUUSD (H1) – Gold Analysis TodayXAUUSD (H1) – Gold Analysis Today
Touching the resistance trendline but the plan still prioritizes Buy (VAL 4303–4306)
Strategy Summary
Gold is touching the resistance trendline and reacting, but currently, there is not enough data to confirm a downward reversal. The immediate plan is still to watch for buying according to the liquidity zone (Volume Profile – VAL), and only "confirm a strong trend" when the price clearly breaks the trendline.
1) Technical Perspective
The price is being "pressed" by the resistance trendline above → easy to shake/wick.
However, the lower area has Volume Profile support (VAL), suitable for a buy strategy based on reaction rather than FOMO in the middle.
The upper area has Strong Liquidity around 4370 → this is a place where profit-taking/distribution forces are likely to appear.
2) Today's Trading Plan (clear entry – SL)
Scenario A (priority): BUY according to Volume Profile (VAL)
✅ Buy: 4303 – 4306 (VAL)
SL: 4295
TP near: 4320 – 4330
TP far: heading to the liquidity zone 4370 if the trendline is successfully broken
Logic: VAL is a "low value" area according to Volume Profile, often attracting buying forces back. As long as the price holds this area, the bias remains buy pullback.
Scenario B: SELL at the strong liquidity area above
✅ Sell: around 4370
SL: 4380
TP: 4330 → 4306 (return to value area)
Logic: 4370 is a Strong Liquidity area. If the price hits this area and cannot hold, it is a very textbook reaction sell signal.
3) Trend Confirmation Conditions
Strong upward confirmation: when the price breaks and closes the H1 candle clearly above the trendline → then buying will be "safer," targeting the upper liquidity zone.
If the price continues to be rejected multiple times at the trendline → prioritize waiting for the price to return to VAL 4303–4306 before buying, do not chase buy.
4) Fundamental Context
CIBC: Weak US employment data may cause the Fed to cut interest rates earlier next year → this factor usually supports gold in the medium term.
Silver prices surpass high levels due to scarce supply + increased demand → the precious metal cash flow is still very "hot," so gold is likely to have strong fluctuations according to liquidity.
Which scenario are you leaning towards today: Buy at VAL 4303–4306 or wait for 4370 to sell reaction?

Gold 1H – Fed Chair Speculation Drives Smart Money Flow🟡 XAUUSD – Intraday Smart Money Plan | by Ryan_TitanTrader (16/12)
📈 Market Context
Gold is trading in a liquidity-driven range as markets focus on today’s hot topic: NFP expectations and Fed rate-path uncertainty.
Recent NFP previews highlight divergence between slowing headline job growth and still-sticky wage components, keeping DXY flows unstable. This environment typically favors stop-hunts and liquidity sweeps rather than clean directional moves ahead of confirmation.
As a result, Smart Money is likely to engineer price into clear premium and discount zones before committing to expansion.
🔎 Technical Framework – Smart Money Structure (1H)
Current Phase: Post-expansion, consolidating after a CHoCH within a broader bullish context
Key Idea: Expect a sweep into premium (4352–4354) or discount (4272–4270) before the next impulsive move
Structural Notes:
• Higher-timeframe BOS keeps bullish bias intact
• Recent pullback reflects distribution/profit-taking, not a confirmed reversal
• Equal highs above 4350 and sell-side liquidity below 4270 are clearly exposed
Liquidity Zones & Triggers:
• 🔴 SELL GOLD 4352 – 4354 | SL 4362
• 🟢 BUY GOLD 4272 – 4270 | SL 4262
Institutional Flow Expectation:
sweep → MSS / CHoCH → BOS → displacement → FVG / OB retest → expansion
🎯 Execution Rules (matching your exact zones)
🔴 SELL GOLD 4352 – 4354 | SL 4362
Rules:
✔ Liquidity sweep above recent highs into premium
✔ Bearish MSS / CHoCH on M5–M15
✔ Downside BOS with strong bearish displacement
✔ Entry via bearish FVG refill or refined supply OB
Targets:
1. 4325
2. 4300
3. 4285 – extension if momentum accelerates
🟢 BUY GOLD 4272 – 4270 | SL 4262
Rules:
✔ Liquidity grab below equal lows / dynamic support
✔ Bullish MSS / CHoCH confirms demand takeover
✔ Upside BOS with impulsive displacement
✔ Entry via bullish FVG fill or demand OB retest
Targets:
1. 4285
2. 4310
3. 4350 – extension if USD weakens post-data
⚠️ Risk Notes
• NFP-related positioning can cause false breaks — wait for structure, not the first spike
• Avoid trades without clear MSS + BOS confirmation
• Expect higher spreads and volatility during the U.S. session
• Reduce risk if entering close to major data releases
📍 Summary
Today’s gold setup is defined by NFP-driven rate uncertainty:
• A sweep into 4354 may invite bearish structure back toward 4300–4285
or
• A liquidity grab near 4270 could reload bullish flow toward 4310–4350
Let structure confirm — Smart Money reacts, retail anticipates. ⚡️
📌 Follow @Ryan_TitanTrader for daily Smart Money gold breakdowns.

Gold 1H – NFP in Control: 4355 Cap or 4260 Hold?🟡 XAUUSD – Intraday Smart Money Plan | by Ryan_TitanTrader (16/12)
📈 Market Context
Gold is trading inside a high-volatility liquidity environment as markets digest the NFP Preview: Rate Path Divergence & Implications for DXY and Gold.
With the upcoming U.S. labor data set to shape expectations for the Fed’s 2026 rate path, USD flows remain unstable. Any surprise in employment or wage components could trigger sharp repricing in rate-cut expectations, directly impacting gold through DXY volatility.
In this context, institutions are unlikely to commit direction early. Instead, liquidity engineering and stop-hunts around key premium/discount zones are favored ahead of true displacement.
🔎 Technical Framework – Smart Money Structure (1H)
Current Phase: Post-expansion, now rotating inside a rising channel and pausing near equilibrium
Key Idea: Expect a liquidity sweep into premium (4353–4355) or discount (4262–4260) before the next impulsive move
Structural Notes:
• Prior BOS confirms bullish higher-timeframe context
• Recent pullback signals profit-taking, not full reversal
• Equal highs above 4350 and sell-side liquidity below 4260 are clearly exposed
Liquidity Zones & Triggers:
• 🔴 SELL GOLD 4353 – 4355 | SL 4363
• 🟢 BUY GOLD 4262 – 4260 | SL 4272
Institutional Flow Expectation:
sweep → MSS / CHoCH → BOS → displacement → FVG / OB retest → expansion
🎯 Execution Rules (matching your exact zones)
🔴 SELL GOLD 4353 – 4355 | SL 4363
Rules:
✔ Liquidity sweep above recent highs into premium
✔ Bearish MSS / CHoCH on M5–M15
✔ Downside BOS with strong bearish displacement
✔ Entry via bearish FVG refill or refined supply OB
Targets:
1. 4325
2. 4300
3. 4285 – extension if momentum accelerates
🟢 BUY GOLD 4262 – 4260 | SL 4272
Rules:
✔ Liquidity grab below equal lows / channel support
✔ Bullish MSS / CHoCH confirms demand takeover
✔ Upside BOS with impulsive displacement
✔ Entry via bullish FVG fill or demand OB retest
Targets:
1. 4280
2. 4310
3. 4350 – extension if USD weakens post-data
⚠️ Risk Notes
• NFP-related positioning can cause false breaks — wait for structure, not the first spike
• Avoid trades without clear MSS + BOS confirmation
• Expect spreads and volatility to expand during U.S. sessions
• Reduce risk if entering close to news releases
📍 Summary
Today’s gold narrative is driven by NFP-led rate path uncertainty:
• A sweep into 4355 may invite bearish structure back toward 4300–4285
or
• A liquidity grab near 4260 could reload bullish flow toward 4310–4350
Let structure confirm — Smart Money reacts, retail anticipates. ⚡️
📌 Follow @Ryan_TitanTrader for daily Smart Money gold breakdowns.

XAUUSD OVERVIEW FOR 12/16XAUUSD OVERVIEW FOR 12/16
Strategy Summary
Gold is holding steady but the main trend is unclear due to a series of strong news today. I will trade in a "wait for confirmation" style, clearly dividing into two scenarios:
Price increase confirmed when breaking above 4320
Price decrease confirmed when breaking below 4271
1) Important price levels on the chart
4320: confirmation point for buyers + resistance/FVG area above
4370 – 4373: strong liquidity area → prioritize waiting for a reaction to SELL
4271: confirmation point for sellers (break support)
Lower area (according to structure/trend line): deep support area where price may react before bouncing back (as per the arrow drawn)
2) Today's trading scenarios (in "trade the level" style)
Scenario A – Price Increase (only confirmed when breaking above 4320)
If the H1 candle closes clearly above 4320, gold is likely to move up to test the liquidity area above.
Priority at this time: watch for short-term BUY according to the rhythm (as per the arrow), avoid FOMO in the middle.
Reasonable target: heading towards the 4370 – 4373 area (Strong Liquidity).
But note: 4370 – 4373 is an area prone to "sell reaction" due to large liquidity there.
Scenario B – Price Decrease (confirmed when breaking below 4271)
If the price breaks below 4271 and the retest fails, the bearish scenario will prevail (consistent with the "sell retest" idea on the chart).
✅ Sell 4271
SL: 4280
Expectation: the price may extend the downward rhythm to deeper support areas according to the structure.
3) Main SELL order at the large liquidity area
✅ Sell entry: 4370
SL: 4380
Logic: This is a "Strong Liquidity" area – where profit-taking/distribution forces are likely to appear. Only SELL when there is a reaction, do not chase the sell.
4) Today's News
Today there is a series of data that could cause gold to swing sharply and sweep both ends:
Average Hourly Earnings m/m
Core Retail Sales m/m
Non-Farm Employment Change
Retail Sales m/m
Unemployment Rate
Flash Manufacturing PMI
Flash Services PMI
My principle: light volume before the news, wait for the market to "reveal its hand" after the news, then follow 4320 / 4271.
5) Risk Management
Do not enter orders in the middle of the noise. Only trade when the price hits the level and there is confirmation.
Question for everyone: Which scenario do you lean towards today — breaking above 4320 or breaking below 4271?

XAUUSD – Lana prefers Sell, Buy is only for scalping XAUUSD – Lana prefers Sell, Buy is only for scalping 💛
Quick Summary
Short-term trend: Downward pressure dominates
Timeframe to watch: H1
Strategy: Sell is primary; Buy is only for short-term, quick trades at liquidity zones
Note: Today there are many US data releases and events, so volatility could be higher than usual
Market Context
The market enters the session with a dense news flow: US President’s speech, unemployment rate, seasonally adjusted non-farm payrolls, and retail sales.
In such a context, gold often experiences strong swings and liquidity hunts before moving in the main direction. Therefore, Lana prioritises selling at higher zones and only buying short-term when the price reaches clear support areas.
Technical View
After the previous upward move, the H1 structure shows that the price is weakening and a continuation of the downtrend is likely.
The upper zone, where short-term resistance converges, is suitable for Sell trades following the intraday trend. Below, liquidity zones may trigger bounce reactions, but Lana considers these only for scalping and does not hold long Buy positions.
Intraday Trading Scenarios
Main scenario – Sell with the trend
Sell: 4308 – 4312
SL: 4320
This is Lana’s preferred zone today. If the price retraces to this zone and shows rejection, the downtrend is likely to continue.
Buy Scenario 1 – Scalping near support
Buy: 4253
SL: 4240
This Buy is only for a short wave, with priority on quick profit-taking when there is a reaction.
Buy Scenario 2 – Scalping at deep liquidity zone
Buy: 4213
SL: 4200
This is a stronger liquidity zone. If the price drops quickly here during news releases, a technical bounce may occur, but Lana still prefers not to hold Buy positions for long.
Session Notes
Asian – European sessions: may see oscillations and technical retracements
US session: can experience strong news-driven moves, sweeping both ends before choosing a clear direction
Each scenario is only a probability, not a certainty.
On high-news days, Lana always reduces position size, sets clear SLs, and accepts skipping trades if the price does not reach the target zones.

XAUUSD H1 – POC 4295 & Fibonacci Sell 4373XAUUSD H1 – POC 4295 & Fibonacci Sell 4373
Strategy Summary
Today, I am not chasing price. The XAUUSD trading plan revolves around two of the cleanest zones on the chart:
POC (Volume Profile) around 4295 to look for BUYs in line with the main money flow.
Fibonacci level at 4373 to look for SELLs when price reaches the premium zone.
Key Levels
BUY zone (POC – Volume Profile): 4295 (major liquidity area)
SELL zone (Fibonacci reaction): 4373
Deeper buffer if POC breaks: 4238 – 4241
Invalidation level: 4191
Scenario 1 – Primary Plan: BUY at the Liquidity Zone (POC)
✅ Buy limit around 4295 (preferably wait for H1 candle confirmation)
SL: 4287 (below the POC zone to avoid noise)
TP1: 4330 – 4338
TP2: 4370 – 4373 (approaching the Fibonacci sell zone)
Logic:
The POC represents the “fair value” or balance point of the Volume Profile. Price is often drawn back to this level to collect liquidity before committing to the next directional move.
Scenario 2 – SELL on Reaction at Fibonacci (Premium Zone)
✅ Sell around 4373 (wait for a reaction or loss of momentum; do not chase the trade)
SL: 4382
TP1: 4338 – 4330
TP2: 4295 (return to the POC)
Logic:
The Fibonacci premium zone is commonly where profit-taking pressure emerges. If price spikes into 4373 but fails to hold, it often provides a textbook reaction sell setup.
Alternative Scenario – If the POC Is Broken
If price breaks below 4295 and clearly closes an H1 candle beneath this level, I will not force buy positions. Priority then shifts to waiting for price to react at:
4238 – 4241, or
deeper towards the lower balance / POC zone.
Always keep in mind that 4191 is the invalidation level.
News Context (to Avoid Being Stopped Out)
Trump has expressed concerns that economic impacts have “not fully filtered through yet”, increasing political risk and market sensitivity.
Comments from Williams (FOMC, New York Fed) on the economic outlook may trigger short-term volatility in USD and yields, leading to sharp moves in gold.
Tip: Avoid late entries during news-driven spikes. Only execute trades when price reaches the predefined zones.
Risk Management
Maximum risk per trade: 1–2%
Do not trade in the middle of the range. Trade only at key levels.
If you are also monitoring 4295 and 4373, share your view:
👉 Are you leaning towards a BUY on pullback or a SELL on reaction today?

XAUUSD – Lana waits for reaction at resistance, focusing on ...XAUUSD – Lana waits for reaction at resistance, focusing on zone-based trading
Quick Summary
Context: The week starts with many high-impact news events. Gold opened with a strong rally and is now approaching a major resistance zone.
Timeframe: H1
Strategy: No chasing price. Priority is to wait for buys at the liquidity void (VL) zone and look for corrective sells at higher resistance.
Expectation: The Asian–European sessions may move sideways, with stronger volatility likely during the US session.
Market Context
The year-end period is typically packed with economic data. Non-Farm Payrolls, CPI, and Retail Sales are all released within the same week, alongside interest-rate decisions from the UK, Europe, and Japan.
For gold, this environment often leads to sharp moves during the US session, while earlier sessions tend to consolidate or make shallow pullbacks as the market waits for news.
Technical View
After a strong rally at the start of the week, price is currently trading around a key resistance area. On the H1 timeframe, the Asian session open left a liquidity void (VL), which is Lana’s preferred area to wait for price to return and look for trend-aligned buy setups.
On the upside, a trendline combined with Fibonacci extension levels is forming a sufficiently strong resistance zone to consider a short-term corrective sell.
Trading Scenarios for the Start of the Week
Primary Scenario – Buy at the liquidity void (VL)
Buy: 4298 – 4302
SL: 4294
This is Lana’s highest-priority zone. If price returns to fill the liquidity void and structure remains intact, there is a strong probability of a bullish reaction in continuation of the broader trend.
Secondary Scenario – Corrective sell at higher resistance
Sell: 4367 – 4370
SL: 4376
This scenario is viewed as a short-term correction when price reaches a strong resistance zone. The sell is counter-trend, so strict risk management is essential and positions should not be held for too long.
Session Notes
Asian – European sessions: price may range and show mild volatility around current levels.
US session: higher volatility is likely, with liquidity sweeps and clearer execution of the outlined scenarios.
Wishing everyone calm and disciplined trading in this news-heavy week.

XAUUSD Wave 5 Completed, Entering an ABC Correction CycleXAUUSD – Wave 5 Completed, Entering an ABC Correction Phase
Weekly Plan Summary
Gold has completed Wave 5 with a very strong impulsive rally and is now entering an ABC corrective phase to complete the Elliott Wave structure.
For the coming week, the primary strategy is to SELL at the Fibonacci resistance zone 4316–4320, then look for BUY reactions at the major liquidity area around 4215.
1) Elliott Wave – Why the Market Is Likely Entering an ABC Phase
The recent rally shows clear end-of-Wave-5 characteristics: strong momentum, long bullish candles, followed by a sharp downside reaction (profit-taking and liquidity withdrawal).
Once Wave 5 is completed, the market typically moves into an ABC correction to rebalance supply and demand and complete a full Elliott cycle.
ABC Structure Based on the Chart Provided
A-leg: Price drops into the 4259–4262 area (first reaction zone of the correction).
B-leg: Price retraces back towards 4316–4320 (the Fibonacci SELL zone on the chart).
C-leg: Price continues lower towards 4215 (POC + major liquidity cluster formed late last week) — this is the primary target of the correction.
2) Key Price Levels
Sell Zone (B-leg): 4316 – 4320 (Fibonacci resistance)
Near Support (A-leg reaction): 4259 – 4262
Mid Support: 4238 – 4241
Main Target / Liquidity Area: 4215 (POC + major liquidity cluster)
Scenario Invalidation Level: 4191
If price breaks below this level, the structure will need to be reassessed.
3) Trading Scenarios for the Coming Week
Scenario 1 (Preferred): SELL at the End of the B-leg
Sell: 4316 – 4320
SL: 4326 (clear break above the sell zone)
TP1: 4262
TP2: 4240
TP3: 4215
Logic:
The B-leg is typically just a corrective pullback within the broader ABC structure. Selling at the Fibonacci resistance offers a far better risk-to-reward profile than chasing shorts mid-range.
Scenario 2: BUY Reaction at the End of the C-leg
Buy: Around 4215 (preferably with a clear reaction)
SL: 4191
TP1: 4240
TP2: 4262
TP3: 4290 – 4310 (if structure reverses and the uptrend resumes)
Logic:
4215 is both the POC and a major liquidity zone, often acting as a “magnet” to complete the C-leg before a new market cycle begins.
Alternative Scenario: If Price Breaks and Holds Above 4320
If price breaks above 4320 and closes clearly on H1 above this level, the ABC correction may be delayed, and gold could extend higher into the next resistance zone.
In this case:
Do not stubbornly hold SELL positions.
Shift bias to waiting for pullbacks to BUY in line with the trend.
4) Fundamental Context – Volatility Likely to Increase, Supporting a Correction Phase
Philadelphia Fed President Anna Paulson noted that rate cuts have “removed some of the insurance” against risks in the labour market.
She also highlighted that while the labour market is under pressure, it has not yet broken. This reinforces a cautious Fed stance, a backdrop in which gold often experiences sharp liquidity sweeps before aligning with its technical structure.

XAUUSD Trend holds wait to re buy on pullbackXAUUSD (H1) — Bullish structure remains intact, waiting for pullbacks to re-buy at key zones
Strategy Summary
Price continues to move in line with the bullish plan. Two buy entries have already been captured, with price advancing by around ~5 points. At this stage, the priority is not to chase price, but to wait for pullbacks into reaction zones to re-enter in the direction of the trend.
1) Trading Plan (H1)
✅ Buy Zone 1: 4262 – 4258
SL: 4250
Rationale: A shallow pullback zone. If price maintains the bullish structure and reacts higher from this area, trend-following buys are preferred.
✅ Buy Zone 2: 4240 – 4235
SL: 4238
Rationale: A deeper pullback (better discount). If price sweeps this zone and then prints strong confirmation candles or a sharp rebound, this becomes a higher-quality buy area.
Projected targets (based on the chart):
Near resistance: 4285
Extended target: 4304 – 4307
2) Fundamental / News Context to Watch
The Fed releases US household financial conditions data (Capital Flow Report, Q3/2025).
Voting FOMC members and Philadelphia Fed President Paulson deliver remarks on the 2026 economic outlook.
The US has threatened to expand the seizure of Venezuelan oil tankers → geopolitical and energy-supply risks may increase volatility, with gold prone to sharp “spike” moves.
3) Technical & Behavioural Perspective
The current structure remains bullish. After a strong impulsive move, the market may require a pullback to rebalance before continuing higher.
The plan remains clear: only buy at predefined zones, no FOMO in the middle of the move.
If price breaks below the zones and H1 candles close beneath the stop-loss levels, the preferred approach is to stay flat and wait for a new structure to form.

XAUUSD H4 Lana Weekly AnalysisXAUUSD (H4) – Lana’s Weekly Analysis: Waiting for pullbacks to Fib 0.618 & 0.50 within major liquidity zones 💛
Higher-Timeframe Trend (D1)
Gold is revisiting its previous all-time high (ATH), but volume strength has not yet been convincing enough to confirm a strong breakout.
Primary Monitoring Timeframe
Timeframe: H4
Method: Fibonacci + trendline + liquidity zones + support/resistance
Plan: Lana avoids chasing price and prefers to look for BUY opportunities at discounted areas around Fib 0.618 and 0.50.
Market Context for the Coming Week
US Treasury yields, especially at the long end, remain elevated, making gold more prone to sharp short-term fluctuations.
Recent Fed commentary continues to reflect a cautious stance, while US political uncertainty may cause gold flows to become less predictable.
For this reason, Lana prioritises trading clearly defined price zones rather than attempting to forecast every short-term move.
H4 Technical Outlook (Medium-Term)
Gold’s current trading range is relatively wide. After a strong impulsive move, the market often needs a “cool-down” phase to rebalance liquidity.
On the H4 chart, the two most important areas align between Fibonacci retracement levels and major liquidity zones, making them suitable areas to wait for pullbacks before continuing in line with the broader trend.
Key Price Zones Lana Is Watching
1) Buy Zone 1 – Fib 0.618 (Preferred)
Entry: 4216 – 4220
Stop Loss: 4210
This is an attractive Fibonacci discount zone and an area where price is likely to react if larger flows step in to support the trend.
2) Buy Zone 2 – Fib 0.50 + Strong Support (Deeper Buy)
Entry: 4171 – 4175
Stop Loss: 4165
This scenario may unfold if price sweeps deeper liquidity before rebounding. Lana considers this a safer entry from a positional perspective, though it requires patience.
Trading Scenarios for the New Week
Primary Scenario – Trend-Following BUY on Pullbacks
Lana prefers to wait for price to retrace into 4216–4220, or deeper into 4171–4175, before entering trades.
If price reacts positively, upside targets will focus on rebounds towards higher resistance zones and the nearest recent highs.
Secondary Scenario – If Price Remains Elevated
If price remains in premium territory with heightened volatility, Lana does not recommend late entries.
Instead, the focus is on observing price behaviour and waiting for pullbacks into the predefined zones for cleaner, lower-risk execution.
Lana’s Notes 🌿
Each setup represents a probability, not a certainty.
Stop losses are always set in advance, with position sizing kept moderate to accommodate gold’s wide volatility.
Gold 4H – Will 4380 Liquidity Cap Price Before a Deep Pullback?🟡 XAUUSD – Weekly Smart Money Concept Plan
📈 Market Context
Gold enters the new week trading inside a well-defined 4H bullish structure, but price is now pressing into a premium liquidity zone where previous highs and resting buy-side liquidity converge.
With USD volatility expected around upcoming U.S. macro data and policy-related headlines, this environment favors liquidity engineering rather than clean continuation. Smart Money typically uses such premium zones to induce late buyers before delivering corrective moves toward discounted demand.
From an SMC perspective, the market is primed for external liquidity raids on both sides before a clearer weekly expansion unfolds.
🔎 Technical Analysis (4H / SMC View)
🔴 Sell Zone: 4380 – 4382
SL: 4390
TP Targets: 4350 → 4320 → 4285 → 4255
Rationale:
• Premium pricing above 4H structure highs
• Buy-side liquidity resting above equal highs
• Likely distribution after bullish leg exhaustion
• Mean-reversion pullback toward internal range liquidity
🟢 Buy Zone: 4233 – 4231
SL: 4223
TP Targets: 4265 → 4300 → 4340 → 4380+
Rationale:
• Discount zone aligned with rising 4H trendline
• Demand mitigation area after prior impulsive move
• Sell-side liquidity sweep expected before re-accumulation
• Favorable risk-to-reward for trend-continuation longs
⚠️ Risk Management Notes
• Wait for M15–M30 ChoCH or BOS confirmation before execution — no blind entries.
• Expect aggressive wicks and stop-hunts near session opens (London / New York).
• Reduce exposure ahead of high-impact USD news and Fed-related headlines.
• Secure partial profits at each TP; only trail runners after structure confirms continuation.
Summary
Gold remains in a 4H bullish framework, but price is currently trading at a level where Smart Money is incentivized to sweep premium liquidity near 4380 before delivering a corrective move into the 4230 demand zone.
The higher-probability play is patience: let liquidity be taken, let structure confirm, then align with institutional flow.
Liquidity first. Structure second. Entries last.
🚀 Follow @Ryan_TitanTrader for more weekly SMC breakdowns

XAUUSD Lana is waiting for a pullback into the Fibonacci ...XAUUSD – Lana is waiting for a pullback into the Fibonacci discount zone, with 4285 as the key decision level 💛
Idea Summary
Main trend: Bullish continuation, although price may retrace into Fibonacci levels before pushing higher
Timeframe: M30
Strategy: No chasing price; Lana waits for price to reach clearly defined buy zones
Key level: 4285 is a strong resistance and a decisive level for the next directional move
Market Context
The Fed is placing significant expectations on rising labour productivity to ease pressure between economic growth, inflation, and the labour market. This keeps expectations for rate cuts next year relatively cautious. For gold, such conditions often result in large price swings, making a zone-based trading plan essential.
Key Price Zones Lana Is Monitoring
4285: Strong resistance, major reaction zone
4265: Short-term target
4245–4248: Fibonacci-based buy zone combined with price imbalance
4210–4213: Liquidity buy zone if a deeper correction occurs
Trading Scenarios
Primary Scenario – Buying on pullback into the discount zone
Buy: 4245–4248
SL: 4240
TP: 4265 → 4285 → 4300
This zone aligns with Fibonacci retracement levels and previous strong price reactions, making it suitable for trend-following buys.
Secondary Scenario – Buying at the liquidity zone
Buy zone: 4210–4213
SL: 4205
TP: 4230 → 4255 → 4285
This represents a deeper corrective move, where price may sweep liquidity before stronger buying interest returns.
Each scenario is only one of many possible market outcomes. Lana always prioritises capital protection, uses clear stop-loss levels, and is comfortable skipping trades if price does not reach the planned zones.
Conclusion
4285 is a level that requires close attention. Strong reactions are highly likely if price approaches this area. A clean break and sustained hold above 4285 could allow the bullish trend to extend towards 4300.
This is Lana’s personal market view.

This week we leave it hereThe week has been overall bullish, but as we know we incurred a lot of losses, that is what we will be educating ourselves and finding solutions for. Instead of being bitter and sad about it, we try to win once more, but this time different, Happy trading.
