BTCUSD - More downside in the short-term (30mins chart analysis)More downside to come for BTC in the short-term. Perhaps relative sideways.
BTC remains below thick orange 200 SMA, and continue to be rejected by the green 50 SMA.
50/200 SMA deathcross registered not too long ago.
Rejected by bearish Ichicloud that appears to still be thickening.
For the bulls, will need to wait for:
For price to first head back above the 200 SMA to advert 50/200 SMA deathcross (DX) on the higher timeframe.
Ichicloud to turn positive again on the higher time frames.
Watching how the weekly candle closes too vs. the trendlines.
PRISM Oscillators Analysis.
Stochs in a downward corrective trajectory..
Negative Snap-Oscillator, which is still heading downwards.
Momentum is accelerating downwards (AJ-ribbon heading sharply down), pulled lower by negative snap-oscillator.
See also my long-term analysis/target:
Zooming Out: BTC is still looking pretty bullish..
Will be healthier if Stoch resets downwards a little, either correction by price or through time (i.e. painfully going sideways, liquidating longs and shorts along the way, over a longer period of time before continuation)..
Snap

More upside potential for AUD vs. SGDBullish w-like re-accumulation patterns..
PRISM Oscillators Analysis
Stoch-of-pRSI in Oversold state atm
Snap-Oscillator pierced into the positive and heading higher.
AJ-ribbon (acceleration/jerk) heading up (in response to the positive Snap-osc), which in turn is pulling the momentum up..
Continuation from my previous analysis awhile back:

Snapchat Long - Back to $25 IPO Open Price To Save The RetailersTwitter got dumped when Trump called them out and it just rebounded like a monster. Snapchat bears looking to take this down at the open but what they don't realize is that they criticized Trump after the close. Trump won't have time to criticize Snapchat after all the backlash that he got. Bears will get squeezed and take us to IPO open price and beyond. Inverse head and shoulders with throwback. If you missed Zoom's inverse head and shoulder with throwback into pump to all time highs then here is your chance to redeem yourself. Enjoy!

SNAPCHATI'm not buying NYSE:SNAP . Waiting for the right Price at the right Time.
Price Action : Support level ; 17.89(+/-1.5%) And key level : 13.43(+/-1.5%).
Thank You!


AMZN: Want to get long here, waiting for <3050 entry. Fundenmentals speak for themselves on this one. The CEO is a monster and the company is a machine. Buying any and everything I can get below 3,000. Good luck!

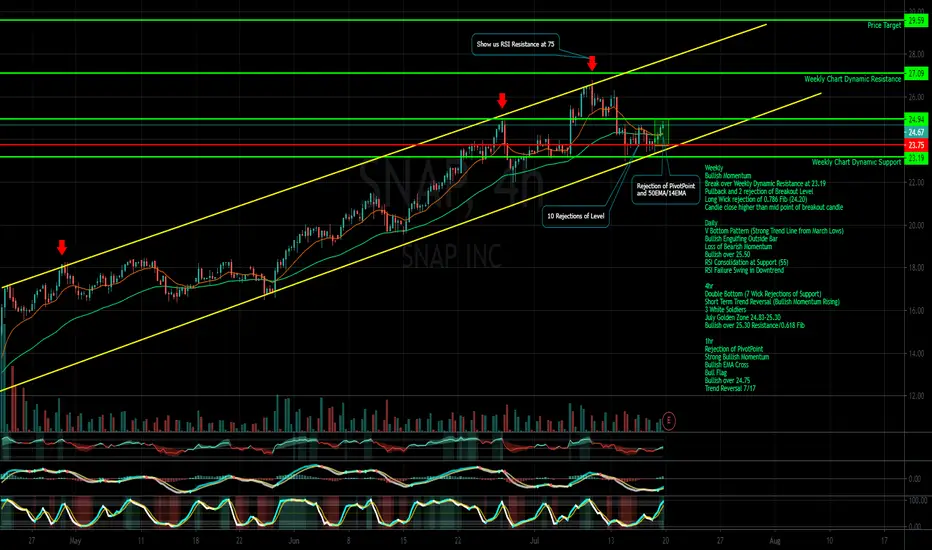
SNAP to test previous support Hey everyone, If you enjoyed this analysis give it a thumbs up or comment your opinion below.
With snap sitting below all major ema's and below the moving average in the Bollinger bands I'm expecting a drop to the down side to test the support.
We can also see the BB starting to coil together which usually indicates a big move one way or the othe,r I'm hoping to short here!


Time for a SNAP-back after earnings today?!Snap shares are up over 50% year-to-date and have tripled from the March low
Any earnings disappointment could see shares return back towards the kind of price gains seen in benchmark and rivals Facebook / Twitter


STRONG SELL FOR SNAPCHATSNAPCHAT IS GOING DOWN.I suggest to get rid of all your position in snapchat you can check my ideas I'm 99% right about the stocks.If you need any help about any stock please contact me i will be glad to help.

SNAP Short playLooking like SNAP is breaking below to next fib level. Could see retest swing before continuing down, but I don't think it is likely.
Will keep updates coming.
Thanks!


OPENING: SNAP AUGUST 21ST 21/30.5 SHORT STRANGLE... for a 1.26/contract credit.
Notes: High rank/implied running into earnings. Looking to take profit at 50% max or otherwise manage on side approaching worthless or side test ... .
Defined Risk Alternatives: August 21st 17/25/25/33 iron fly, paying 4.00 (1.00 at 25% max) (a "stays within expected move" play) or an 18/21/28/31 iron condor, paying 1.05 (.52 at 50% max).

Snapchat's market cap is $36 billion? How?Snapchat is worth $36 billion and they've been burning ~$300 million a quarter for almost 15 straight quarters.
It's kind of impressive at this point.
I think Uber is another company that gets away with this. I would be curious to hear any and all bull cases.

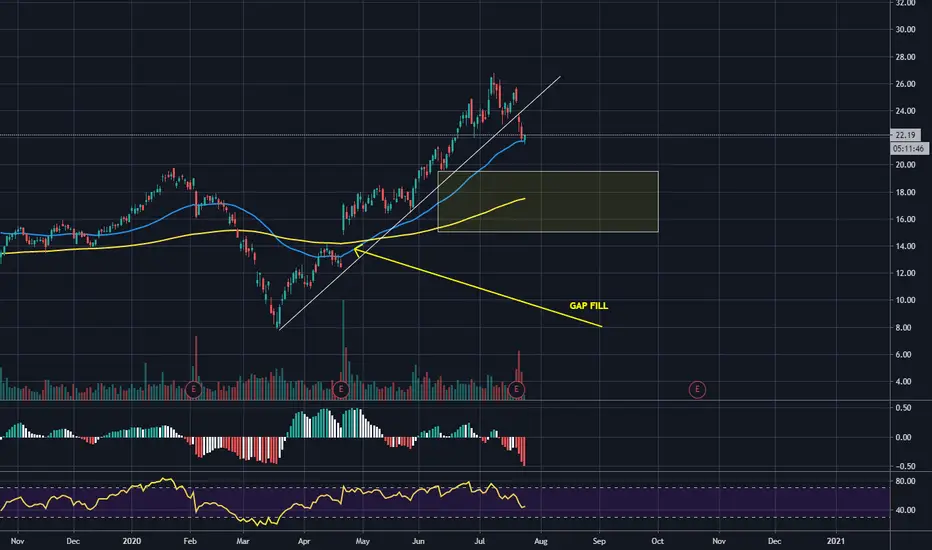
My quick thoughts on Snapchat before earningsThis is one of those stocks that I have always watched and the price action is pretty impressive. It STILL has not taken out its IPO-day highs and it's gone through years or harsh drawdowns followed by v-shaped recoveries. It is has not been an easy stock to hold for anyone long-term.
With that being said, I marked some important levels such as the Volume Profile most significant point of shares traded on a weekly basis since its IPO. I also marked its IPO day highs.
For the bulls to take this to the moon and gain complete control, it seems something has to happen on the fundamental side: positive and growing free cash flow. That means they can continue at their existing rate and reinvest in the company. If not, well, I think it could drop back to the 20s or teens.


No panic we are still in a comfort buy zoneThere is a huge probability that the market will go up to touch the upper green line,
Kind regards,

THE WEEK AHEAD: SNAP, TWTR VOL CONTRACTION PLAYS; GDXJEARNINGS:
Bunch of options liquid underlyings announcing earnings this week:
IBM (27/36/<10%), Monday, After Market Close
SNAP (43/79/18.1%): Tuesday, After Market Close
MSFT (29/38/<10%): Wednesday, After Market Close
TWTR (44/69/15.8%): Thursday, Before Market Open
INTC (24/39/<10%): Thursday, After Market Close
AMZN (70/55/12.5%) (Thursday, After Market Close) and TSLA (48/109/25.4%) (Wednesday, After Market Close) also announce, but options aren't the most liquid here, even though it's tempting to play all that juice in TSLA, with 30-day at 109% and the August 21st at-the-money short straddle paying a 25.4% of the stock price (which has gone parabolic).
From a buck banging standpoint, SNAP and TWTR look to be the potentially most productive for pure volatility contraction plays. Pictured here is an August 21st 20/29 directionally neutral short strangle, which was paying 1.39 as of Friday close. For those of a defined risk bent, consider something akin to the 18/21/28/31, which was paying slightly greater than one-third the width of the wings at 1.10 or a similar setup.
The TWTR August 21st 31/41 was paying 2.06 with a one-third-the-wing-width setup preliminarily being something like the 29/32/40/43, paying 1.21.
Naturally, strikes may have to be adjusted, depending how the underlyings move running into earnings.
EXCHANGE TRADED FUNDS ORDERED BY RANK AND SCREENED FOR 30-DAY >35% AND AT-THE-MONEY SHORT STRADDLE PRICE >10% OF STOCK PRICE:
XLE (28/44/10.3%)
GDXJ (23/55/12.0%)
EWZ (17/44/10.3%)
XOP (15/56/10.2%)
Relative to the past few weeks, volatility has dried up here quite a bit. The August monthly has 33 days left in it, so part of the "not paying" part has to do with duration. My tendency here would be to hold off, waiting until September duration (61 days) comes into range; it's still a little bit lengthy if you want to stick to stuff in that 45 day give-or-take wheelhouse.
BROAD MARKET:
Only IWM (33/37/8.3%) currently has a 30-day in excess of 35%, and that ain't saying much, with the at-the-money short straddle paying less than 10% of the value of the underlying.
IRA SHOPPING LIST/DIVIDEND YIELDERS:
Only EWZ (17/44/10.3%) has a 30-day >35%, along with the August at-the-money short straddle paying >10% of the stock price metric. I've already got a small short put ladder stuck out there (See Post Below), but aren't very tempted to add with the implied being so low within the 52-week range -- in the 17% percentile.