AMPL:BTC long opportunity at 78.6% Fib retracement level.@ 78.6% Fib retracement (~0.000179 BTC)
Green IchiCloud forming.
Higher low set.
Inverse head and shoulder formation emerging again (clearer on the 5min chart).
Have the sell pressure ended?
Buy on confirmation: When AMPL goes above green 50 SMA and holds.
---
PRISM Oscillators Set (Momentum/Acceleration Analysis)
pRSI STOCHS in an oversold state (green background)
pRSI entering Bullish phase again, piercing above its 30 VWMA; supported by hidden bullish divergence.
Snap-Osc (yellow) in the positive, pulling AJ-ribbon upwell into the positive, which in turn have pulled the momentum oscillator up back into the positive again.
Looking at the hourly chart:
Looking at the 3 hourly chart:
Snap

Bullish perspective of BTCUSD (Daily Chart)Main Chart
BTC need to close above this updated dotted yellow trendline to confirm a long.
Long-term Resistance (solid white line) up just above ~10000 USD.
Lossa bullish W-ing like accumulation patterns.
PRISM Oscillator Set
Stochs presently oversold (Green Background)
Red pRSI (Main-Oscillator) resting back to the baseline.
Acceleration/Jerk Ribbon creeping sideways in the positive.
For Altcoins vs. BTC analysis, see:

Altcoin pump ahead? BTC Dominance bearish.BTC.D have fallen below the white dotted support line -- continue to get rejected by the red 21 EMA, and remaining under the green 50 SMA and orange 200 SMA.
PRISM Oscillator signals (red background) Stochs oversold, with (lime/orange) acceleration/jerk (AJ) ribbon plunging into the negative with snap-oscillator (yellow/pink) getting rejected by the 0 line and remaining in the negative.

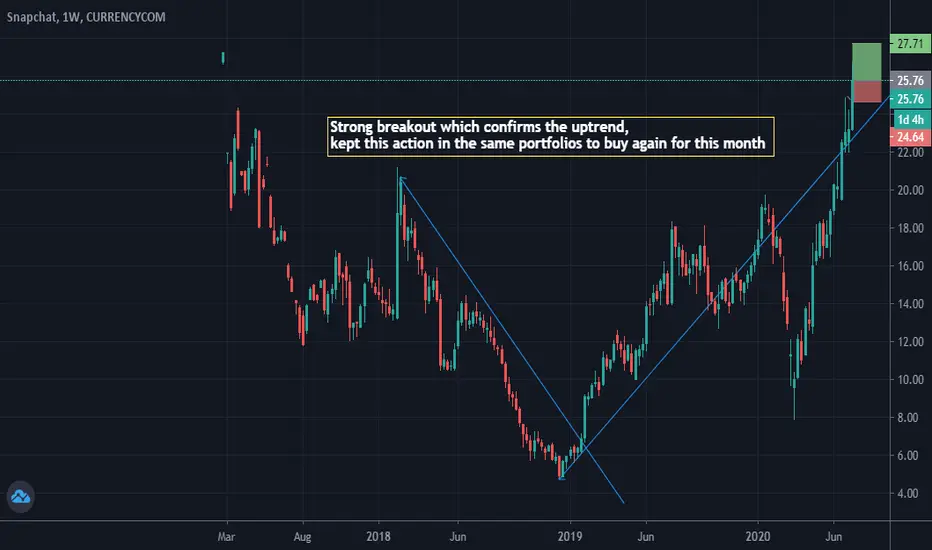
Snapchat trend forecast July 2020a very large increase since 2017, which confirms the upward trend, a very good investment for the next 2 months
Snap possible passHello. Here what I think about SNAP. Friend asked me if we should do something about this stock. It seems like it has upside down head and shoulders now. Which is a bullish reversal sign for long near term. You can see clearly the setup on chart and probably future upside path. 3rd path maybe greater. But for now, I would target $28-29 per share. We will see how much snap made during the quarterly report, I would assume a lot of people were snapping while on lock down. I might get into trade as well. If I would, I would get a month long option here. ( some correlation for quarterly report needed. If it pops, sell the option ). However, my friend buy and sell share, so less risk. Options require timely sell, shares requires time :)

SNAP: at the "make or break" level i was going to close my long SNAP - but on a second look, we're at the critical level from all the way back to the 2017 IPO times .. marked with the red dotted line @ $23.3 ' ish
the chart shows some anxious sellers (non-believers 😊 ?) who preferred to bail as soon as SNAP hit the > $24 levels - but then we saw no follow thru - so in my view, there's a good chance the demand / bulls takes over - and we should get the result of that really soon.
i may be wrong - but if that happens and the longs manage to push above the safety level $24.10, SNAP may be on to a nice breakout and new highs.
will hold the position for now.

Bitcoin breaking out above resistance.Continued analysis from:
Bearish ichicloud that had been acting as resistance have now turned bullish.

BTC:USD - Inverse head and shoulderBTC looks like it is ready to rebound on the hourly.
Confirmed if price breaks out above yellow dotted line.
Bullish PRISM Oscillators signals (Daily Chart):
Stochs Oversold State
S-Osc in the positive.
Acceleration heading into positive, expecting to pull momentum up towards the positive.
Cyber Ensemble Signals (Daily Chart):
Long-term trend of the yellow dotted line:


SNAP vs. TWTRIf you asked me 2 years ago Snap would be outperforming Twitter by 50% I'd say you're crazy..
Always interesting and fun to pay attention to some of these ratios that do not have broad market implications.

Possible Snapchat PullbackWe have reached the new HH on the 1 hour and I am expecting the pullback soon. Shorting here.

#snap - anyone who likes #snapchat @snapchatPlan and Adjustment:
Greetings from Hanover, Lower Saxony
Stefan Bode


$SNAP Showing Signs of Breakout - Advice Needed.Here’s my 1st TradingView analysis. I’m very excited to be learning TA, so here’s what I have. I’d really appreciate it if anyone of you more advanced guys could give me some advice to strengthen my TA.
Thanks!
Feel free to follow me on my journey. From beginner to advanced.
Once again any advice would be highly appreciated.

SNAPCHAT ($SNAP) 👻 | Why Snap is More Tempting than a Cinnabon🐋 ALERT! The SNAP bulls have been giving bears no leeway recently. Not only does the chart look great as SNAP has capitalized on the lockdown, but Snapchat has also been busy improving its ad space and moving to compete with other big tech like Apple and Google (for example with Snapchat's foray into AR).
Let's take a look at some levels to see if SNAP can keep popping off.
Hit that 👍 button to show support for the content and help us grow 🐣
Support:
The S1 S/R flip and S2 orderblock are both equally notable to SNAP bulls. A bounce at or between any of these levels would be a show of strength from the bulls.
While the bulls have the S3 SR flip at the major price pivot point on their side, a test of S3 breaks the bullish market structure and thus makes this level somewhat unattractive at this point (if we get there, we'll have to see how price reacts).
Resistance:
The first point of resistance for the bulls is the R1 orderblock at the failed swing high and S/R flip. It would make sense for us to be rejected here while price consolidates. This would help SNAP to avoid becoming overextended.
The R2 orderblock at the failed swing high range comes into play if R1 is breached. While there are other notable levels higher to discuss if we get there, first things first, a move off of R2 to consolidate onto of R1 first is a perfect move for the bulls to signal continuation higher.
Here is a chart showing where these levels are coming from:
Summary:
SNAP's chart looks great, there is a clear path for the bulls if they want to keep this up. Since that is the case, we expect something similar to what is noted on our chart to play out. Meanwhile, we would be skeptical of any price action that didn't at least interact with our levels. After-all, running too hard and too fast could leave SNAP overextended, while not interacting with support would show real weakness.
Resources:
www.theguardian.com + www.searchenginejournal.com


$NKLA Doubling Price TONIGHT? | Bullish BreakoutNikola and VectoIQ Acquisition Corp. Announce Closing of Business Combination
Speculation on NKLA NASDAQ:NKLA doubling overnight if all goes well with this conference.
Here's Why:
- The combined company's shares to continue to be listed on Nasdaq under new ticker symbol "NKLA"
THIS IS HUGE!
- Nikola raises more than $700 million through the business combination and PIPE, which includes Fidelity Management & Research Company, ValueAct Spring Fund and P. Schoenfeld Asset Management LP
- Raised capital expected to accelerate Nikola's production of battery-electric (BEV) and hydrogen fuel-cell electric vehicles (FCEV)
- Nikola's pre-orders represent more than $10 billion in potential revenue
- Nikola's hydrogen network anticipated to cover North America; set to become the largest hydrogen network in the world
- Nikola adds Stephen Girsky, current CEO of VectoIQ and former Vice Chairman of General Motors Corporation, to its Board of Directors
Do not trade this, I am long on NKLA
DotcomJack

SNAP LongNot a fan of the stock or company, but looks like a great macro accumulation. Will be filling July/August calls for the next week or so. Ideally a massive spike toward $29 to close.

$SNAP $20 Breakout | We Hit ThoseInside the Easy Loot options, we played a Snap $20.5 call expiring June 19th. After yesterdays pump, we sit up roughly 70% up (just wait for the run up). Next target is $21-$22
If you have any questions about Stocks or Options, feel free to reach out.
DotcomJack

Bitcoin bullish outlook.Bullish w-pattern.. Accumulation phase..
Still support above red 21 EMA.
Thick daily green ichicloud.
Golden-cross with positive momentum of the 200 SMA confirmation.
Will sell if gets rejected by the daily 21 EMA + with the pRSI/Stochs/Momentum/Acceleration/.. states of PRISM Oscillators considered.

SNAP: A Technical Approach to Snapchat 1W (Jun. 05)X Force Global Analysis:
Snapchat had its IPO at $17, and started trading at $24 a share. In this analysis, we take a technical approach to SNAP, and explore its bullish probabilities.
Analysis
- The first thing we notice is a massive reverse head and shoulders pattern on the weekly chart
- It could be said that we are currently in the middle of forming the right shoulder
- Within the right shoulder, we have another reverse head and shoulders pattern
- The smaller pattern should be interpreted as a bullish continuation pattern, having completed the head
- The Relative Strength Index is closer to overbought levels, and the Moving Average Convergence Divergence (MACD) also shows decreasing momentum
- Another leg down to complete the right shoulder is necessary for the completion of this pattern
- Combining this with Elliott Wave counts, it could be said that we are seeing an Impulse Wave (12345), starting at the bottom of the smaller head
- A break and close above the neckline would confirm a bullish rally
What We Believe
It's important to note that this analysis is a purely technical approach to the stock. Based on certain confirmations of the reverse head and shoulders pattern, we could expect a bullish rally for the long term.
Trade Safe.

Analyse and predict SNAP Price!SNAP has broke an important resistance .So now it is a support
SNAP will up to the new resistance and if he will break it ,he will touch the sky !!

CardaNO finally to become CardaYES?Break out above significant long term resistance level.
CYBER ENSEMBLE signaled a buy.
50/200 SMA Golden Cross!
PRISM Oscillators Set analysis:
pRIS bullish cross above its 30 VWMA!
Hidden Bullish Divergence
Momentum/Acceleration/Jerk/Snap all positive!
