THE WEEK AHEAD: SNAP, NFLX, IBM EARNINGS; /ZC, /CLEARNINGS:
IBM (63/54) announces Monday after market close.
SNAP (92/102) announces Tuesday after market close.
NFLX (66/70) announces Tuesday after market close.
EXCHANGE-TRADED FUNDS ORDERED BY IMPLIED VOLATILITY RANK/PERCENTILE SCREENED FOR RANK >50/IMPLIED >35%:
XLU (77/47)
GDXJ (77/84)
GDX (67/65)
SLV (66/45)
TQQQ (63/111)
USO (62/112)
XLE (59/70)
EWW (58/54)
EWZ (53/69)
XOP (59/91)
BROAD MARKET EXCHANGE-TRADED FUNDS ORDERED BY IMPLIED VOLATILITY RANK/PERCENTILE:
IWM (72/54)
QQQ (47/38)
SPY (45/28)
EFA (44/31)
EEM (41/36)
FUTURES ORDERED BY IMPLIED VOLATILITY RANK/PERCENTILE:
/ES (44/40)
/NQ (47/39)
/YM (51/13)
/RTY 72/53
/CL (62/130)
/NG (94/71)
/GC (67/27)
/SI (66/43)
/ZC (57/28)
/ZS (33/17)
/ZW (27/31)
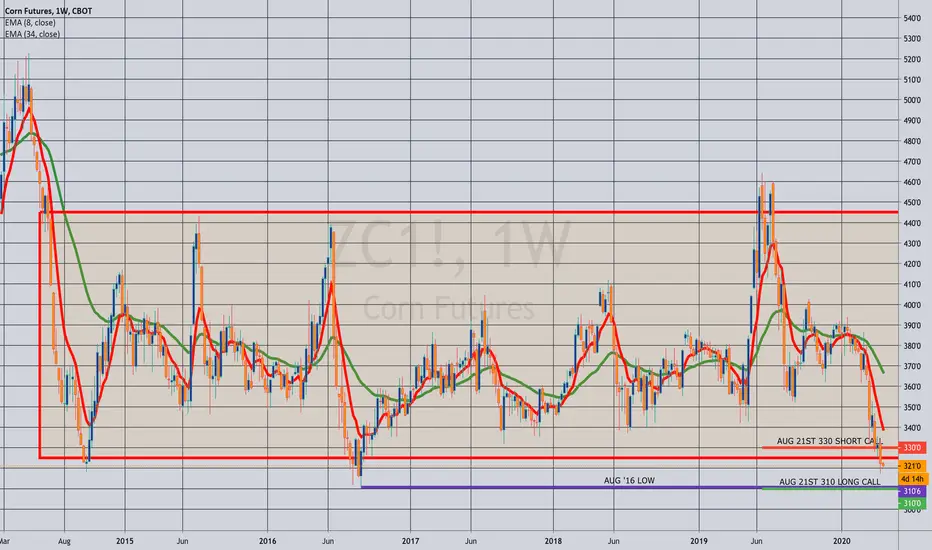
Notes: Pictured here is a /ZC August 21st 310/330 long call vertical, currently trading at 11.25 with a break even at 321.25 versus 321 spot. Ideally, you'd want to put this on with at least make one/risk one metrics, which would occur if the spread priced out at 10.00 even or below. /ZC is tantalizingly close to those August 2016 lows at 310 '06 ... .
Another future worth mentioning here: /CL. As I write this post, the May contract is currently trading at multi-year lows at 15.09, with the June contract trading at 23.66. May drops off this week with the question being how low the June contract will go. I continue to look to sell puts on weakness in the active contract at or below $20.
VIX/VIX DERIVATIVES:
VIX finished the week at 38.15 with the /VX term structure in backwardation.
Snap
SNAPCHAT playA large number of US stocks look prime for a decline technically, and we have earnings data coming out next week.

$SNAP Rising Wedge Into 200D EMA Resistance$SNAP Rising Wedge Into 200D EMA Resistance
Earnings next week likely to be dismal with ad revenue down significantly.
Expect a retest of mid-March low in the near term.
Next week puts (exp 4/24) looking fairly priced. Eyeing $10.00 strike going for about $0.25 or $25.
(Opinion not investment advice)


BTC pierced above the 7238 USD VPVR level! Will it close above?Bullish Scenario playing out in my Apr 06 post in my previous on-going analysis updates .
Note: as explained in a prior published idea, the current ascending channel is drawn as such base on my personal trading preference to ignore the initial equilibration “ringing” after a massive sudden move. I believe it tends to be wise to wait awhile before a clear new market structure form after the previous market structure has been broken.
Previous stances ( posted here ):
QUOTE:
(Apr 05) Right now I am actually neutral in the short term, so long as the red 21 EMA holds. I will only be bearish if the green 50 SMA fails to hold.
The PRISM oscillators indicates a bearish bias atm, however the Snap Oscillator and the AJ-ribbon are only gently sloped downwards, which could also mean a relatively sideways movement, with a very slight drop (perhaps to retest the 50 SMA) before rebounding.
Right now, I am actually slightly and cautiously bullish into the longer-term base on the current market trend. But similarly, for me to become truly bullish, the price will need to break up above the yellow ascending channel, and to clear the 7238 USD VPVR resistance as well and retest it as support.
(Apr 06) The fact that the Sell signal have been triggered on the Cyber Ensemble suggests that it will be difficult for the price to successfully break up higher this time round as well. And if that is the case, the price will likely come back down; and may very likely break below the red 21 EMA, as well as the green 50 SMA with the failed attempt by the bulls -- with the immediate bearish price target of 6100 USD at the bottom of the ascending channel drawn, and hopefully closing and supported above the orange 200 SMA. Setting stop-loss at the 6612 USD VPVR level just below the green 50 SMA to lock in profits accumulated so far just in case.
(Apr 06) If the price falls and closes below even the orange 200 SMA, then BTC will likely follow through with a break down below the yellow ascending channel, marking the start of a more significant and perhaps violent downtrend.
However, as per the above latest chart posted, the AJ-Ribbon looks to be in a strong upward swing, which will likely pull momentum back up into the positive.
This is in conjunction with the main P-Oscillator looking to cross the 21 VWMA really soon as well! I'm cautious slightly biased to the bullish case atm now, but will wait and observe which condition is fulfilled before making my next move.
(Apr 06) BTC had now successfully closed above the yellow ascending channel.
Switching to 4hrly chart where the Cyber Ensemble and PRISM Signals indicators have now have better confluence with the price action, indicating a reduction in volatility.
The bullish/bearish scenarios as described above are as shown.
Moving up to the higher 6hrly timeframe: The AEONDRIFT bands (stdev bands -- similar to the well known Bollinger Bands) have drastically narrowed, indicating reduced volatility; and a possible significant move incoming.
6hrly chart (zoomed out):


SNAP hidden bullish divergenceHidden bullish divergence on snap in which the RSI produces lower lows while price makes higher lows. Very nice buy opportunity even in these rough financial times.

$SNAP long term playWith schools closing nationwide in the US and other countries (although $SNAP) isn't as big international (86% USA usage), the average user per day should increase from 218mil last quarter as well as monthly active users clocked in at 360mil the previous quarter. Last quarter (4q 2019) revenue doubled in advertising so the company was already gaining traction in the demand market for advertisers; expect that number to increase or at least hold. The drop off at these prices show a good risk/reward ratio. Snap has lost 50% of its market value in the past 3 1/2 months, there is a lot of room for upside especially with a likely increase in users and revenue.

#SNAP is projected to hit 25 dollars#SNAPCHAT (#SNAP) 12-month price forecasts for Snap Inc have a median target of 20.00, with a high estimate of 25.00 and a low estimate of 10.00. The median estimate represents a +98.12% increase from the last price of 10.07.

SNAP / CORONAVIRUS LONG/SHORT 3/18/2020SNAP IS A WILD ONE, LOOKING AT THE DAILY THERE IS A GAP NEEDS TO BE FILLED TO THE 0.886 FIB.
BE CAREFUL YALL ITS A CRAZY MARKET RIGHT NOW!!!!


OPENING: SNAP MARCH 20TH 18 SHORT PUT... for a 1.18 credit.
Notes: A "Wheel of Fortune" short put. Run to expiry, either keep the premium or be assigned stock with a cost basis of 16.82, after which you proceed to cover.


SNAP: Possible recovery after today's drop?SNAP
so SNAP shows a 40%+ growth for the qtr (yoy) and a good number of active users (i think it's 280M) - and still drops 14%. chart shows possible recovery on the weekly as it may get support on the 30EMA (blue line).
am i missing something with that ? (i'm long SNAP)

SNAP cup and handle chart pattern with 25% potentialSNAP has created a classic cup and handle chart pattern
All signs point to bullish formation
Two targets ahead, the first with a potential 25% gain
Good luck


SNAP's C&H or H&SNot really sure if Head and Shoulder or Cup and Handle. But likely to be a positive outlook for SNAP. Could make a small correction before going up. Although, may not get to $26 until second half of the year.


Hopefully this chart isnt too complex for yall. boolish af i saw my first titties on snap chat
if this shit doesnt moon then ill be virgin 4 lyfe
i might still be even if it doesnt moon, ha
it looks like a persons head and their shoulders, but kind of upside down
once break that necc, ew it gon be nastybooty
um, thats it

$SNAP: Breakout Past 18? or PullBack to $15.5?This is the 3rd time SNAP is testing the $18 range, if it fails I believe it will fall back into the channel I have charted before eventually testing $18 for a 4th time if necessary

WEAK INDICATORS - BE CAREFULIt's amazing how a stock looking bullish one day can turn negative the next day on no news.
The daily chart...
SNAP stock looks over bought. Accum/Dist & On Balance are trending down.
Stochastic looks over bought.
RSI looks like it's ready to peak.
A few indicators are still in an uptrend.
The Weekly Chart still looks to be in an uptrend.
We think the stock could go either way. BE CAREFUL
BEST OF LUCK & HAPPY NEW YEAR!

ICHIMOKU BREAKOUT ABOVE THE CLOUD - BULLISHSNAP popped up on our ICHIMOKU scan a little while ago as a breakout above the cloud.
From the looks of the indicators, the stock is going much higher.
MACD, RSI and Stochastic are all BULLISH
Daily Chart looks great!
Weekly Chart is BULLISH
WE DO NOT HAVE A POSITION IN THE STOCK. WE ARE WATCHING FROM THE SIDELINES.
We wanted to share the breakout with this board.
Best of luck with your trades!

$SNAP Snapchat EOY 2019, break-out incoming? $SNAPSnapchat inside a ascending triangle, close above $16 = $17
61.8 and 76.8 fib need to be touched.
$SNAP EOY 2019, break-out incoming?
$SNAP EOY 2019, break-out incoming?
____
$SNAP Q4 earnings
3 beats out of last 4
volatile day 100%
beat = +$20
Not financial advice
