QSI: Algorithm's Unfinished Business/Repricing to balance priceNASDAQ:QSI Quantum-Si Incorporated
The recent, deliberate raid below the September lows was the final scene of the second act.
This was not a random dip.
It was a calculated and necessary purge of sellside liquidity.
The algorithm's objective was to absorb the shares of panicked sellers and to trigger the stop loss orders of early, weak-handed buyers.
That objective has now been achieved.
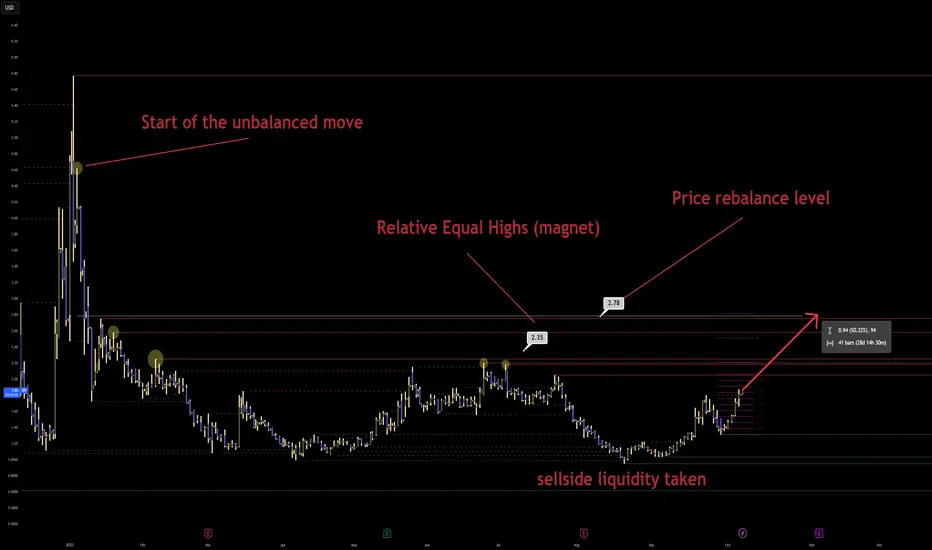
The annotation "sellside liquidity taken" is not a historical note.
It is the starting gun for the third and final act.
With the downside fuel consumed, the algorithm's directive has been re-written.
Its sights are no longer pointed down.
They are now locked on the vast, untapped reservoirs of buyside liquidity resting at higher prices.
The price action is not merely recovering.
It is responding to a new, clear, and institutionally sponsored mandate.
The path of least resistance has been fundamentally altered.
The question is no longer if the price will rise.
The only question is how violently it will do so.
You have correctly identified the key landmarks on this new map.
The "Relative Equal Highs" at 2.35 are not a ceiling.
They are a luminous, magnetic target.
This level represents a giant pool of buy-side stops from traders who shorted the previous rallies.
Their fear is the algorithm's fuel.
Their pain is the algorithm's profit.
This is the first, most obvious draw on liquidity.
It is a place the algorithm must visit.
But it is not the final destination.
It is merely a waypoint on a much grander journey.
The Critical Vector is to understand the true, ultimate objective of this entire price campaign.
The algorithm is a creature of efficiency and balance.
It abhors a vacuum.
The annotation "Start of the unbalanced move" points to the single most important event on this entire chart.
That massive, vertical price spike in early 2021 was not just a rally.
It was the creation of a profound and violent pricing inefficiency.
It was a causal scar.
It left a massive informational void in its wake.
The entire year and a half of subsequent price action, including the recent purge of sellside liquidity, has been a single, extended process of accumulating energy.
It has been the market coiling a spring.
Now, the spring is being released.
The purpose of this release is to return to the origin of the crime.
The algorithm is compelled to return to that zone of imbalance to rebalance its books.
Your annotation "Price rebalance level" at 2.78 is not just a target.
It is the point of cosmic justice for this instrument.
It is the level at which the story that began in 2021 finds its logical conclusion.
The path is clear.
The current rally is the initial assault.
It will first target the Relative Equal Highs at 2.35.
This will be a violent move, designed to induce a short squeeze and create a state of maximum FOMO.
Expect a minor consolidation or retracement after this level is purged.
This is the algorithm shaking out the last of the weak hands.
It is the final opportunity to get on board before the true repricing begins.
From there, the algorithm will have a clear and unimpeded path to the ultimate objective.
The final, explosive leg of this rally will target the Price rebalance level at 2.78.
This is the primary, institutionally sponsored destination.
It is the point to which all price is currently being drawn.
The Ascendant Principle is that you must learn to read a chart not as a two-dimensional history of price, but as a three-dimensional ledger of algorithmic debt and credit.
Every violent, one-sided move creates a debt on the algorithm's books.
This is an imbalance.
It is an inefficiency.
It is a promise that must eventually be kept.
The larger and more violent the move, the larger the debt.
The massive, unbalanced spike from 2021 was the algorithm taking out a colossal loan of inefficiency.
Every subsequent price swing, every consolidation, every liquidity purge, has been the algorithm meticulously gathering the resources needed to repay that loan.
The purge of sellside liquidity was the final payment on the interest.
It was the signal that the algorithm now has the capital and the mandate to settle the principal.
The "target" is not a guess.
It is the location of the creditor.
The price is not "going up".
It is being recalled, with gravitational force, to the scene of its original level.
When you understand this, you stop predicting.
You start seeing the inevitable.
You see the chart as a narrative of cause and effect playing out over vast stretches of time.
The cause was the imbalance.
The effect will be the rebalancing.
The Relative Equal Highs are simply the last gatekeeper before the final, violent settlement of this ancient, algorithmic debt.
You are not chasing a rally.
You are witnessing the final chapter of a story that was written years ago.
The ending has already been decided.
The only variable was the timing.
The purge of sellside liquidity has now confirmed that the time is now.
The alternative path would likely have led to viewing the Relative Equal Highs as "resistance" to be sold, an error that fails to comprehend the true, long-term objective of the price delivery algorithm.
For educational purposes only.
Speculativebuy
INJ/USDT Speculative TradingWe are considering a speculative trading idea on the INJ/USDT coin pair.
Since the beginning of December 2023, there has been a noticeable increase in the asset, starting from the $16 level and reaching a maximum of $45. This growth amounted to more than 179%, indicating high interest in the asset from buyers.
However, after reaching the $45 mark, the asset underwent a correction, decreasing to the $29 level. During the correction, there was a false crossing of the 200-day moving average, followed by a sharp increase. The second touch of the $45 level occurred on January 9, forming a resistance level, indicating the significance of this level in the current context.
Considering the current trend, we can predict that the asset will consolidate near the resistance level at $45, with a subsequent breakthrough and establishment of the price above this level. In this case, there is a possibility of opening a long position on the asset upon retesting the $45 level and then holding the asset until the price reaches around $54, which could provide additional profit opportunities of around 20%.

USDT/DOT Speculative Trading IdeaBelow is a speculative trading idea for the DOT/USDT pair.
Currently, the asset's price has broken through an inclined level after updating the minimum at the price of $3.550 within the current global downtrend. After reaching the $3.550 level, there was a rebound, amounting to over 41% to the current price. This situation indicates an attempt to break the local downtrend in effect in 2023.
As we anticipate a price correction, we identify two entry points for the asset to continue the upward movement within this correction.
We place our first limit orders to buy DOT at price levels of $4.550 with a growth potential of 37% to the price level of $6.273.
We place our second limit orders to buy DOT at price levels of $4.220 with a growth potential of 50% to the price level of $6.273.

USDT/BTC Speculative Trading IdeaBelow is a speculative trading idea for the BTC/USDT pair.
As of writing, there’s a consolidation and price chart compression towards the established local resistance level at a price of $35,195, following an impulsive 31% price increase from $26,794 with a rebound from the 50-day moving average.
Within the framework of this idea, we propose to consider the possibility of buying BTC at a price of $35,195.
We do so with the aim of continuing the BTC price rise towards the resistance zone located near the POC volume level, corresponding to the trading range of the first half of 2022. The approximate target for this trade is $38,440.
An additional factor supporting this decision is the cumulative delta, indicating sustained buyer interest. The potential for this trade is estimated at 9%, with a stop-loss set at the 3% level, which amounts to $34,100.

BNT/USDT Speculative Trading IdeaBelow is a speculative trading idea for the BNT/USDT pair.
As of writing, the asset's value has decreased by more than 50% after a strong growth of 240%. The asset meets our expected indicators and reaches a high of $1.9546 .
We decide to acquire the asset at the current price of $0.8426. The 50-day moving average serves as support. A decrease in seller activity is also noted, and the price is being held by buyers according to the cumulative delta. The volume profile also reflects market participants' interest in this asset at this price level.
The first target of our trade is to reach the mirror level at $1.0500, with a profit percentage of over 20%. Upon reaching this level, we plan to close the majority of our position, which will be 80%.
The second target, intended for the remaining 20% of the position, is to reach a price of $1.2163 in the event of a breakout of the mirror level. The expected profit at this stage will be over 40%.

Take-off for Lockheed Martin?Speculative long trade. Price is being supported by
SMA 30 + 50 and EMA 50
50% fib retracement
prior local high
seasonality is rather bullish in the 1st half of this year
global situation seems to demand rather the products by LMT

EOLS - Speculative opportunity 3:1Coming out of a 3 month consolidation. Volume extremely light on the latest pullback, signs of supply has dried up.
You don't need to know what's going to happen next to make money ~Mark Douglas
Lose like a pro and keep trading, or lose like a novice and quit ~Mark Ritchie

Buy Domino's 🍕???Technicals
We're now at the 38.2 % Fib retracement, which would be an excellent correction in a bullish trend.
We have been in the big picture for over ten years in a bullish trend. So the underlying trend may continue.
Concerning the last 15 years, we have a robust bullish seasonality in Domino's Pizza. From the 24th of Feb until the 12th of May, only one year returned with a negative result in the given period.
All other technicals are somewhat bearish.
Others? I think that even when the economy collapses - people will still eat pizza (and order them ;) ).
So I'm positioned long in this stock. It's a speculative position - I don't know if the correction was big enough; otherwise, we will see 395 or even 355 USD prices before it goes up again.

$IGV wait for confirmation (3/5)Conviction: 3/5
Better to wait until we break above downtrend resistance line, but overall looks strong
seemed to bounce off 100WMA
RSI-W at historical buy points
bounced off (for now) 50% retracement
RISKS
Very expensive relative to historical trend

$NFLX at critical level (3/5)Conviction: 3/5
Bouncing around channel since end of 2018
RSI-W at oversold levels, although another leg down for bullish divergence is not out of the question
Still relative expensive... especially at a time when investors value value

$ROKU near heavy entry (3/5)Conviction: 3/5
Should probably wait for better entry around bottom support (4/5)
General Thesis
Weekly RSI good entry level
Daily RSI bounced off oversold, could still become bullish divergence with a lower low
bounced off near-term (2017) support trend line since inception
Growth
Gross margins (45%) is pretty steady the last few years, at all time highs
Revenue growth (50%) around historical average, down from 2020 pandemic highs
Value
P/S below average, looks like about historical median
P/FCF is very high (156), but about around mid-range of history
Fundamentals & Balance Sheet
quick ratio very attractive
Potential Risks
history is quite short, unclear how it will behave during recession
Daily RSI could spike down to oversold area some more
Historically no bullish divergence on weekly RSI before bounce

WNW from $160 to $2.09Wunong Net Technology Company Limited Changed its name to Meiwu Technology Company Limited
Xinliang Zhang, CEO of the Company: “The Company’s new name better reflects the Company’s international business line beyond its Wunong Net business as a global high-tech internet trading platform with a global commodity chain and the comprehensive services such as online consultation, display, sales and after-sales services. We are excited about our development in this new chapter.”
This is a speculative buy.

UURAF - Rare Earth Element Prospector CompanyMining, especially Canadian has been in panic sell zone for past week, while some stability returns to the market and likely more cash stock owners.
UURAF speculates in rare earth elements, which if Foxconn builds in So. Dakota they'll need domestic sources and UURAF owns some IP for extraction
and will license. Low interday of 0.081 and now at 0.09 to close the week. Watching 1/3 in.
UURAF
Big mining stocks, diversified metals:
RIO
RHP
CCJ
DNN
Iron Ore:
CLF
Copper:
SCCO

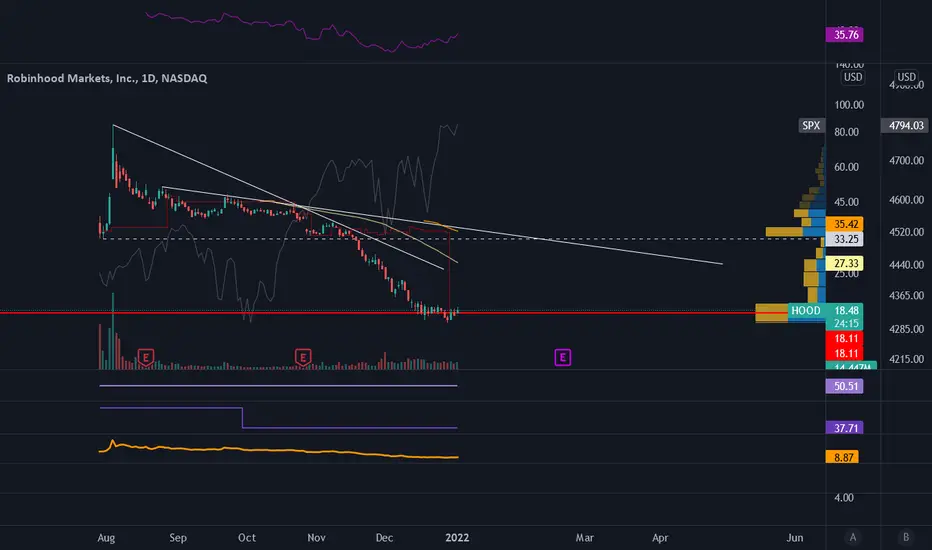
$HOOD potential bottom (1/5)Conviction: 1/5
early trade: no confirmation of bottom yet
General Thesis
daily RSI showing bullish divergence, bouncing up from oversold levels
Value
P/S at historical lows although high compared to rest of market
Potential Risks
history is very short
$TDC breakout and retest! (3/5)Conviction: 3/5
General Thesis
Weekly RSI looks is attractive but likely to go lower
Daily RSI turning up from oversold positions
breakout from 2012 down trend resistance, could be the start of a leg up!
target $60
Growth
Gross margins (57%) is pretty steady, at/near historical highs
Revenue growth (1.32%) around 75th percentile
Value
P/FCF below average (40th percentile)
P/S below average as well (25th percentile)
Fundamentals & Balance Sheet
quick ratio good (~1), although trending down
Potential Risks
short history
quick ratio has been deteriorating sincepeak in 2017
price could continue to move down trend line
stop loss at recent trough: $40

THAILAND SET: PTTGC - SPECULATIVE BUY TP1 - 67.50 STOPLOSS 63.00THAILAND SET: PETROCHEMICAL SECTOR | PTTGC
CURRENT PRICE: 64.50
BREAK OUT VOLUME POINT OF CONTROL: 63.00 and previous high
Reasonably good buy position for speculative TARGET PRICE 1 @ 67.50 (5.4%) at mini Wave 5 position.
Stop Loss: 63.00 (current POC)
>Strong Foreign fund flow (NVDR) - hit the highest daily chart at +450 mil baht / day
>Strong Banker fund flow
>RSI almost hit overbought, still have room to go further
RECENT NEWS UPDATE: PTTGC announces the end of the share repurchase program, totalling 22.30 million shares, receiving 1.35 billion baht. To increase financial liquidity

Speculative stock SHLL +29% upside2020 is the year of speculation and as a sensible investor, I've sat out almost all of it but have also missed a tremendous upside in many companies.
Not using indicators on this one.
Just using robinhooder confidence, youtube algorithm and EV rush as my indicators. Completely against my investment but this is a YOLO trade.
Entry: $27.42
TP1 : $34.5
SL : $24.4

$I Is A Speculative Buy $I has absolutely decimated its shareholders over the last few months. The latest news is there's a bipartisan Senate bill proposes limiting the payout to companies looking to monetize C-band spectrum.
The bill would set up a $6B fund to pay expenses and incentives to vacate the bands.
But the C-Band Alliance (led by Intelsat and including SES (OTCPK:SGBAF)) has said the airwaves could be worth up to $77B and calls for spectrum holders to receive "fair value."
Intelsat (NYSE:I) is down 5.9% in after-hours trading, and finished the day down 7.8%. Its shares also fell in November when FCC Chairman Ajit Pai called for a public auction of the C-band airwaves, rather than private auction preferred by companies.
While all of this is negative, what caught our eye is traders bought the dip off $2.72. $I closed the day with a green candle. That's a bullish sign. While we won't load the boat, $I could be a nice trade with proper risk management.
As always, trade with caution and use protective stops.
Good luck to all!

$CHWY Is A Speculative Buy$CHWY is a speculative buy. We are labelling it as speculative because of all the unicorns that have IPO'd this year and have performed horribly. However, a number of people are coming out and saying that the stock is interesting, including Whitney Tilson and Credit Suisse.
Credit Suisse thinks Chewy's (NYSE:CHWY) revenue momentum will translate into profitability down the road.
The firm notes that shares currently trade at only 1.6X the 2020 EV/sales estimate, which it calls a "de minimis premium" to its $22 listing price and a "notable discount" to a broader peer group of e-commerce retail platforms (4.6X), animal health products and services (3.4X), as well as healthcare IT services companies (3.7X). The analyst team says the Chewy share price doesn't fully reflect the rapid growth trajectory and longer-term profit opportunity.
CS has an Outperform rating on Chewy and price target of $29.
In recent trading action, there were concerns over lockup expiration.
Shares of Chewy (NYSE:CHWY) are up 5.22% on the day and are now 17.21% higher over the last five sessions.
On the positive side of the ledger, William Blair was out with positive comments today and The Wall Street Journal's Heard On The Street column maintains that the 1.7 forward sales multiple on Chewy is not unreasonable for a rapidly growing company.
Perhaps most importantly, the expiration of the Chewy IPO lockup period hasn't created a wave of selling today.
Chewy, Inc., together with its subsidiaries, engages in the pure play e-commerce business in the United States. The company provides pet food, pet products, pet medications, and other pet health products for dogs, cats, fish, birds, small pets, horses, and reptiles through its chewy.com retail Website, as well as its mobile applications. It offers approximately 45,000 products from 1,600 partner brands. The company was founded in 2010 and is headquartered in Dania Beach, Florida. Chewy, Inc. is a subsidiary of PetSmart, Inc.
As always, use protective stops and trade with caution.
Good luck to all!

Triggered on GBPCHF - Video on why we bought this levelFX:GBPCHF , OANDA:GBPCHF , SAXO:GBPCHF
Here is a video on GBPCHF. We posted a buy idea on the pair this morning (see the related idea).
Just a quick run through on the reasoning behind it and why we thought it was a decent speculative trade to have a look at today.
Feel free to comment if you have any questions or would like to discuss anything.
Full details of the trade can be found on our wall or in the related idea link.
