in short... Short SPOTTechnically we are in a distribution phase.
Price battling around 50MA, once it fails it gonna test 200MA and bounce a little but gonna continue slide further more
Target 1 - 600
Target 2 - 500
Stop Loss - 760
No wonder if it goes further down to 400 or 300, we'll revisit this later.
Spot

SPOT BREAKOUT ALERT - RED/USDT📈SPOT BREAKOUT ALERT 📈
BME:RED is up average +65% today, but I think bulls could push price much higher!
Quick stats:
✅ $2.4B+ TVL, 300k+ users
✅ Live on Binance Loans
✅ Integrated with 50+ protocols, securing 25+ DVNs
✅ Kelp: 2nd largest LRT on ETH
✅ Leading staking infrastructure on BNB Chain
Currently, I expect to see a short term bearish correction before to see a next big move upward!
Key demand zone:
0.570 - 05800 & 0.5300 - 0.500$

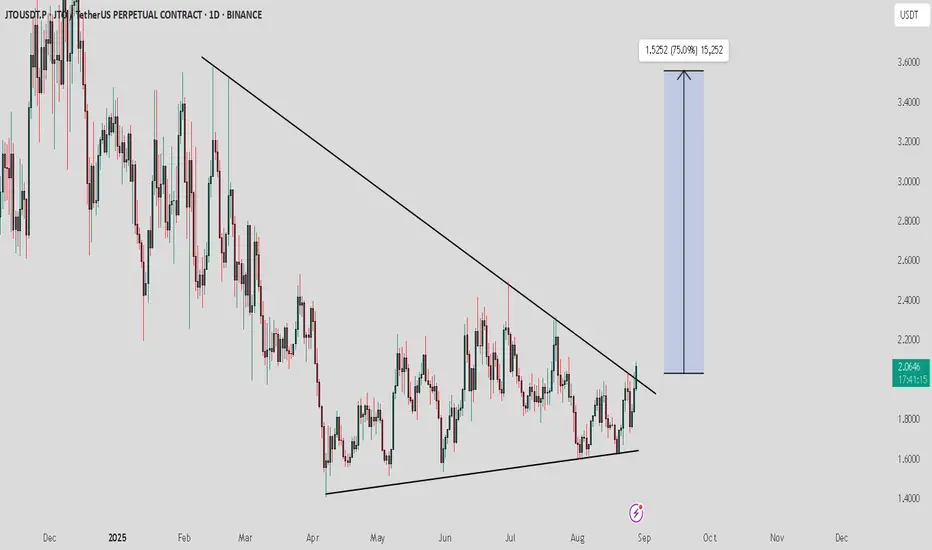
JTO / USDT : Breaking out from symmetrical triangleJTO/USDT is breaking out of a symmetrical triangle pattern. If this breakout sustains, we could see a strong bullish rally toward the $3 – $4 zone.
Recommendation: Spot buying is favorable here — enter after confirmation and consider holding for midterm gains. Always manage risk wisely.

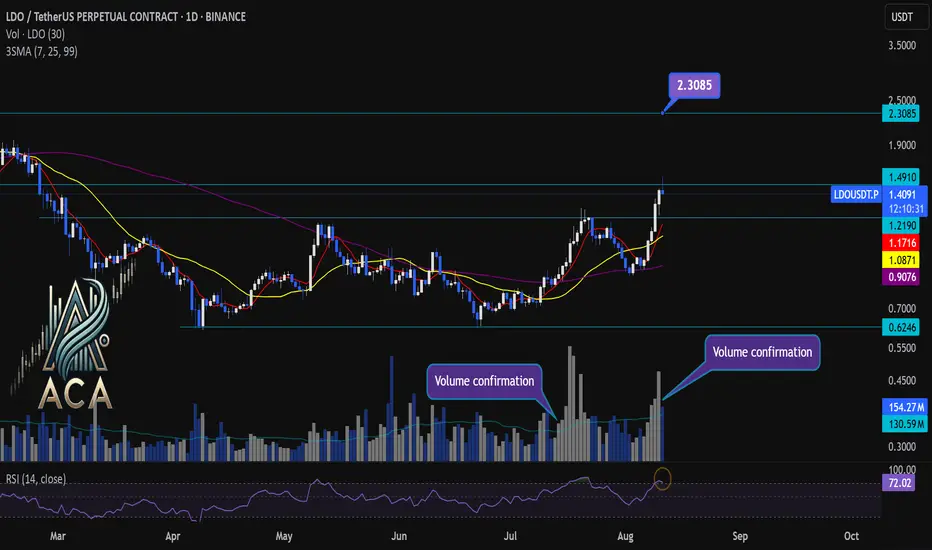
LDOUSDT Daily Chart Analysis | Strong Momentum BuildingLDOUSDT Daily Chart Analysis | Strong Momentum Building
🔍 Let’s dive into the LDO/USDT perpetual contract and analyze the latest price action, highlighting a powerful bullish setup and key technical signals on the daily chart.
⏳ Daily Overview
The daily chart reveals a strong surge in momentum as the price breaks out of its recent range, accompanied by a decisive uptick in trading volume. The 3SMA setup (short-term, mid-term, and long-term moving averages) is aligning bullishly, marking the beginning of a strong uptrend.
📊 Key Highlights:
- RSI (14) is entering the overbought zone (currently at 73.39), reflecting surging buyer demand and intensifying momentum.
- Price has broken out of the range box with elevated volume, confirming the move.
- Multiple volume confirmation spikes signal conviction behind the breakout.
- Immediate resistance is being challenged; the next key target to watch is $2.3085.
- For continued upside, we must see a daily candle close with solid volume above the current resistance level.
🚨 Conclusion:
Momentum is clearly accelerating on LDOUSDT, supported by volume and moving average bullish alignment. If price closes above resistance with strong volume, a continued rally toward the $2.3085 target is likely. Keep an eye on RSI levels and volume for further confirmations as this trend builds!

THE RESULTTHE RESULT
Follow for more Simple And accurate swing analysis on Indices, Currency, Commodities.

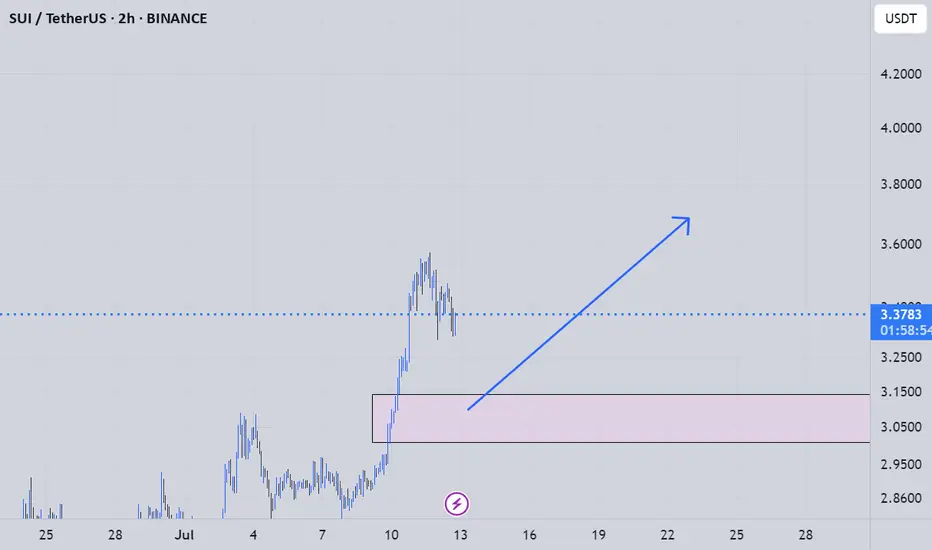
suiusdt long analysyou can use this analys for your spot trades its a longsetup for making a good profit and a getting on a big trend
SPOT Weekly Options Trade — June 15, 2025🎧 SPOT Weekly Options Trade — June 15, 2025
💡 Ticker: SPOT
🎯 Strategy: Bullish Swing — Call Option
📅 Expiry: June 20, 2025
⏱ Entry Timing: Market Open
📈 Confidence: 70%
🔍 Analysis Summary
All four models (Grok, Llama, Gemini, DeepSeek) indicate strong bullish momentum on SPOT based on:
✅ Above all key EMAs (5-min and daily)
🔁 Bullish RSI, MACD, and Bollinger Band alignment
📢 Catalyst: Evercore ISI upgrade to $750
📊 Notable call open interest in OTM strikes
⚠️ Max Pain: $665 — a known drag, but outweighed short-term by momentum and the upgrade catalyst.
✅ Recommended Trade
🛒 Trade Type: Long CALL (Naked)
🎯 Strike: $740
💵 Entry Price: ~$4.25
📅 Expiry: June 20, 2025 (Weekly)
📈 Profit Target: ~$8.50 (100% gain)
🛑 Stop Loss: ~$2.10 (50% loss)
🔍 Why $740? It's the sweet spot between DeepSeek’s speculative $780 and Grok's expensive $725—offering leverage with decent odds.
⚠️ Risks & Watchouts
🧲 Max Pain gravity at $665 — may cap gains closer to expiry
📉 Rejection at $714–$718 resistance range
🌪 Elevated VIX = potential for wide intraday swings
📏 Stick to small sizing (risking <2% of portfolio) due to premium volatility
🎯 Bottom Line: Strong bullish setup, solid catalyst, and technicals support a move higher. Enter on strength near open, manage tightly, and take profits on a double.

WIF 4H. Make or Break ZoneBINANCE:WIFUSDT The asset is still moving within a defined range and is now brushing against the lower boundary of its structure. This area has historically triggered buyer interest — and if that repeats, we could be looking at a recovery toward $0.97+ in the short term.
However, failure to defend this support could send price cascading down to the $0.58–$0.60 zone.
Given the ongoing uncertainty in global markets, especially due to rising geopolitical tension, any long positions should be executed with tight risk management and a hard stop-loss.
Entry range (EP):
• Market
• $0.8120
• $0.7790
Take-Profit targets (TP):
• $0.8880
• $0.9425
• $0.9765
I’m managing risk carefully and limiting exposure per trade to no more than 2% of my portfolio. This is my personal trading log and not financial advice — always DYOR and trade responsibly.
Let the market decide — I'm prepared either way.
Stay sharp. Stay safe. 🧠📊

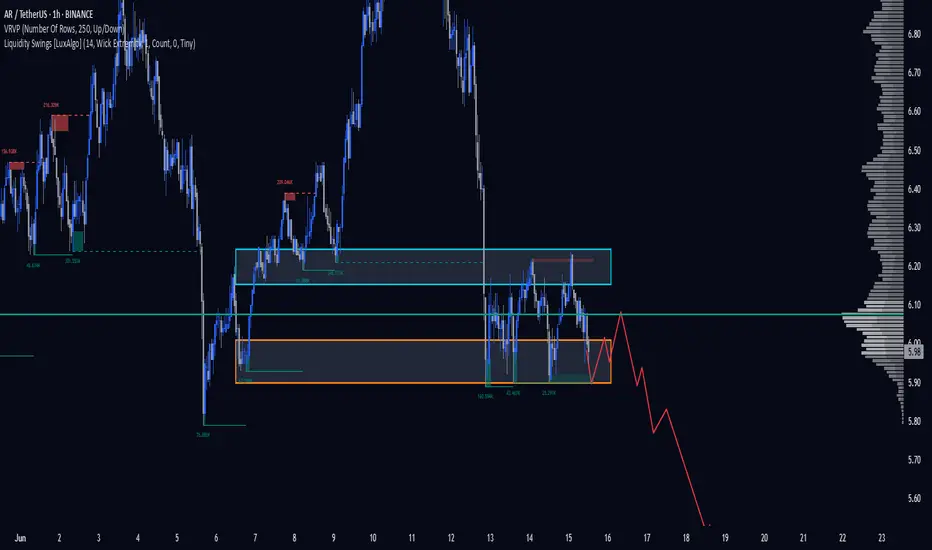
AR 1H. $5.90 Is the Last Line of Defense. 06/15/25BINANCE:ARUSDT If we fail to hold the $5.90 level, this asset could crash hard — potentially entering a deeper downtrend.
DYOR.
Spotify: Target Zone AheadSpotify has already come quite close to our turquoise Short Target Zone (coordinates: $725.67–$829.30). In our primary scenario, we continue to expect further upside in the near term, as the projected peak of wave B should materialize within this zone—a range that could present opportunities to lock in long-side gains or initiate short positions. Once the top is in place, we anticipate a more pronounced downward move. The focus then shifts to the magenta Target Zone (coordinates: $452.69–$390.93), which we consider a potential accumulation range for new long positions. That said, we’re also monitoring an alternative path, currently assigned a 36% probability. In that scenario, magenta wave alt.(5) would already be underway—meaning prices would bypass the magenta zone altogether.
📈 Over 190 precise analyses, clear entry points, and defined Target Zones - that's what we do.

BTC 4H. $104K or Bust — Critical BTC Moment! 06/13/25BINANCE:BTCUSDT remains in a sideways range between $110,336 – $101,297. The main trading volume is concentrated around $103,907.
Recently, the price reached the upper boundary of the range at $110,336 and sharply declined from there — confirming the strength of resistance. The drop was intensified by negative geopolitical news (Israel–Iran tensions).
As a result, BTC retraced into the $104,185 – $101,297 demand zone — a potential area where buyers might step in again.
Personally, I expect one more dip into the $104,185 – $101,297 range to test the strength of buyers.
⚠️ If negative news continues, a breakdown below $100,349 and a new local low is possible.
DYOR.

ATOM. Massive Liquidity Grab Incoming. 06/12/25BINANCE:ATOMUSDT At the moment, the price is in an accumulation phase.
The buyer interest zone lies between $3.806 – $3.601, which also serves as a strong support area. We may see solid spot/futures entries here and the potential start of a new upward move.
What we’re really waiting for is liquidity to be swept in this zone — where tons of stop-losses have clustered. Such a shakeout would be a perfect setup for a bullish impulse.
Spot/futures accumulation is valid within this zone.
DYOR.

BNB 1D Ready to Explode? This Chart Says YES. 06/12/25BINANCE:BNBUSDT is forming a tight consolidation right below key resistance at $710, inside a triangle structure. Every dip into the $655–$625 support zone gets quickly bought up — showing strong buyer interest and accumulation.
Price is compressing inside the triangle with higher lows, indicating bullish pressure. A breakout above $710 would likely trigger a strong move toward $770–$780, and potentially a new ATH > $800.
As long as $625 holds — I'm bullish. I expect one more sweep of support before an explosive breakout.
Spot/futures entries: $655–$625
Targets: $710 → $780 → $820+
Invalidation: Daily close below $625.

1INCH 1D. Showing Signs of Accumulation. 06/12/25BINANCE:1INCHUSDT There's growing media and social media attention around the 1INCH project, which could be a bullish sentiment trigger.
Currently, the price is trading within a descending channel and has recently bounced from the lower boundary, signaling a potential long entry or spot accumulation opportunity.
From current levels, I expect a clean 2x upside on spot. Personally, I think it's worth starting to scale in carefully on spot or futures.
However, keep in mind — even after a bounce, price could still dip slightly lower before any meaningful move up. A deeper correction remains a possibility, so always factor in risk.
📌 Key Takeaways:
• Long bias from current levels
• Potential 2x on spot
• Further dip possible — manage risk accordingly
DYOR. Stay sharp.

DOGE 1D: Missed PEPE? Don’t Miss DOGE 06/12/25BINANCE:DOGEUSDT
I’m expecting a continuation of the upward movement and a possible trend reversal.
There’s a chance we’ll revisit the 0.618 Fib level to shake out weak hands — a classic move before liftoff.
Looking at the chart, it really feels like altseason is closer than anyone expects. DOGE may lead the charge.
Entry Points (EP):
• Market
• $0.19357
• $0.18009
Take Profit (TP):
• $0.22787
• $0.25439
⚠️ My personal opinion only — not financial advice.
Do your own research and remember: all actions you take are your own responsibility. Practice solid risk management and avoid investing more than 2% of your total capital per trade.
DYOR.

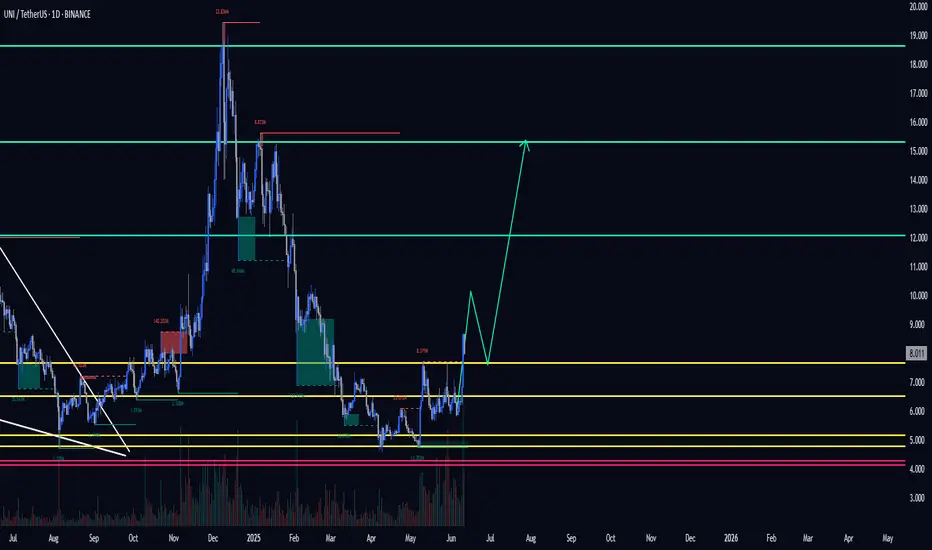
UNI 1D. Breakout Coming? Long-Term Setup Explained 06/11#UNI has been trading in a wide range between $4.072 – $18.634 for the past three years. This is known as an accumulation phase, where large players may be building positions ahead of the next major price move.
After a steep decline, the price bounced off the key support zone at $5.623 – $4.753. It then reclaimed and held above $6.325, a historically high-volume area — a bullish signal.
For short-term entries, I recommend waiting for confirmation above the 100-week moving average (MA100), which currently sits around $7.671. A break and close above that level would suggest a trend reversal.
🎯 Targets:
• $12.063
• $15.305
📥 Mid-term accumulation zone:
• $5.623 – $4.753
• If price drops to $4.072, it could be another solid buy opportunity.
DYOR.
PIXEL 1D. High-Risk, High-Reward Setup. Here's the Play. 06/11BINANCE:PIXELUSDT
Entry opportunity for the bold.
EP (Entry Point): 0.04215$ – 0.04020$
TP (Take Profit):
1️⃣ 0.14072$
2️⃣ 0.16076$
SL (Stop Loss): 0.02280$ or according to your personal risk management.
❗️No stop loss on spot — manage accordingly.
DYOR. Always know your risk.

#THETA 1D. Swing High Rejected – What's Next? 06/11/25We are currently in a consolidation range. After updating the swing high, price immediately faced seller pressure from the top of the structure.
Why did this happen?
Many participants were stuck in losses for a long time and decided to exit at breakeven as soon as price gave them the chance — totally understandable.
Key levels for the setup:
Yellow lines – potential entry points.
Red lines – stop-loss levels, depending on your risk appetite (marked two options).
Green lines – target areas.
Whether you go with spot or futures — the setup is there. Choose your strategy accordingly.
DYOR.

sand buy spot "🌟 Welcome to Golden Candle! 🌟
We're a team of 📈 passionate traders 📉 who love sharing our 🔍 technical analysis insights 🔎 with the TradingView community. 🌎
Our goal is to provide 💡 valuable perspectives 💡 on market trends and patterns, but 🚫 please note that our analyses are not intended as buy or sell recommendations. 🚫
Instead, they reflect our own 💭 personal attitudes and thoughts. 💭
Follow along and 📚 learn 📚 from our analyses! 📊💡"

$ENS / USDT 1D FAKEOUT ON FLAG? Incoming Pump? 📊 $ENS/USDT Perpetual Contract – Daily Timeframe Analysis
🟢 Bullish Setup
A bullish flag is forming on the daily chart — a continuation pattern indicating potential upward movement.
- Price recently entered into the golden pocket of the Fibonacci retracement tool marked from $16.881 – $25.241 on the third touch of the flag's resistance, triggering a fakeout, it now rests in the first Fair Value Gap.
- The strong wick rejection on the 3rd retest of the resistance/supply indicates bearish strength, momentarily pushing price lower.
- Despite this, the overall pattern remains valid as long as price respects the Golden Pocket and FVG zone below.
✅ If price closes above the golden pocket, it could present an excellent leveraged entry or spot position, with high reward potential off 67%.
🔴 Bearish Scenario
- So far, every test of the **4H supply zone** has resulted in rejection — showing persistent seller control at short-term resistance.
- If buyers fail to defend the golden pocket and recover the bullish trendline, the structure confirms a break. (Downtrend)
The confirmation of bearish pressure is the:
1) Large wick (Creating a shooting start candle pattern)
- Signaling bearish reversal.
2) Large Bearish Marubozu Candle.
- Indicates strong continuation of a downtrend.
3) Candle close below Trend line support.
- Showing Bears were able to successful make a major move.
🔽 In that case, we look to short after FVG confirmation and scalp down toward the daily demand zone.
📌 Patience is key. Let the price show intent before entering.
Please let me know what your thoughts are!

TECHNICAL ANALYSIS – KASPA/USDT (Daily Chart) + TRADE PLANTECHNICAL ANALYSIS – KASPA/USDT (Daily Chart)
Chart Pattern & Price Action:
Descending Channel (Falling Wedge): KASPA has been trading within a falling wedge pattern, typically a bullish reversal setup.
Breakout Zone Approaching: Price is currently testing the upper resistance of the wedge (~$0.086–$0.088). A breakout from this level may indicate trend reversal.
Key Resistance Zone:
$0.105 – $0.127: Significant supply area (marked in red). Previously rejected, it is the next target if price breaks out upward.
Support Zone:
$0.073 – $0.082: Demand zone. Coincides with the Bollinger Band lower range and historical support.
Indicators Overview:
Bollinger Bands:
Price is trading at or near the middle band, showing a neutral-to-slightly bearish bias.
A breakout above the upper band (~$0.0895) could trigger bullish momentum.
MACD (VMC Cipher_B_Divergences):
Strong bearish momentum continues, but we can observe potential bullish divergence forming.
Green dot signal at the bottom may indicate a possible local bottom.
RSI (Relative Strength Index):
Currently at 37.06, near oversold territory.
Could signal a bounce if RSI climbs above 40 and confirms strength.
Money Flow Index (Art’ Money Flow):
MFI is deep in negative; however, these levels often precede trend reversals.
Watch for a crossover into positive territory as confirmation.
Stochastic RSI:
Bullish crossover around 14.53 / 15.67 in the oversold zone.
Early sign of potential short-term bounce.
TRADING PLAN
Entry Points:
Zone Type Price Range Reason
Buy Spot 1 Conservative $0.073 – $0.082 Strong historical support & bottom of wedge
Buy Spot 2 Aggressive ~$0.086 – $0.089 Breakout of descending wedge
Buy Spot 3 Momentum Break above $0.105 Bullish confirmation + breakout of major resistance
Take Profit Zones:
TP Level Price Notes
TP1 $0.105 First resistance / psychological level
TP2 $0.127 Strong resistance – expect rejection here
TP3 $0.15–0.16 Major extension target if strong momentum
Stop-Loss Strategy:
Strategy Type Placement
Conservative Below $0.073
Aggressive Below $0.080
Risk Management:
Use position sizing relative to account size (e.g., 1–3% risk per trade).
Adjust stop-loss dynamically if entering at breakout.
Combine with on-chain metrics or volume spikes for higher conviction.
SCENARIOS:
🔼 Bullish Scenario (Blue Up Arrow):
Breakout above wedge → retest → rally toward $0.105+
Break $0.105 confirms macro uptrend continuation
🔽 Bearish Scenario (Blue Down Arrow):
Rejection at wedge top → breakdown of $0.082 → revisit $0.073 support
Below $0.073 would invalidate short-term bullish structure
