SPX500 Market Outlook | Fed Meeting & Retail Earnings in FocusSPX500 Overview
Wall Street subdued as retail earnings and Fed meeting remain in focus
U.S. stock index futures edged lower on Wednesday, extending a tech-led pullback on Wall Street. Investors are closely monitoring earnings from major retailers such as Target and Lowe’s, seen as key indicators of consumer health, while awaiting the upcoming Federal Reserve symposium later this week.
Concerns over tariffs and their potential impact on consumer prices have weighed on sentiment, adding to the cautious market tone.
🔎 Technical Outlook
The SPX500 remains under bearish pressure after stabilizing below the pivot line at 6425.
Bearish Scenario:
As long as price trades below 6425, the trend favors the downside, targeting 6389 and 6366. A confirmed break of 6366 could accelerate the decline toward 6321.
Bullish Scenario:
A sustained 4H candle close above 6425 would shift momentum back to the upside, with resistance at 6439, followed by 6468 and 6485.
Support: 6389, 6366, 6341, 6321
Resistance: 6439, 6468, 6485
SPX (S&P 500 Index)

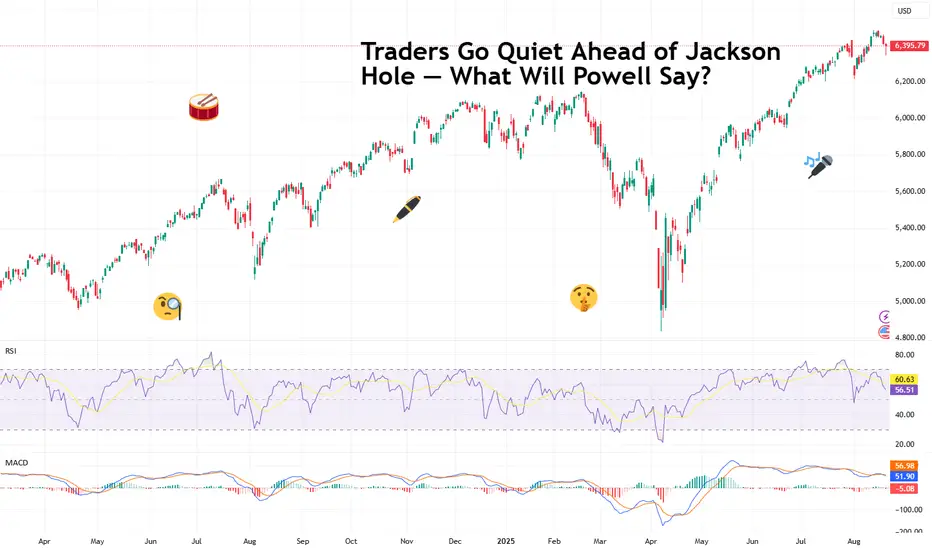
Traders Go Quiet Ahead of Jackson Hole — What Will Powell Say?Markets have been eerily quiet this week. Not because traders suddenly discovered meditation, but because everyone is waiting for one man in Wyoming to make things move.
Federal Reserve Chair Jerome Powell, the man who moves markets with a simple “Good afternoon,” is about to step onto the stage at the annual Jackson Hole Economic Symposium. And when he does, markets will hang on every word — because it’s his final speech as Fed boss at the premium event.
⛰️ Jackson Hole: Where Hiking Boots Meet Basis Points
The Jackson Hole conference isn’t your average PowerPoint snoozefest. Each year, central bankers from around the world swap suits for Patagonia fleeces and gather in Wyoming’s Grand Teton National Park. Think Davos, but with more elk.
This year’s theme? “Labor Markets in Transition.” Translation: the Fed wants to talk demographics, productivity, and immigration — the forces shaping how Americans work and how the economy grows. But make no mistake: nobody’s tuning in for a TED Talk on labor force participation rates. They want Powell’s take on interest rates.
🎯 Powell’s Big Moment
Powell’s speech may only run about 15 minutes (he’s not known for monologues), but the stakes couldn’t be higher. His term as Fed chair ends in May, and President Donald Trump has spent most of this year taking swings at him — calling him a “major LOSER” and grumbling that the Fed is moving “Too Late” on rate cuts.
Trump has even floated the idea of firing Powell early, which, technically speaking, isn’t supposed to happen. But this is 2025, and “not supposed to happen” has lost most of its meaning.
So, Jackson Hole could be Powell’s last best chance to lock in a legacy: defending the Fed’s independence while signaling where rates are headed next.
⛅️ Markets Already Have a Guess
Wall Street isn’t exactly sitting in suspense. Interest-rate swaps are pricing in an 80% chance of a 25-basis-point cut in September, with two full cuts baked in before the year is out.
Why? Because the data leaves Powell little wiggle room:
Jobs market: Recent revisions show weaker-than-thought employment growth . Maximum employment? Not quite.
Inflation: July’s consumer price index came in at 2.7% year-on-year — stable, but not scary enough to justify keeping rates where they are forever.
Tariffs: Trump’s sweeping duties could pressure inflation further, but they’re also weighing on growth. Powell’s challenge is threading the needle between those forces.
Translation: the Fed looks ready to flip from “higher for longer” to “cutting season.”
🧘♂️ Traders on Mute
If you think markets look a little sleepy, you’re not wrong. On Monday, the S&P 500 basically took a nap , slipping 0.01% as traders sat on their hands. Tuesday was even worse with big tech nosediving all day long.
It’s not just Powell they’re waiting for. Roughly 95% of S&P 500 companies have now reported earnings, (mandatory note: catch all earnings dates in the Earnings Calendar ) with more than 80% beating expectations.
Companies have been surprisingly nimble, offsetting tariffs and riding the weaker dollar . Yet despite the blowout earnings season, nobody wants to make big moves until Powell clears the air.
Call it the pre-Jackson Hole silence — the calm before the potential volatility storm.
🥊 Powell vs. Trump
There’s also political theater baked into this. Trump has made no secret of his desire for lower rates to juice growth and pump markets. Powell, however, has tried to keep the Fed above the political fray.
But that balancing act has been messy. Lower too quickly, and Powell risks stoking more inflation. Hold too high, and he risks slowing the labor market just as it’s showing cracks. Either way, he’ll be accused of playing politics.
This isn’t just about economics. It’s about central bank independence — a fancy way of asking: Can Powell make decisions without getting steamrolled by the White House?
🔮 What to Watch For
Here’s what traders will parse in his speech:
Tone: Does Powell sound more dovish (hinting at cuts) or still hawkish (concerned about tariffs fueling inflation)?
Framework: Will he unveil a new policy strategy for inflation and jobs?
Forward guidance: Any nods to September’s meeting or beyond will be amplified a thousand times on trading desks worldwide.
In other words, the market doesn’t just want Powell’s words. It wants the subtext and the context.
🚀 Why It Matters for Traders
For traders (yes, you), Powell’s Jackson Hole moment has real portfolio consequences:
Equities: A dovish Powell could extend the market’s record run — the S&P 500 and Nasdaq already logged new all-time highs this summer.
Bonds: Rate cuts could mean yields falling, bond prices rising. Treasuries might not be the snooze trade they’ve been.
Dollar: Lower rates could push the greenback down, offering a boost to commodities and emerging markets. Lower rates = lower deposit yields = less appeal to hold greenback.
Crypto: Yes, even Bitcoin BITSTAMP:BTCUSD cares. A dovish Fed means more liquidity sloshing around — which historically finds its way into risk assets.
🏁 The Takeaway
Markets are quiet now, but don’t expect them to stay that way. Powell’s Jackson Hole speech is shaping up as one of the most important of his career — maybe his swan song as Fed chair.
Off to you : Here’s a question (or two). Will he go dovish, handing traders the rate cuts they crave? Or will he stand firm, reminding everyone that the Fed won’t be bullied by politics? Share your thoughts in the comments!
ES 08/21 — Key Levels - Short Bias - Setups - Fundamental Setups (A++ first)
1) SHORT — Retest-and-fail of supply (preferred)
• Zones: 6,433–36 or 6,445–47 (upper band 6,469–71).
• Trigger: 5-minute bearish close back below the shelf (no retest required); size to full only if a 15-minute bearish prints within the next 3×5m bars.
• Risk: entry +6–8 pts.
• TPs: +15 / +27 / +42 pts from entry (e.g., 6,445 → 6,430 / 6,418 / 6,403).
• Continuation guard: within 2×5m price must extend the low or print a lower high while failing to reclaim the shelf; otherwise cut ½ or scratch to BE.
2) SHORT — Breakdown & acceptance
• Trigger: 5m close < 6,418 and no immediate reclaim next bar.
• Risk: entry +6–8 pts.
• TPs: toward 6,406 → 6,392 → 6,382–76.
3) LONG — Only if promoted
• Trigger: 5m close & hold ≥ 6,436 (offers pull/flip; next bar holds).
• Risk: 6–8 pts (around 6,430).
• TPs: 6,451 → 6,459–60 → 6,471–72.
• Stand-down: lose 6,436 on a 5m close or see offers reload overhead.
Execution windows: 9:45–10:45 ET and 13:50–15:30 ET; avoid new risk 11:30–13:30 without momentum/confirmation.
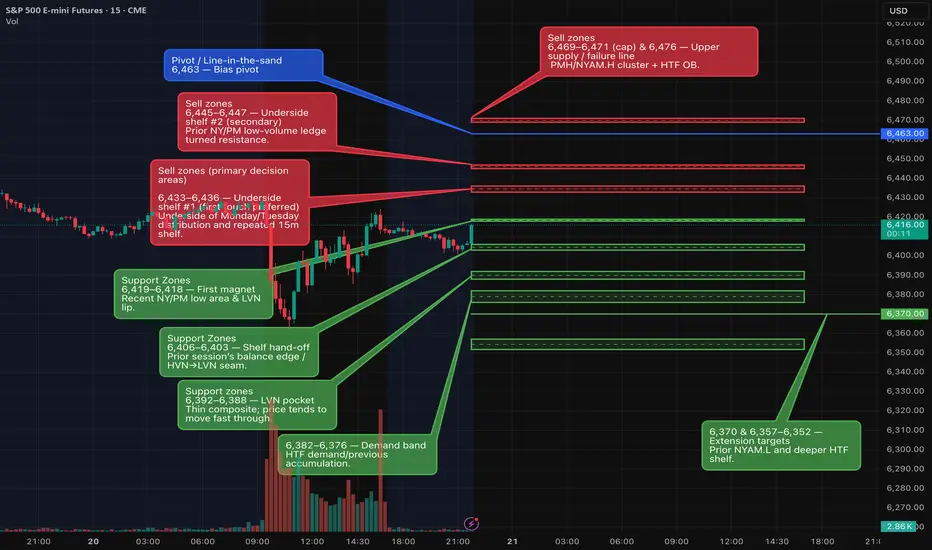
Key levels (from HTF → LTF)
• Pivot / line-in-sand: 6,463 (short bias while ≤ this).
• Supply / sell zones: 6,433–36, 6,445–47, 6,469–71 (cap), 6,476.
• Supports / magnets: 6,419–18, 6,406–03, 6,392–88, 6,382–76, 6,370, 6,357–52.
Fundamentals — Thu, Aug 21, 2025 (ET)
• 08:30 — Weekly Initial Jobless Claims (DOL). Weekly claims are published Thursdays at 8:30 a.m. ET. 
• 08:30 — Philadelphia Fed Manufacturing Index (Aug). Next release Aug 21, 8:30 a.m. ET. 
• 10:00 — Existing Home Sales (July, NAR). NAR schedules the Jul report for Thu, Aug 21 at 10:00 a.m. ET. 
• 10:00 — Conference Board LEI (July). Thu, Aug 21, 10:00 a.m. ET.  
• 10:30 — EIA Weekly Natural Gas Storage. Standard release Thursdays 10:30 a.m. ET; next release Aug 21.  
• S&P Global Flash US PMI (Aug). Scheduled for Thursday (check S&P calendar; release times shown in UTC on their site). 
• Jackson Hole Economic Policy Symposium begins (Aug 21–23). 2025 theme: “Labor Markets in Transition.” 
How I’ll adapt intraday
• A stronger-than-expected Claims/PMI/Philly Fed that lifts yields and the USD into 6,433–36 / 6,445–47 favors setup #1 (fade the pop).
• EHS/LEI at 10:00 can whipsaw a breakdown—prefer acceptance before pressing setup #2.
• If Jackson Hole headlines skew risk-on and we accept ≥ 6,436, switch to setup #3 toward 6,451/60/71–72.
Nightly $SPY / $SPX Scenarios for Thursday, August 21, 2025 🔮 Nightly AMEX:SPY / SP:SPX Scenarios for Thursday, August 21, 2025 🔮
🌍 Market-Moving Headlines
Tech jitters spill as Jackson Hole kicks off. Global equities slipped following a tech sell‑off driven by concerns over U.S. intervention in chipmakers, while traders await Fed Chair Powell’s policy cues. AMEX:SPY and NASDAQ:TLT under pressure as rate‑cut expectations waver.
Sony hikes PS5 prices amid tariffs. Effective August 21, PlayStation 5 models in the U.S. see a $50 price increase—tariff impact spilling into consumer electronics. Raises inflation whispers amid already elevated tech cost narrative.
Healthcare activism heats up. Boards at firms like Medtronic, Pfizer, and Novo Nordisk shift under investor pressure—governance shake‑ups adding a layer of corporate risk and potential M&A signals.
⏱ Key Data Releases & Events (ET)
10:00 AM — Advance Services Report (Q2) (Census bureau). Quarterly weight of service economy—strong print supports Pro side of markets; weak could dial back rate‑cut hopes.
10:00 AM — Summer Youth Labor Force Survey (Annual). Goes with job‑market narrative from July—may tweak Fed sentiment depending on labor softening/stability.
Jackson Hole Symposium begins. Markets now fully focused on Powell; tone could make or break short‑term equity and bond positions.
⚠ Disclaimer: Educational/informational only — not financial advice.
📌 #trading #stockmarket #Fed #JacksonHole #SPY #SPX #TLT #Sony #tech #tariffs #services #labor #activism #healthcare
8/20/25 SPX Trade Plan📊 Quantum's Trade Plan 📊
TVC:VIX - TVC:DXY - #10Y = Caution📈
⚪️ 6400 Pivot
🟢 If 6400 fails then short - 6390--6388--6375--6364
🔴If 6400 hold then long - 6409--6426--6440--6445
🔵 -Dex with sell walls at 6400 & 6450
🟠 Vanna neutral - 6405-6410 vanna flip
⚫️ Volume + Flow must support thesis

DAX/GER30 SHORT/LONG sequence Swing Trade +500/+500 points 🔸Hello traders, let’s review the 2hour chart for GER30/DAX. Strong recovery from recent lows, however price testing key resistance and support zones where major reactions are expected.
🔸Speculative setup defined by resistance at 24,500 and key S/R demand zone at 24,000. Both zones have recently been validated with +500 point reactions.
🔸Currently both resistance and support levels are respected and price action remains technical around these areas.
🔸Recommended strategy for DAX traders:
Short Sell at Market from resistance 24,500
SL above resistance, TP 24,200 / 24,100 / 24,000.
Buy & Hold Long from key S/R 24,000
SL below support, TP 24,300 / 24,400 / 24,500.
🎁Please hit the like button and
🎁Leave a comment to support our team!
RISK DISCLAIMER:
Trading Futures, Forex, CFDs and Stocks involves a risk of loss.
Please consider carefully if such trading is appropriate for you.
Past performance is not indicative of future results.
Always limit your leverage and use tight stop loss.

S 08/20 — Short bias below, Key Levels (watch FOMC minutes)Overview
Higher-timeframe trend has shifted lower. After failing at ~6,476, price broke the 6,446 shelf and printed a new low near 6,419 with expanding volume. As long as we remain below 6,463, I keep a short bias and will fade bounces into supply.
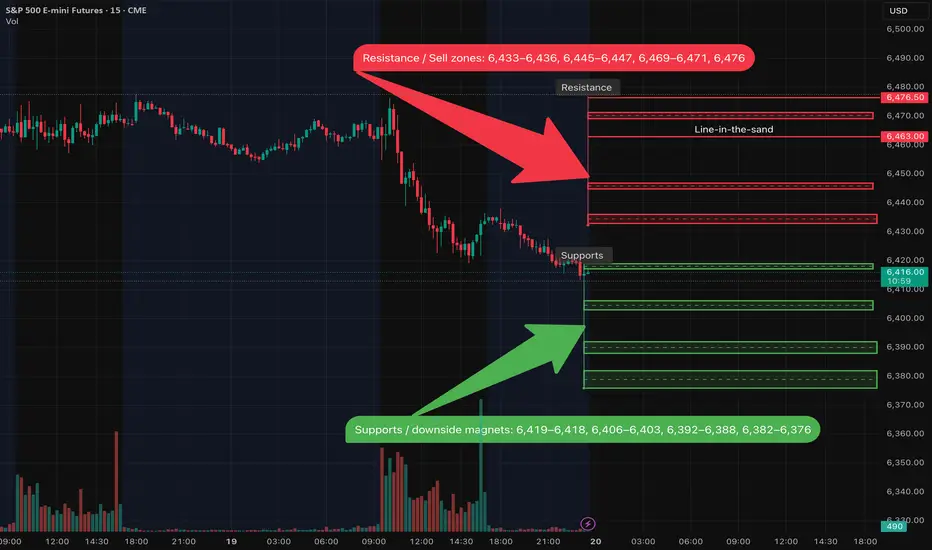
Key Levels
• Line-in-the-sand: 6,463
• Resistance / Sell zones: 6,433–6,436, 6,445–6,447, 6,469–6,471, 6,476
• Supports / downside magnets: 6,419–6,418, 6,406–6,403, 6,392–6,388, 6,382–6,376
Primary Plan — Bearish continuation
• Prefer selling failed retests into 6,433–6,436 or 6,445–6,447.
• Targets: first back to 6,419–6,418, then 6,406–6,403, and if momentum persists 6,392–6,388 / 6,382–6,376.
• Confirmation I want to see: intraday rejection wicks at the zone, momentum rolling over, and sellers stepping back in.
Alternative — Breakdown
• If price accepts below 6,418, I’ll look for continuation toward 6,403, then 6,392 / 6,376.
Invalidation / Neutralization
• Reclaiming 6,463 neutralizes the immediate short bias.
• Acceptance ≥ 6,471–6,476 opens squeeze risk toward 6,491 / 6,500; I’d stand aside on shorts until structure turns back down.
Event Risk (ET) — Wed 08/20
• 07:00 MBA Mortgage Applications
• 10:30 EIA Weekly Petroleum Status Report
• 13:00 U.S. 20-Year Treasury Auction
• 14:00 FOMC Minutes (Jul meeting)
Note: Expect headline-driven volatility around 14:00—I avoid initiating new positions into the release.
Posting Notes
This idea reflects levels visible on 1D/4H/1H (with 30m/15m for execution). I’ll update intraday if acceptance/rejection flips at the zones.
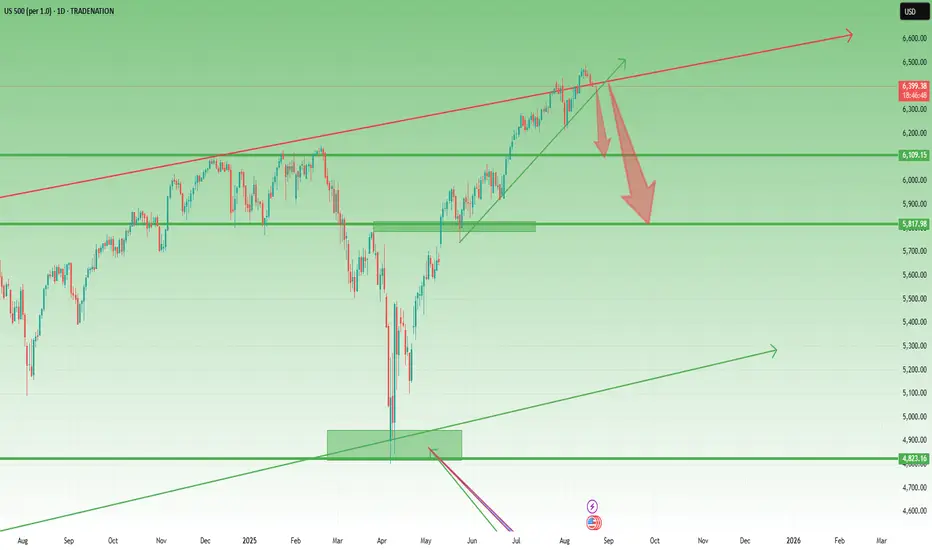
US500 – Has the Correction Started?1. What Happened Yesterday
Yesterday, US500 dropped around 1%, signaling that a meaningful correction could be starting. Unlike Nasdaq, which already broke under two key support levels, here the price is still above the trendline that began back at the end of May, when the index broke through the important 5800 resistance.
The rise since April has been huge and not fundamentally justified, making the index vulnerable to a reversal towards more sustainable levels.
________________________________________
2. Key Question
Has the correction really started, or will we first see another spike before the drop?
________________________________________
3. Why More Downside is Likely
• Trendline vulnerability: A break under 6380 could trigger acceleration to the downside.
• First bear target: 6100, the old ATH.
• Bigger picture: A move under 6000 remains likely, with 5800 as a longer-term destination.
• Risk/reward setup: Any spike higher should be seen as a selling opportunity. Around 6500 would be ideal to short.
________________________________________
4. Trading Plan
• Sell spikes, especially near 6500).
• Watch 6380 – break here could open the way towards 6100.
• Medium/long term bias: Bearish, with more room down than up.
________________________________________
5. Final Note 🚀
The market must confirm, but the strategy is clear: don’t chase the bounce, sell the strength and ride the correction.
Disclosure: I am part of TradeNation's Influencer program and receive a monthly fee for using their TradingView charts in my analyses and educational articles.
Why The Bubble Theory Makes No SenseIt seems like every other week with tech stocks making new all time highs, there is a constant chatter of claiming we're in a bubble. One of the classic signs of a bubble, is excessive leverage betting on ever higher returns.
This is a chart of securities margin loans provided by the Fed updated quarterly. As you can see since the 2008 financial crisis speculators have been very conservative with their use of leverage. It's almost like 2008 scared people so badly people more than a decade later are still behaving financially conservative.
Some of the rational for the talk of a bubble is historically high PE ratios, but this can be explained by massive reinvestments into AI infrastructure by the biggest tech companies. The more investments they make the higher the PE ratios look.
The key ingredient of a bubble is leverage and besides the small spike of it post-covid, there is no sign of excessive speculation.
Remember tech stocks are absolutely going to have a pullback likely next year or 2027, but the fear of a dot-com era bubble is just simply unfounded.

SPX500 Bearish Breakout!
HI,Traders !
#SPX500 made a bearish
Breakout of the rising support
Line and we are bearish biased
So we will be expecting a
Further bearish move down !
Comment and subscribe to help us grow !

S&P500 Can the 4H MA50 save the day again?The S&P500 index (SPX) is on a short-term pull-back following the new All Time High (ATH) on August 15 of the 3-month Channel Up. It is just above the 4H MA50 (blue trend-line), which has been the most common level of Support throughout this pattern, before the 4H MA200 (orange trend-line), which formed its last Higher Low.
As a result, as long as it holds, it is more likely to see a continuation of the Bullish Leg that started on the 4H MA200 bounce (August 01). The previous Bullish Leg peaked on a +8.80% rise, so that gives us a medium-term Target of 6750.
-------------------------------------------------------------------------------
** Please LIKE 👍, FOLLOW ✅, SHARE 🙌 and COMMENT ✍ if you enjoy this idea! Also share your ideas and charts in the comments section below! This is best way to keep it relevant, support us, keep the content here free and allow the idea to reach as many people as possible. **
-------------------------------------------------------------------------------
Disclosure: I am part of Trade Nation's Influencer program and receive a monthly fee for using their TradingView charts in my analysis.
💸💸💸💸💸💸
👇 👇 👇 👇 👇 👇

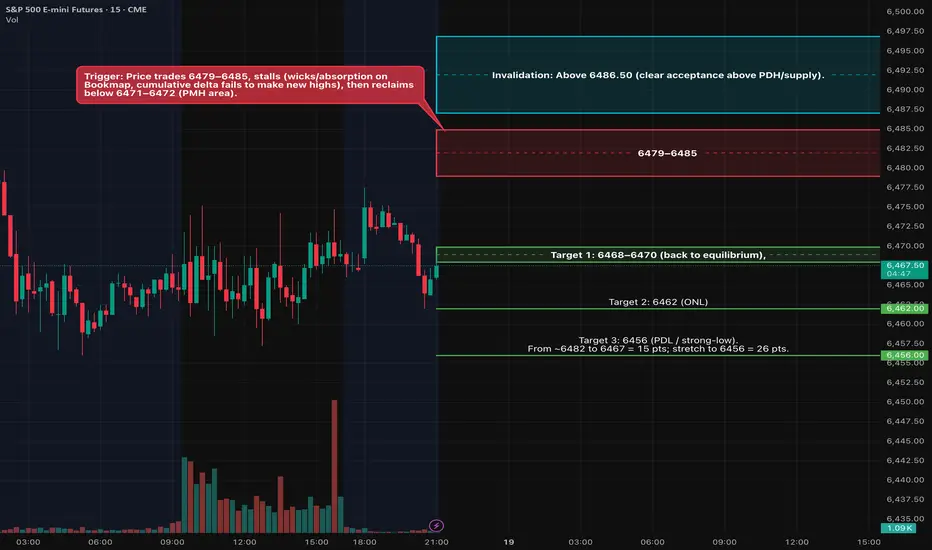
ES Analyses 08/19 Rejection short from 6479–6485 (OB + PDH)Fundamentals (what can move ES)
• 08:30 ET – U.S. New Residential Construction (Housing Starts/Permits). First move risk right at the print; can nudge yields and risk appetite. We’ll let the initial spike settle and then act on the HTF levels below. 
⸻
Key levels from your charts
Numbers rounded to the quarter where needed.
• PDH: 6484.25
• PDL: 6456.00
• ONH: 6475.25
• ONL: 6462.00
• RTH VWAP (today): 6466.50
• PMH / Asia H cluster: 6470.5–6471.75
• 30-min supply / OB: 6479–6485 (overlaps PDH)
• Liquidity/defense zone (“strong low”/Mon swing): 6452–6456
Think of 6468–6472 as the intraday “equilibrium” band we’ve been ping-ponging around; acceptance away from this band is what should start the 15+ pt drive.
Context: We press into the 30-min supply shelf that capped NYPM today.
Trigger: Price trades 6479–6485, stalls (wicks/absorption on Bookmap, cumulative delta fails to make new highs), then reclaims below 6471–6472 (PMH area).
Entry style: Stop-market on the reclaim or limit into a micro pullback after the failed pop.
Invalidation: Above 6486.50 (clear acceptance above PDH/supply).
Targets:
6468–6470 (back to equilibrium),
6462 (ONL),
6456 (PDL / strong-low).
From ~6482 to 6467 = 15 pts; stretch to 6456 = 26 pts.
Order-flow tells: Offers replenish 6480–6485; iceberg/absorption on up-ticks; delta divergence into the level.
Timing
08:30 ET data: stand aside for the first 2–5 minutes; let the impulse show its hand, then look for our triggers.
Federal Reserve Bank of New York
NY AM window: 09:45–11:30 ET.
NY PM window: 13:30–15:30 ET (if morning doesn’t give clean structure).
Day 11 — Trading Only S&P Futures — Mixed Signals, +$199Welcome to Day 11 of Trading Only S&P Futures!
Today was all about adapting and not forcing trades. I’ve noticed I usually perform best later in the day, so I’ve been starting with smaller contracts to warm up. Profits started rolling in, but things felt different — market makers kept flipping structure and trying to trap traders.
I was expecting more downside, but once I saw the MM games, I decided to protect profits and lock in +$199.20 instead of being greedy.
📰 News Highlights
STOCKS END MOSTLY FLAT TO START THE WEEK AS INVESTORS LOOK AHEAD TO POWELL SPEECH, RETAIL EARNINGS
🔔 VX Algo Signals (9:30am – 2pm EST)
7:01 AM Market Structure flipped bullish on VX Algo X3!
9:58 AM Market Structure flipped bearish on VX Algo X3!
9:58 AM VXAlgo ES X3DD Sell Signal
11:30 AM VXAlgo NQ X1DD Sell Signal
12:30 PM Market Structure flipped bullish on VX Algo X3!
12:50 PM VXAlgo NQ X1DD Sell Signal
2:00 PM Market Structure flipped bullish on VX Algo X3!
🔑 Key Levels for Tomorrow
Above 6460 = Remain Bullish
Below 6450 = Bearish

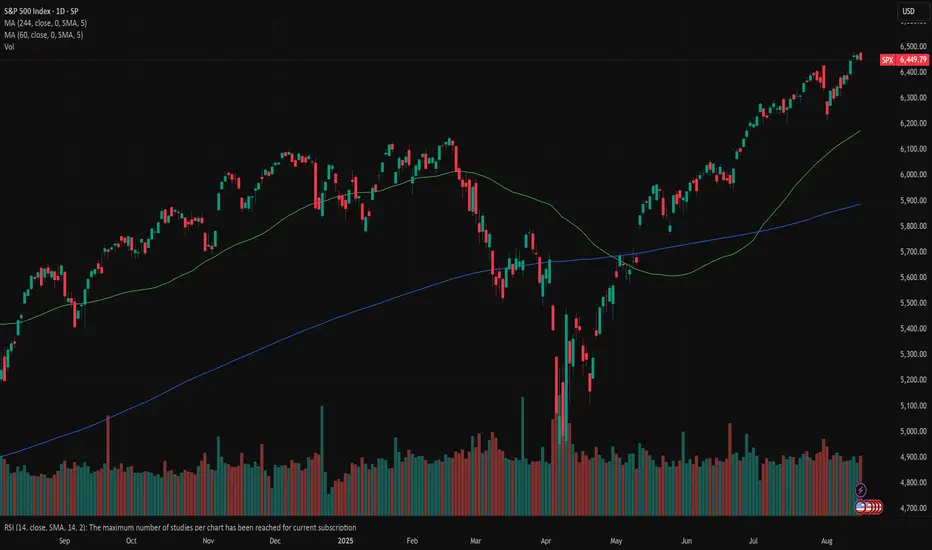
SPX: absorbed tariffsThe US equity markets continue to be supported by positive market sentiment. The closely watched macro data during the previous week was July inflation, which was 0,2% for the month and fully in line with market estimates. It seems that for the moment, the US economy is ready to absorb the burden of increased trade tariffs and keep inflation within lower levels without too much oscillation. Such development is increasing market expectations that the Fed might cut interest rates in September. Although the index closed the week lower, still, during the week, the S&P 500 reached another all time highest level at 6.475 on Wednesday. The index closed the week at 6.449 on Friday. Analysts are noting that this correction occurred due to weaker consumer sentiment as posted by the University of Michigan on Friday. At the same time, inflation expectations for this year and for the period of next five years have modestly increased.
Considering a new ATH, some profit taking might occur during the week ahead, which could impact modest correction in index. However, considering continuous relatively stable inflation and strong demand posted during July, despite trade tariffs, analysts are noting that the market optimism will continue. For the week ahead, it should be also considered that a yearly Jackson Hole Economic Policy Symposium will be held 21-23 August, where Fed Chair Powell is expected to hold a speech. This event is both well covered by the media and closely watched by investors, looking for an indication of a potential future move on a monetary policy side.
ES (S&P 500 Futures) - Week Plan Aug 18–22Context (W/D/4H/1H/30M): ES is consolidating just under 6,500. Price is boxed roughly 6,466 ↔ 6,504/12 with a cluster of highs above and recurring demand tests below.
Key Levels (zones, not single ticks):
Resistance: 6,504–6,512 (near-term lid). Above that: 6,520–6,550 (weekly supply/“weak high”).
Decision level: 6,492–6,495 (where control often flips intraday).
Supports: 6,464–6,466 (first support) → 6,436–6,440 → 6,380–6,395 (deeper support).
How to read it:
Bull path: A firm break and hold above 6,504 favors a push toward 6,520 → 6,535 → 6,550.
Bear path: Failure at 6,495 or a clean break below 6,464 opens 6,440 → 6,390.
If price stays between 6,466 and 6,504, expect range behavior until a catalyst pushes it out.
Scenarios (next week):
Range continues: Chop between 6,466–6,512 until mid-week events.
Upside break: Hold above 6,504 → test 6,520–6,550 (watch for reaction there).
Downside break: Lose 6,464 with momentum → 6,440, then 6,390 if pressure persists.
Key events (ET):
Wed: Federal Reserve meeting minutes (afternoon).
Thu: Weekly claims; flash PMIs; existing home sales (morning block).
Thu–Sat: Jackson Hole economic symposium (watch for policy remarks).
Notes: Levels are zones and may see initial reactions before acceptance or rejection. This post is for market commentary/education only.

Technical Analysis for US500 (S&P 500)Closing Price: 6447.8 (16th Aug 2025, 12:50 PM UTC+4)
Analysis Methods: Japanese Candlesticks, Harmonic Patterns (ABCD, M/W), Elliott Wave, Wyckoff, Gann Theory (Time/Square of 9/Angles), Ichimoku, RSI, Bollinger Bands, VWAP, Moving Averages (MA/EMA/SMA/WMA).
---------------------------------------------------------------------------------------------
1. Long-Term Trend (Weekly/Monthly)
Elliott Wave:
US500 is in Wave 5 of a bull cycle (Wave 3 peak: 6500, Wave 4 dip to 6200).
Target: 6600–6700 (1.618 extension of Wave 1).
Gann Price Forecasting:
Square of 9: √6447.8 ≈ 80.30 →
Key resistance: 81² = 6561, support: 80² = 6400.
Break above 6561 targets 6724 (82²).
Ichimoku (Monthly):
Tenkan/Kijun: Bullish crossover (Tenkan: 6300 > Kijun: 6200).
Cloud: Price above Senkou Span (6100–6250) – bullish structure.
Moving Averages:
Weekly SMA(200): 6100 (major support).
Swing Outlook: Bullish but extended. Final Wave 5 targets 6600–6700.
2. Medium-Term Swing (4H/Daily)
Harmonic Patterns:
Bearish ABCD on Daily:
A: 6500 → B: 6350 → C: 6450 → D: 6470–6490 (1.272 BC extension).
Bullish Gartley (M Pattern) near 6350 (0.786 XA retracement).
Wyckoff Phase:
Distribution above 6450:
Upthrust at 6470 (16th Aug) on fading volume.
Lack of demand above 6460.
Gann Theory:
Time Window: Aug 19–22 (Square of 9 reversal cluster).
Price-Time Squaring: 6447.8 aligns with Aug 16 – consolidation likely.
Gann Angle: 1x1 support at 6420.
Indicators:
RSI(14) + Bollinger Bands (Daily):
RSI: 66 (neutral-bullish).
Price hugging upper BB(20,2) at 6475 – band expansion signals volatility.
VWAP (Weekly): 6380 (swing support).
Swing Trade Setup:
Short near 6470–6490 → Target 6400. Stop-loss: 6520.
Long near 6350 → Target 6500. Stop-loss: 6300.
3. Intraday Outlook (5M–4H)
Key Levels:
Resistance: 6460 (Gann 1x1), 6475 (daily high), 6490 (ABCD target).
Support: 6440 (VWAP), 6430 (Ichimoku cloud), 6420 (Gann angle).
Indicators:
Ichimoku (1H):
Tenkan: 6445, Kijun: 6435 → Price above both (weak bullish).
Cloud: Thin bullish (6425–6435) – intraday support.
RSI + Bollinger Bands (1H):
RSI(14): 59 (neutral).
Price testing mid-BB(20,2) at 6445 – break below signals bearish shift.
VWAP + MAs:
VWAP: 6442 (intraday pivot).
EMA(20): 6448 (resistance).
Candlestick Patterns:
4H Bearish Engulfing at 6465 → Reversal signal.
1H Evening Star at 6460 → Confirms weakness.
Gann Intraday Squaring:
Time Cycle: 14:00–16:00 UTC+4 (NY open) for volatility.
Price Harmony: Close below 6445 targets 6430 → 6420.
Intraday Trade Plan:
Sell below 6445 → Target 6430 (VWAP) → 6420 (Gann support).
Buy above 6465 only if RSI <65 → Target 6475.
Stop-Loss: 10–15 points.
Summary of Key Signals
Time Frame Bias Entry Target Stop-Loss
Intraday Bearish <6445 6440-6445 6420-6430 6455
Swing Bullish 6350-6370 6450-6500 6300
Swing Bearish 6470-6485 6400-6420 6520
Critical Events:
Gann Reversal Window: Aug 19–22 (watch for Fed minutes/Nvidia earnings).
Daily Close >6500 invalidates bearish patterns and targets 6561.
Risk Note: US500 is highly sensitive to tech earnings and Fed policy. Use tight stops during events.
Disclaimer: Technical analysis reflects historical patterns, not guarantees. Fundamental catalysts can override signals. Always use risk management.
For those interested in further developing their trading skills based on these types of analyses, consider exploring the mentoring program offered by Shunya dot Trade .( world wide web shunya dot trade )
I welcome your feedback on this analysis, as it will inform and enhance my future work.
Regards,
Shunya.Trade
world wide web shunya dot trade
⚠️ Disclaimer: This post is educational content and does not constitute investment advice, financial advice, or trading recommendations. The views expressed here are based on technical analysis and are shared solely for informational purposes. The stock market is subject to risks, including capital loss, and readers should exercise due diligence before investing. We do not take responsibility for decisions made based on this content. Consult a certified financial advisor for personalized guidance.

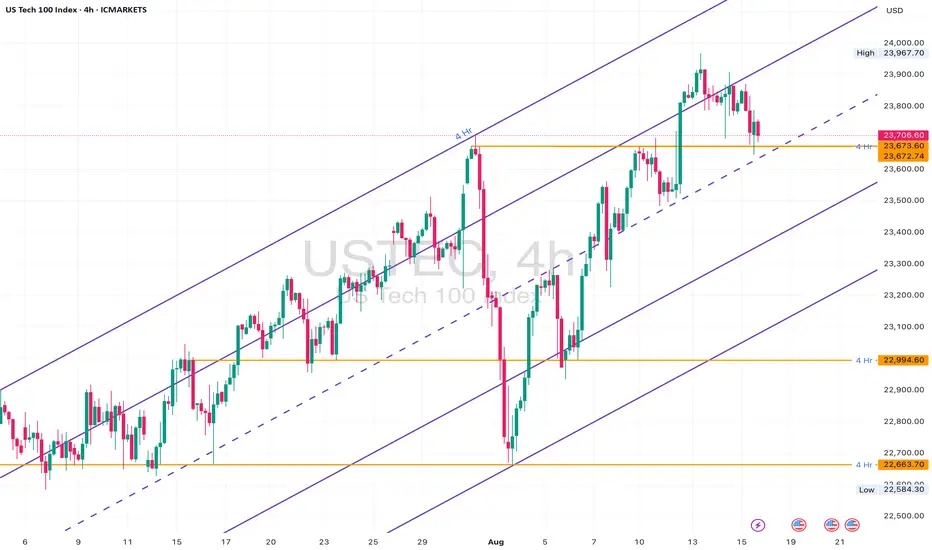
NAS100 4H Channel: Bounce or Breakdown?NASDAQ100 has been trending within a clean ascending channel on the 4H timeframe. We’re now sitting at a crucial decision point — the midline and horizontal support around 23,670.
This zone has historically acted as a strong S/R pivot. If price holds, we could see another bullish bounce toward 24,000+. But if it breaks and closes below, we may get a clean drop toward the bottom of the channel — with 23,200 and 22,663 as targets.
Plan:
• Wait for a 4H close above or below the 23,670 level
• Bullish scenario: Bounce toward upper channel (~24,300)
• Bearish scenario: Drop to lower channel boundary with incremental TP levels
Structure:
• 4H rising channel structure still intact
• Price testing midline zone
• Horizontal level at ~23,670 adds confluence
• No confirmed break of channel yet
Key Zones:
• Support: 23,670 (midline + structure support)
• Bullish flip zone: 23,967
• Bearish continuation zones:
‣ 23,200
‣ 22,994
‣ 22,663
Day 10 — Trading Only S&P Futures | $200+ Goal HitWelcome to Day 10 of Trading Only S&P Futures!
After waking up super early and not getting back to sleep, I spent most of my morning going through 13F filings to see where hedge funds are putting their money. The trading day started strong — market structure flipped bearish and price action followed perfectly.
I missed the exact market bottom by just 2 points, but patience paid off. I eventually caught the reversal back to the 5-min MOB and closed the day with a +212.54 gain — hitting the $200 daily goal I’ve been aiming for all week.
📈 What you’ll learn
How to stay patient after missing a perfect entry
Using market structure & MOB zones together
Why having a daily profit target helps discipline
Combining trading with ongoing market research
⏰ Timestamps
0:00 — Intro & Day 10 Recap
0:50 — Early Start & Hedge Fund 13F Research
1:40 — Market Structure Sets the Tone
2:10 — Missing the Bottom by 2 Points
3:00 — Catching the Reversal at 5-min MOB
4:00 — Key Levels for Tomorrow
4:30 — Closing Thoughts
📰 News Highlights
FED CHAIR CANDIDATE MARC SUMERLIN SUPPORTS 50BPS RATE CUT DUE TO INVERSION OF CURVE
🔔 VX Algo Signals (9:30am – 2pm EST)
8:30 AM Market Structure flipped bearish on VX Algo X3!
9:39 AM VXAlgo Market Structure flipped bearish - 9:31
9:40 AM VXAlgo NQ X1DD Sell Signal
11:00 AM VXAlgo NQ X1DD Sell Signal
12:40 PM VXAlgo NQ X1DD Sell Signal
12:50 PM VXAlgo NQ X3 Buy Signal
1:30 PM Market Structure flipped bullish on VX Algo X3!
🔑 Key Levels for Tomorrow
Above 6460 = Remain Bullish
Below 6440 = Bearish

SPX500 | Consolidation at Record Highs – Key Pivot 6468S&P 500 at Record Highs on September Rate Cut Hopes
Futures tracking the S&P 500 and Nasdaq held at record highs on Wednesday, supported by growing expectations that the Federal Reserve could resume its monetary policy easing cycle next month.
Technical Outlook:
The price is expected to consolidate between 6468 and 6425 until a breakout occurs.
Stability below 6468 would favor a bearish move toward 6425.
A 1H close above 6468 could push the price higher toward 6528.
Pivot: 6468
Support: 6437, 6425, 6389
Resistance: 6490, 6500, 6528

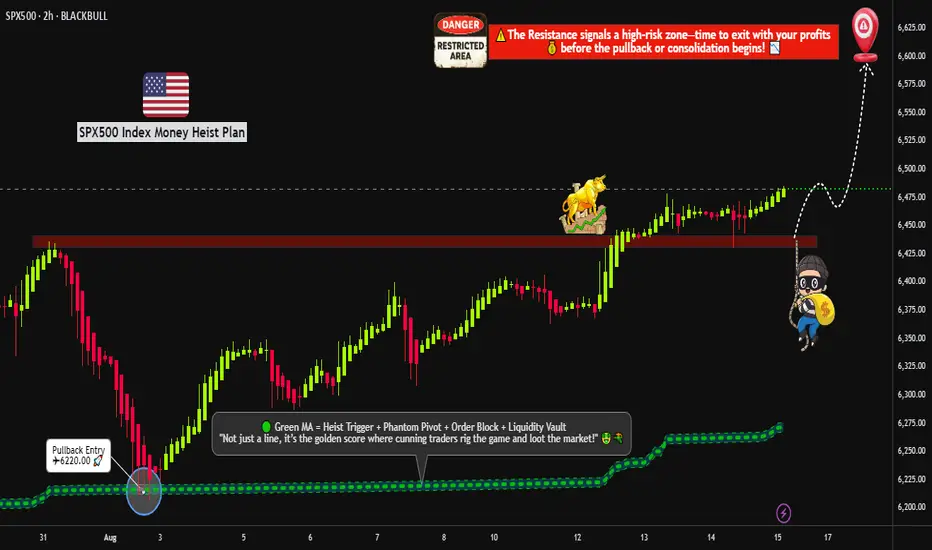
"US500 BREAKOUT – TIME TO LOAD LIMIT ORDERS FOR THE PUMP?"🔥🦹♂️ "SPX500 BANK HEIST – LAYERED BULL RAID IN PROGRESS!" 💰📈
(Thief Trader’s Multi-Limit Order Bullish Ambush – No Weak Hands Allowed)
📍 ASSET: US500 / SPX500 (S&P 500 INDEX)
🎯 HEIST PLAN: BULLISH BREAKOUT
💣 ENTRY: ANY PRICE LEVEL (Thieves use Layered Limit Orders – adapt like a pro!)
🔫 SAMPLE LAYERS: (Scale in like a boss!)
BUY LIMIT LAYER 1: 6475.00
BUY LIMIT LAYER 2: 6460.00
BUY LIMIT LAYER 3: 6440.00
(Add more layers if needed – flexibility is key!)
🛑 STOP LOSS: 6400.00 (Thief’s Emergency Exit – adjust based on your risk!)
🎯 TARGET: 6600.00 (First profit zone – trail or take gains!)
🦹♂️ THIEF TRADER’S MASTER PLAN:
"We don’t ask for permission – we take profits."
🔹 ENTRY TACTICS:
Use multiple limit orders (LAYERED STRATEGY) – like planting timed explosives at key levels.
No panic entries – thieves strike with precision, not emotion.
DCA if needed – but keep bullets for the real move.
🔹 STOP LOSS RULES:
6400 = Danger Zone – if price breaks, abort mission & regroup.
SL too tight? You’ll get stopped out by market noise. SL too wide? You’ll bleed. Find balance.
🔹 TAKE PROFIT STRATEGY:
First TP @ 6600 – secure partial profits.
Let runners ride with trailing stop – or full exit if momentum fades.
🚨 THIEF’S GOLDEN RULES:
✅ Only LONG – no revenge shorts, no greed traps.
✅ Trade in SILENCE – avoid high-impact news (CPI, NFP, Fed).
✅ Risk management = Survival – don’t blow your account on one play.
✅ BOOST & SHARE – if this plan helps, spread the word!
📢 FINAL WARNING:
"This is not financial advice – it’s a thief’s blueprint.
Plan your escape before entry. Market heists require discipline."
💬 COMMENT "ROBBING SPX" if you’re in!
🔥 LIKE & BOOST if you ride with the Thief Trader crew!
🦹♂️ THIEF TRADER OUT.
💸 STEAL SMART. GET RICH. REPEAT.
SPX trending....PPI comes in hot!PPI comes in super hot.
3.7% vs 2.9% exp YOY
0.9% vs 0.2% MOM exp
The SPX does gave higher upside targets but we are getting very stretched in the near term.
Liquidity has been flowing into crypto at full force and often moves of 125% in 2 months see profit taking.

Proprietary SupportIn this slowly but continuously updating idea I will be posting an interesting way to analyze charts. It is something old but also new, like duality.
We all know that the stock market continuously grows.
But it doesn't always grow.
For markets lie between worlds.
The reasonable and the unreasonable.
The free choice and the illusion of free choice.
Let me explain...
In micro scale, we seem to believe that the markets follow the "support / resistance" rule.
An (over)simplification necessary for us to comprehend the infinities of the quantum world.
There are lots of stories told in the picture above...
- Prices are chaotic and completely incomprehensible.
- We have to smooth-out to get a clearer picture.
- Is Support / Resistance real or a result of crowd psychology?
- At what point horizontal action "ceases" to exist and "trend" takes over?
Either we call it a "power law" or a Lin-log regression, charts in macro scale seem to trend.
So prices sometimes move with one "law" (support) and sometimes with another (trend).
Do we remember / know what is the foundation of price movement?
A century ago, Wyckoff came up with his theory of accumulation and distribution.
We can safely say that his research was not a result of crowd psychology. He backtested countless price charts, in a period (1920s) when trading was purely psychological, with traders having little experience to modern ideas of "trend", "support" etc.
Just like the new modern technology design principles, ahem aapl, technological information lies inside bubbles. Transparent but distorted. Clear but fuzzy. Duality once again.
Modern trading is a self sustaining loop. The "freedom" of our actions is trapped inside a bubble. Most of us "trade" with similar strategies, and end up in the mass pool of barely-profitable-investors. Unconventional strategists like Hedge Funds must have "alien" technology to overcome such psychological traps.
Back to the main chart:
It is one attempt to bring a new dimension to chart analysis. To merge these two worlds of "support" and "trend". I cannot possibly reach the expertise of massive corporations, but I can bodge something out, and I did.
Price charts can be analyzed with unconventional / proprietary methods to conclude into the chart above. It is a little rough but bear with me. I had to perform complex calculations which I couldn't compile into a Pine Indicator. There is a reason that the top lines are not exactly straight. Their calculations depend on a blend between micro and macro movements.
A couple of interesting charts to conclude the first update of this idea:
BTC Daily
BTC Weekly
A Perfect Fractal.
I hate bubbles. Mental ones, Soapy ones, Stock ones and UI ones.
- An angry Father Grigori.

Tomorrow’s Playbook: Levels, News Bias & Scenarios 08/14/2025Summary: Bias = Neutral→Bullish while above 6,464–6,466 and the 15m 200-EMA (6,459). A clean 5m/15m acceptance above 6,491/6,500 favors continuation; otherwise expect a data-driven sweep into 6,475–6,468 to test demand.
Scenarios & Triggers (rule-based)
1) Continuation breakout
• Trigger: 5m close > 6,491 → probe 6,496–6,500.
• Validation: 15m acceptance above 6,500 (no immediate rejection).
• Targets: 6,502–6,505 first; stretch 6,512/6,520 if momentum persists.
• Management: If price reclaims 6,491 from above after a retest, momentum likely intact.
2) Rotation to demand (buy-the-dip if structure holds)
• Trigger: Rejection at 6,489–6,491 with 5m close back inside range.
• Path: 6,482 → 6,475.5 → 6,468; watch order-flow absorption or an FVG fill inside 6,464–6,466.
• Validation: Bullish 5m close from the box and 15m structure holds above 6,459.
• Targets on bounce: Return to 6,489–6,491, then 6,496–6,500.
3) Bearish flip (lower-probability without data shock)
• Trigger (strict): 15m bearish confirmation and sustained acceptance below 6,459 (15m 200-EMA).
• Path: Open the door to a deeper mean-reversion leg toward prior breakout bases (next map would be built after the break).
• Note: No shorts without that 15m confirmation per protocol.
Educational only — not financial advice.
