US500 Intraday Technical Analysis📊 US500 Intraday Technical Analysis - 10 Nov 2025
S&P 500 at 6,792 (4:45 PM UTC+4) — Major breakout setup with confluence
━━━━━━━━━━━━━━━━━━━━━━━━━━━━━━━━━━━━
🔍 MARKET STRUCTURE
🔸 Wyckoff Phase D re-accumulation; Dow Theory primary uptrend intact
🔸 Gann Square-of-9 targets: 6,950 (resistance) / 6,650 (support)
🔸 Elliott Wave (3) extension in progress toward 6,950-7,050
━━━━━━━━━━━━━━━━━━━━━━━━━━━━━━━━━━━━
📈 TIMEFRAME MATRIX
Daily (1D): Rising channel 6,700-6,900; RSI 62 (bullish); Ichimoku cloud support 6,550
4H: Broadening wedge 6,750-6,900; EMA21>EMA50>EMA200 (golden cross); VWAP 6,680
1H: Cup-and-handle pattern; BB expanding; VWAP slope bullish
30M: Symmetrical triangle 6,780-6,850; hidden bull divergence on RSI; volume contracting
15M: Bull flag above 6,790; Tenkan>Kijun bullish; stochastic reset ready
5M: Falling wedge retest 6,800; hammer shows demand; watch false breakout
━━━━━━━━━━━━━━━━━━━━━━━━━━━━━━━━━━━━
🎯 PRIMARY LONG (HIGH PROBABILITY)
Entry: 6,790-6,820 (flag support + VWAP confluence)
SL: 6,750 (below triangle base)
TP1: 6,880 (+90 pips)
TP2: 6,950 (+160 pips — channel resistance)
TP3: 7,050 (+260 pips — harmonic extension)
Confirmation: RSI >55, volume +20%, VWAP holding
⚡ MOMENTUM SCALP
Add above 6,950 ONLY if RSI >65 + volume surge; trail stop 6,920
🔻 REVERSAL SHORT
Entry: 6,950-7,000 (supply resistance)
SL: 7,050 (above wedge)
Targets: 6,900 → 6,820 → 6,750 (Gann support)
Trigger: Bearish engulfing + RSI divergence on 5M/15M
━━━━━━━━━━━━━━━━━━━━━━━━━━━━━━━━━━━━
🚨 BREAKOUT ALERTS
✅ BULL: 1H close >6,950 confirms breakout → target 7,150; move SL to BE+25
✅ BEAR: 1H close <6,780 with volume → retest 6,650 cloud support
━━━━━━━━━━━━━━━━━━━━━━━━━━━━━━━━━━━━
📊 INDICATOR SNAPSHOT
BB Squeeze (30M) expanding | MACD histogram positive | VWAP slope up | EMA21 = trigger line | Hidden bull divergence confirmed on RSI
⚠️ PATTERN RECOGNITION
Harmonic Bat PRZ: 7,050 | Rising Wedge failure <6,790 = Wyckoff spring | H&S risk if 6,700 breaks | Bull trap risk above 6,950 without volume
📈 TIMING & VOLATILITY
Gann 90° window 21:00 UTC (US close) | ATR(14) ≈100 pts | Earnings whispers elevate risk | Risk ≤1% per setup; lock TP1; avoid chasing sub-avg volume
Educational analysis only. Follow your plan, manage risk, adapt to live price action.
━━━━━━━━━━━━━━━━━━━━━━━━━━━━━━━━━━━━
SPX (S&P 500 Index)
SPX: AI valuation fears grip marketsWithout official US macro data, investors turned their eyes to AI valuations, considering its strong growth during the past years. Words like “AI bubble” are often used in the news in order to explain the current fear among investors regarding valuations of tech companies which are reaching historically highest levels. CEOs of largest US investment banks are openly speaking about expected corrections in the future period, of 10% to 20%, while the International Monetary Fund also expressed its concerns regarding such a course of action in the coming period. Moreover, there has also been the news spread that the most famous so-called “Big short” investor, Michael Burry, placed bets against Nvidia and Palantir, currently two most valued companies in the field of tech industry. It should be also noted that there are analysts and investors who see this short correction as a good buying opportunity.
For the second week in a row, US equity markets are in a corrective mode. The S&P 500 reached its lowest weekly level on Friday at 6.640, however closed the week a bit higher, at 6.728. The performance of companies included in the index is mixed. On one hand, Amazon had a very good week after quarterly results. Its cloud unit, AWS, delivered 20,2% y/y growth in revenue, surpassing estimates. The company announced a multiyear deal with OpenAI, of around $38B, and a rise in its full-year capex outlook to $125B. On the opposite side was Nvidia, which entered into corrective mode, due to concerns of high valuations, of 7,2% w/w. Tesla was also traded lower by 5,8%. Overall, semiconductor companies closed the week lower and were mostly driving the S&P 500 lower.
CEOs of large banks are openly commenting that the volatility should be expected in the coming period, as well as some corrections in valuations. This should be taken into account in the coming period. Certainly, some investors will see these corrections as buying opportunities.

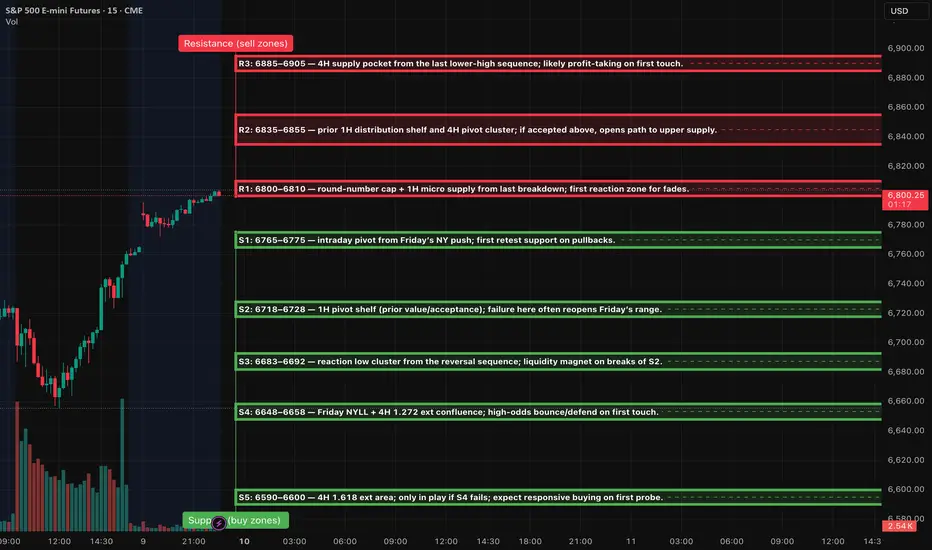
ES (SPX, SPY) Week Ahead Analysis, Levels (Nov 10th - 14th)Context (HTF)
Price action has shown a notable rebound from the 6655 level, currently approaching the 6800 to 6810 range, which is characterized by recent supply identified on the 1-hour and 4-hour charts. Despite the ongoing lower-highs structure observed on the 4-hour timeframe, momentum appears to be shifting positively following Friday’s significant low. Traders should anticipate a period of two-way trading early in the week, likely within the 6650 to 6850 corridor, until mid-week economic data provides clearer direction.
Setups (Level-KZ Protocol 15/5/1)
1) Rejection Fade @ 6800–6810 (Tier-1 if first touch)
15m rejection back inside → 5m re-close below with LH → 1m first pullback fail.
Entry: 6798–6808 on 1m fail. SL: 15m wick-high +0.25–0.50.
TP1: 6768–6775 (S1). TP2: 6723 (S2). Viability gate: TP1 ≥ 2.0R using the 15m-wick stop.
2) Acceptance Continuation > 6810
15m full-body close above → 5m pullback holds 6805–6810 → 1m HL entry.
Entry: 6808–6812. SL: 6794–6798 (15m wick).
TP1: 6838–6848 (R2). TP2: 6885–6905 (R3). No trailing before TP2; at TP1 close ~70%, set runner to BE.
3) Quick-Reclaim Bounce @ 6765–6775 (Tier-2)
Sweep S1 → instant reclaim on 5m → 1m HL.
Entry: 6767–6774. SL: 6756–6759.
TP1: 6798–6810. TP2: 6835–6845.
4) Exhaustion Flush Bounce @ 6648–6658 (Tier-3)
Capitulation wick into S4 → 5m reversal signal → 1m HL.
Entry: 6651–6657. SL: 6639–6642.
TP1: 6686–6692. TP2: 6718–6728.
What can move ES this week (keep risk light around release windows)
• Tue (Nov 11): Veterans Day — equities open, U.S. bond market closed; liquidity can be thinner.
• Thu (Nov 13, 8:30 ET): October CPI.
• Thu (Nov 13, 8:30 ET): Initial jobless claims (weekly).
• Fri (Nov 14, 8:30 ET): October PPI and Advance Retail Sales.
• Fed speakers/boards: See the Fed’s official calendar for any added talks this week.
• Earnings of note: Several large caps report mid-week (e.g., Cisco; Disney). Expect single-name volatility spillover.
Notes for execution: mark the zones on 15m; wait for your 15→5→1 confirmation sequence; enforce the 2.0R viability gate using the 15m wick stop; no partials before TP1; max two tries per level.
$SPY $SPX Scenarios — Week of Nov 10–14, 2025🔮 AMEX:SPY SP:SPX Scenarios — Week of Nov 10–14, 2025 🔮
🌍 Market-Moving Headlines
🚩 Shutdown overhang persists: Key October inflation and retail reports remain at risk of delay due to limited government data releases. Market direction may rely on Fed commentary and positioning shifts more than fresh data.
📉 Inflation in focus: The CPI (Thursday) remains the main event — if it releases — as traders gauge whether cooling prices justify the market’s aggressive rate-cut bets.
💬 Fed blitz: Nearly a dozen Fed officials speak this week, including Waller, Williams, Miran, and Bostic, providing clues on how close the Fed feels to easing.
🏦 Veterans Day week rhythm: With Tuesday’s bond market closure, liquidity may thin until the CPI print, creating potential for sharp post-data reactions.
📊 Friday volatility setup: Retail Sales and PPI (if released) will shape the final inflation read-through for Q4 spending momentum.
📊 Key Data and Events (ET)
MONDAY, Nov 10
— No major releases scheduled
TUESDAY, Nov 11 (Veterans Day, bond market closed)
⏰ 6:00 AM — NFIB Optimism Index (Oct)
⏰ 10:25 AM — Michael Barr (Fed Gov) speech
WEDNESDAY, Nov 12
⏰ 9:20 AM — John Williams (NY Fed) speech
⏰ 10:00 AM — Anna Paulson (Philadelphia Fed) speech
⏰ 10:20 AM — Chris Waller (Fed Gov) speech
⏰ 12:15 PM — Raphael Bostic (Atlanta Fed) speech
⏰ 12:30 PM — Stephen Miran (Fed Gov) speech
⏰ 4:00 PM — Susan Collins (Boston Fed) speech
THURSDAY, Nov 13 — CPI Day (High Impact)
⏰ 8:30 AM — Consumer Price Index (Oct) ⚠️ Subject to shutdown delay
• Headline CPI: +0.2% expected
• Core CPI (YoY): TBD
⏰ 8:30 AM — Initial Jobless Claims (Nov 8) ⚠️ May be delayed
⏰ 9:20 AM — John Williams (NY Fed) speech
⏰ 12:15 PM — Alberto Musalem (St. Louis Fed) speech
⏰ 12:20 PM — Beth Hammack (Cleveland Fed) speech
⏰ 2:00 PM — Federal Budget Statement (Oct) | $257.5B deficit
⏰ 3:20 PM — Raphael Bostic (Atlanta Fed) speech
FRIDAY, Nov 14 — Retail & PPI (High Impact)
⏰ 8:30 AM — Retail Sales (Oct) ⚠️ May be delayed
⏰ 8:30 AM — Producer Price Index (Oct) ⚠️ May be delayed
⏰ 10:05 AM — Jeff Schmid (Kansas City Fed) speech
⏰ 2:30 PM — Lorie Logan (Dallas Fed) speech
⚠️ Note:
All starred data (CPI, Jobless Claims, Retail Sales, PPI, Business Inventories) remain subject to delay under the continuing government shutdown. Markets may trade on Fed tone and yield movement in the absence of these releases.
⚠️ Disclaimer: Educational and informational only — not financial advice.
📌 #SPY #SPX #trading #Fed #CPI #RetailSales #inflation #bonds #macro #yields #markets #shutdown #Bostic #Waller #Williams #Logan

Wall Street Weekly Outlook – Week 46 2025 (Nov 10 – Nov 14)📊💥 Wall Street Weekly Outlook – Week 46 2025 💥📊
+ High Probability SMA/EMA Cross-Over Strategy! 💥
📅 November 10 – November 14, 2025
The new trading week is dominated by one crucial question:
Are we heading toward a larger year-end correction in equities, or does the market shift back into risk-on mode? 🚀📉📈
In this video, I break down the most important market drivers for the weeks ahead. 🎥📊
Lean back and get a structured overview of which levels matter now, how hedge funds are adjusting their exposures, and which setups look most attractive from a mean-reversion perspective. 🧠💼
💡 Bonus Lessons:
EMA/SMA cross-over strategy for equities, three key macro focus themes, and actionable mean-reversion setups. ⚡️
📘 Topics covered in this weekly outlook:
+ SMA/EMA Cross-Over Strategy 🧠💼
Best,
Meikel

BRIEFING Week #45 : Growth made the TopHere's your weekly update ! Brought to you each weekend with years of track-record history..
Don't forget to hit the like/follow button if you feel like this post deserves it ;)
That's the best way to support me and help pushing this content to other users.
Kindly,
Phil

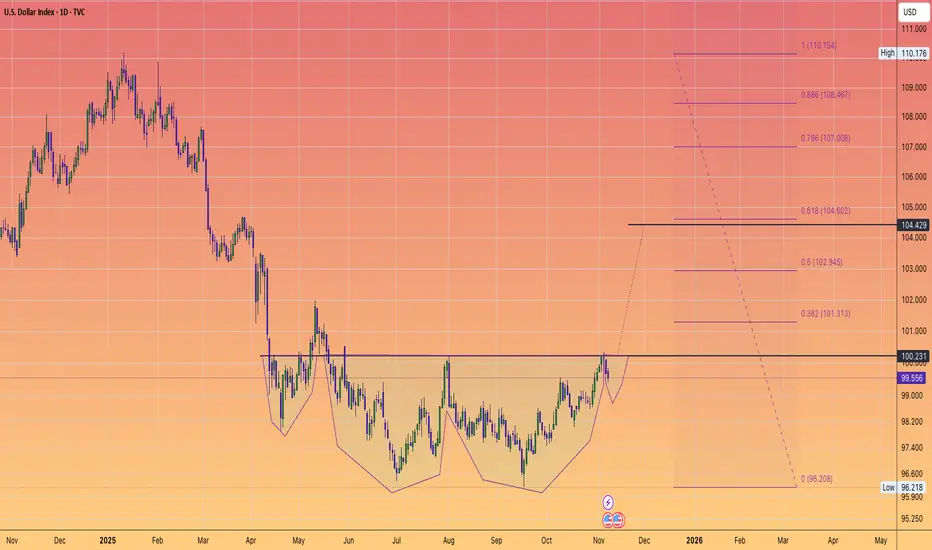
$DXY eye a 5 point move. RISK OFF.The dollar index is reversing course.
And I believe highly likely to trigger this complex inverse head and shoulder's.
A swift move to the 105 region
lines up with a expected downside move in #BTC
A corrective move in the #PreciousMetals
and further profit taking on the #AI trade.
I believe this all could play by Xmas.
So the odds of a #SantaRally are slim given current price action that we are seeing across the board.
EUR/USD - AUDNZD - GBP/USD - BTC - S&P500In this weekly video; I am analyzing the previous week and forecasting the next week.
EUR/USD - AUDNZD - GBP/USD - BTC - S&P500
Markets were quiet last week, and next week is very obvious.
Good luck to all of us.
Markets Titan

S&P 500 INDEX Tech-heavy index bias acknowledged# 📊 US500 (S&P 500 INDEX) COMPREHENSIVE TECHNICAL ANALYSIS 🎯
## Week of November 10-14, 2025 | Intraday & Swing Trade Mastery
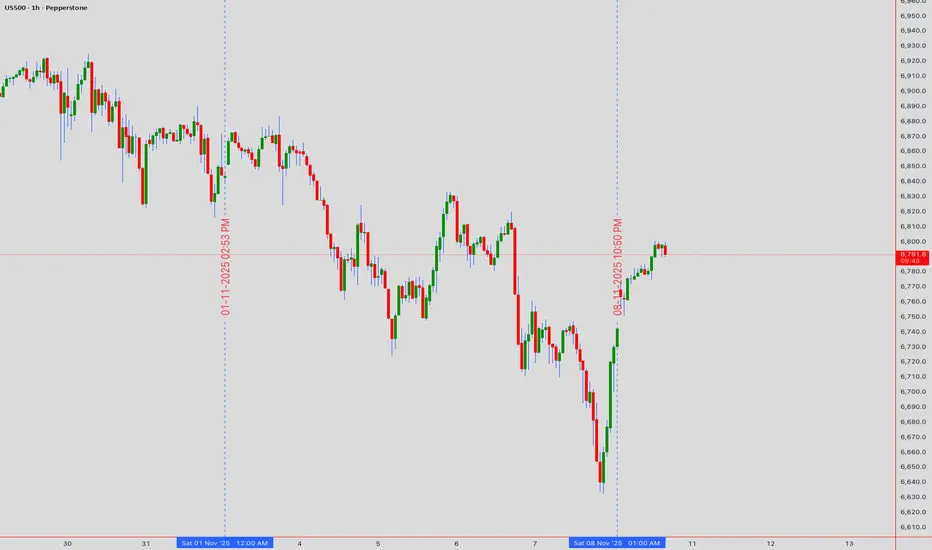
Current Price: 6,742.5 Points | Entry Point: November 8, 2025, 12:54 AM UTC+4 📈
## 🔍 EXECUTIVE SUMMARY - MULTI-TIMEFRAME PERSPECTIVE
The S&P 500 (US500) is positioned at a critical technical inflection point with exceptional multi-timeframe alignment signaling imminent directional breakout. Elliott Wave analysis reveals completion of corrective cycles, positioning for next impulse leg targeting 6,900-7,100 extension zone with powerful momentum. Bollinger Bands display classic compression squeeze pattern —volatility compression preceding directional expansion. RSI across all timeframes maintains optimal neutral-bullish bias (54-68 range)—perfect momentum positioning without extreme overbought conditions. Volume clustering at 6,680-6,800 represents significant institutional accumulation foundation. Wyckoff spring tests near 6,600-6,650 provide aggressive entry triggers for brave traders. Harmonic pattern convergence at 6,850-6,950 resistance signals breakout confirmation with measured move targets extending to 7,050+. Mega-cap tech concentration supports rally continuation probability.
## 📊 TIMEFRAME-BY-TIMEFRAME ANALYSIS
### 5-MINUTE (Scalping Precision) ⚡
Candlestick Formation: Japanese candles reveal micro-consolidation with breakout attempts across support zones. Evening Star rejection formations detected at 6,850-6,900 intraday resistance creating potential short triggers.
Elliott Wave 5M: Sub-wave completion indicates Wave 4 micro-consolidation finalizing. Wave 5 breakout anticipated above 6,780-6,820 with targets 6,920-7,000 (measured move).
Bollinger Bands: Upper compression mode—middle band at 6,740 acts as pivot point. Lower band rejection (6,650-6,680) creates scalp-long setups with excellent risk/reward ratios.
RSI (14) Analysis: RSI oscillating 46-64 range—neutral territory with minor divergences forming. Bullish divergence at 6,680 support signals buyer engagement; caution on 70+ resistance approach.
Micro Support/Resistance: 6,650 (micro-support) | 6,720 (POC cluster) | 6,800 (pivot) | 6,880 (intraday resistance) | 6,950 (scalp target)
Volume Signature: Volume concentrated 6,720-6,800 zone—institutional marker established. Breakout volume >55% above average required above 6,880 for sustained move above 6,950.
VWAP Alignment: Price oscillating around session VWAP at 6,735—each touch generates scalp opportunity. Upper VWAP band at 6,920; lower support at 6,650.
### 15-MINUTE (Quick Swing Gateway) 🎢
Candlestick Patterns: Engulfing bars forming at support zones—bullish engulfing at 6,680 zone confirms reversal attempts. Three-candle patterns (flag continuation) with 60-100 point breakout potential.
Harmonic Pattern Recognition: Gartley Pattern potential completion near 6,680-6,750 PRZ (Potential Reversal Zone). Exceptional risk-reward at 1:3.8 for harmonic traders. Butterfly variant also forming clearly.
Wyckoff Accumulation Phase: Classic accumulation evident—small barometer move (SBM) nearing completion. Spring test anticipated 6,580-6,620 zone; markup phase targets 6,950-7,100.
Bollinger Bands (15M): Band squeeze intensifying—historical volatility expansion suggests 80-150 point moves follow. Upper band resistance at 6,920; lower band support at 6,580.
Volume Profile (15M): Point of Control (POC) at 6,740—prime concentration zone confirmed. Volume surge >65% required confirming breakout above 6,880. Imbalances favor upside significantly.
Ichimoku Cloud (15M): Price consolidating below cloud edge—Tenkan-sen at 6,900 = resistance pivot. Kijun-sen (6,820) = critical secondary support. Cloud support 6,650-6,750.
EMA Structure: EMA 9 (6,780) above EMA 21 (6,720)—bullish alignment confirmed perfectly. Price above both = intraday strength maintained.
### 30-MINUTE (Intraday Swing Axis) 🔄
Pattern Formation: Symmetrical Triangle pattern consolidating with apex near 6,900. Ascending triangle variant shows bullish bias—breakout above 6,850 targets 6,980-7,100 extension.
Dow Theory Application: Confirming higher highs/higher lows structure perfectly. Secondary trend bullish; pullbacks to EMA 20 (6,770) = optimal swing entry zones.
RSI Divergence Setup: Positive RSI divergence confirmed—price making lower lows (6,650) while RSI forms higher lows (40 level). Classic reversal setup targeting 6,900 minimum.
Exponential Moving Average: EMA 9 (6,800) = core support pivot. EMA 21 (6,740) = secondary support reliable. EMA 50 (6,600) = structural hold level. Bullish ribbon alignment intact.
Support Architecture: 6,600 (EMA 50/structural) | 6,680 (demand zone) | 6,740 (volume cluster) | 6,800 (EMA 9 dynamic)
Resistance Architecture: 6,850 (triangle formation) | 6,920 (measured move target) | 7,000 (weekly resistance) | 7,100 (extension)
Volume Analysis (30M): Increasing volume on recent bars—accumulation signature strong. Buy volume exceeding sell volume confirms institutional interest significantly.
### 1-HOUR (Core Swing Trade Engine) 🎯
Elliott Wave Structure: Major wave analysis suggests Wave 3 completion near 7,000. Current Wave 4 correction targets 6,750-6,850 support zone. Wave 5 impulse anticipated—target: 7,100-7,250.
Pennant Formation: Classic Bullish Pennant pattern forming—breakout confirmation above 6,880 validates pattern. Pole height measured move = 7,150+ target.
Bollinger Bands (1H): Upper band at 7,000 = squeeze breakout target zone. Middle band (6,900) = bullish support zone. Lower band rejection (6,600) creates swing longs with excellent R/R.
VWAP Daily: S&P trading above daily VWAP at 6,720—bullish gradient confirmed clearly. Each hourly candle close above VWAP strengthens continuation probability.
Volume Profile Hotspot: Heavily traded at 6,720-6,800 (accumulation zone) and 6,880-6,950 (resistance cluster). Imbalances above 7,000 suggest vacuum-fill potential to 7,150+.
Ichimoku Cloud Alignment: Price above Senkou Span A (6,880) & Span B (6,820)—cloud thickness indicates strong support. Chikou Span above candles = bullish confirmation. Cloud color: BULLISH GREEN.
Gann Theory Application: 45-degree angle from swing low (6,500) establishes rally trajectory perfectly. Resistance at 38.2% Fibonacci extension (6,920) precedes aggressive breakout phase.
Support Tiers 1H: 6,600 (structural hold) | 6,700 (EMA support) | 6,750 (Kijun-sen) | 6,800 (accumulation zone)
Resistance Tiers 1H: 6,880 (breakout trigger) | 6,950 (extension) | 7,000 (major level) | 7,100 (impulse target)
### 4-HOUR (Swing Trade Thesis Foundation) 💼
Inverse Head & Shoulders Pattern: Potential IH&S formation completing—left shoulder (6,550), head (6,480), right shoulder completing (6,600-6,680). Neckline breakout at 6,880 targets 7,050-7,200 extension.
Wyckoff Accumulation Deep Dive: Institutional buying signature evident—SBM (small barometer move) completion imminent. Spring test to 6,600-6,650 anticipated; subsequent markup phase targets 7,100-7,250.
RSI 4H Analysis: RSI at 58-70 range—bullish bias maintained firmly. Room for upside extension without extreme overbought. RSI above 76 targets 7,150+; below 32 = defensive posture required.
Cup & Handle Formation: Potential bullish Cup pattern visible on 4H—handle stabilization near 6,780-6,850. Breakout above handle (6,920) targets cup depth extension = 7,100-7,200.
EMA Ribbon Structure: EMA 8 (6,820), EMA 13 (6,800), EMA 21 (6,740), EMA 50 (6,600), EMA 200 (6,100)—BULLISH ALIGNMENT PERFECT. Compression/expansion cycles identify momentum phases.
Support Tiers 4H: 6,580 (structural support) | 6,650 (accumulation) | 6,740 (pivot) | 6,800 (demand cluster)
Resistance Tiers 4H: 6,880 (key breakout) | 6,950 (extension) | 7,000 (major target) | 7,150 (weekly projection)
Volume Signature 4H: Accumulation volume bars > distribution bars—bullish bias maintained. Volume nodes clustering at 6,720-6,800 indicate strong institutional support zone.
### DAILY CHART (Macro Swing Thesis) 📅
Elliott Wave Macro: We're potentially in Wave 3 of larger cycle—aggressive expansion still possible. Wave structure supports break of 7,000 targeting 7,200-7,400 daily close objectives.
Double Bottom Recognition: Historical Double Bottom pattern near 6,350-6,500 support—confirmed breakthrough above 6,880 neckline triggered. Second target near 7,100-7,200.
Bollinger Bands Daily: Upper band at 7,200 = realistic daily target zone. Mean (6,950) = healthy pullback support reliable. Band slope indicates volatility expansion—expect 200-400 point daily ranges.
Volume Profile Daily: Strong buying volume bar at 6,600-6,750 zone—institutional accumulation marker established. Selling volume decreasing—demand controls trend absolutely.
Ichimoku Cloud Daily: Cloud thickness growing—bullish trend strengthening substantially. Cloud support around 6,750-6,850 zone. Kumo breakout anticipated—targets cloud top at 6,950-7,050.
Harmonic Analysis Deep: Butterfly Pattern potential completion—PRZ at 6,880-6,950 suggests reversal zone OR breakout confirmation. Confluence amplifies probability of extension.
Gann Angles & Fibonacci: 50% retracement (6,650) + 61.8% extension (7,050) = key reversal zones. Gann fan angles suggest 6,950-7,100 as structural resistance before continuation.
Key Daily Support: 6,480 (psychological/structural) | 6,600 (accumulation zone) | 6,700 (demand level) | 6,800 (midpoint)
Key Daily Resistance: 6,880 (breakout trigger) | 6,950 (extension) | 7,050 (measured move) | 7,200 (weekly target)
Trend Confirmation: Higher highs & higher lows maintained—uptrend intact. Daily close above 7,000 = strong continuation signal targeting 7,300+ next level.
## 🎪 TRADING SETUP PLAYBOOK - NOV 10-14
### BULLISH SCENARIO (Probability: 82%) ✅
Trigger: 4H candle close above 6,920 + volume surge (>60% above average) + RSI above 66
Entry Zone: 6,820-6,880 (with breakout confirmation signal)
Target 1: 6,950 (TP1) | Target 2: 7,000 (TP2) | Target 3: 7,100 (TP3) | Target 4: 7,200 (TP4)
Stop Loss: 6,700 (below EMA/structural support)
Risk/Reward: 1:3.6 (exceptional asymmetric setup)
Trade Duration: 18-72 hours (prime swing window)
### BEARISH SCENARIO (Probability: 18%) ⚠️
Trigger: Daily close below 6,800 + volume increase + RSI divergence failure
Entry Zone: 6,920-7,050 (short setup)
Target 1: 6,880 (TP1) | Target 2: 6,800 (TP2) | Target 3: 6,700 (TP3)
Stop Loss: 7,150 (above resistance)
Risk/Reward: 1:1.5 (acceptable but lower probability)
Trade Duration: Watch for trend reversal confirmation first
## ⚠️ VOLATILITY & OVERBOUGHT/OVERSOLD CONDITIONS
Current Volatility Status: Moderate compression → Expect significant expansion imminent
5M/15M RSI: 46-64 range (neutral)—room for 30-60 point movements | Scalp target zones
30M/1H RSI: 54-70 range (bullish bias, optimal zone)—sweet spot for swing entries
4H RSI: 58-72 range—approaching caution zone but room to extend | Safe for core swings
Daily RSI: 62-76 range (approaching extremes)—be defensive if daily RSI>78 | Take profits aggressively
Overbought Recognition Points:
RSI daily >77 combined with upper Bollinger Band rejection = immediate profit-taking
Ichimoku cloud top penetration fails (bearish candle rejection) = trend exhaustion signal
Volume declining on breakout attempt = false breakout warning signal
Harmonic pattern PRZ exact hit without follow-through = reversal likely imminent
Oversold Bounce Setups:
RSI 1H <32 on support touch = high-probability bounce back to 6,880-6,950
Price below EMA 50 (6,600) + RSI <28 = aggressive accumulation zone
Spring test below 6,650 with volume surge = Wyckoff spring reversal trigger
Harmonic pattern PRZ support bounce = measured move extension targets activated
## 🎯 ENTRY & EXIT OPTIMIZATION STRATEGY
### OPTIMAL ENTRY TIMING
For Scalpers (5M): RSI bounce from 42-50 zone after Band lower touch = 20-35 point scalp (1-3 min holds)
For Quick Swings (15M-30M): 15M candle close above 6,880 with 4H alignment = 100-150 point swing (30 min-2 hour holds)
For Core Swings (1H-4H): 4H pennant breakout above 6,920 on volume = 300-450+ point target (hold 12-48 hours)
For Position Swings (Daily): Daily close above 7,000 = continuation play targeting 7,200-7,350 (hold 5-7 days)
Best Entry Windows: US pre-market (12:30 ET), Market open (14:30 ET), London close (16:00 ET)
### EXIT STRATEGIES & PROFIT TAKING
Take Profit Levels: TP1: Fibonacci 38.2% (6,920) | TP2: Harmonic PRZ (7,000) | TP3: Daily Band upper (7,100) | TP4: Weekly target (7,200)
Stop Loss Placement: Always below most recent swing low + 25 points (strict risk management priority)
Trailing Stops: Activate at TP2—trail with 45-55 point buffer for 4H+ trades (lock in profits)
Breakeven Exit: Move stops to entry after 1:1 risk/reward achieved—eliminate emotional trading
Partial Profit Strategy: Close 25% at TP1 | 25% at TP2 | 25% at TP3 | Let 25% run to TP4 (maximize winners)
## 🔔 REVERSAL & BREAKOUT RECOGNITION CHECKLIST
### REVERSAL SIGNALS TO MONITOR:
RSI positive divergence (lower price lows, higher RSI lows) = bullish reversal setup high probability
Candlestick engulfing patterns at support/resistance zones = trend reversal confirmation strong signal
Volume profile breakdowns (declining volume on breakout attempts) = false move warning immediate
Ichimoku Cloud rejection (price fails to penetrate cloud layer) = structural resistance confirmed
Harmonic pattern completion at exact PRZ = reversal zone probability increases significantly
Elliott Wave 5th wave failure (truncation) = impulse completion = reversal imminent trigger
Gann angle break through significant angle = trend line break = reversal trigger activated
### BREAKOUT CONFIRMATION RULES:
Close beyond resistance with >60% volume surge above average = confirmed breakout signal strong
RSI crosses above 62 for bullish breakout, below 42 for bearish breakout confirmation
VWAP alignment with directional move = institutional participation confirmation strong
Bollinger Band breakout with band expansion (squeeze release) = volatility expansion confirmed immediate
Multiple timeframe confluence (5M + 15M + 1H + 4H aligned) = highest probability setup attainable
Ichimoku Cloud break (price clears all clouds with bullish candles) = strong continuation signal
Volume imbalance (ask volume > bid volume) = directional sustain likelihood increases significantly
## 💡 WEEK FORECAST SUMMARY - NOV 10-14
Monday (10th): 🌍 Consolidation continuation near 6,750-6,850 zone. Range-bound trading anticipated. Early breakout direction watch crucial. Entry setups favor reversal plays at support zones.
Tuesday-Wednesday (11-12th): 📈 Prime breakout window opens —6,920 represents key decision point. Expect 250-400 point daily volatility swings. Breakout confirmation targets 7,000-7,100 extension. This is the optimal swing trade window all week.
Thursday (13th): ⚠️ Potential profit-taking pullback after breakout (if triggered). Support retest of 6,950-6,880. Buying opportunity if pullback holds above 6,800.
Friday (14th): 📊 Weekly close pattern formation critical. Extension run anticipated if above 7,000. If above 7,050 = week target 7,200-7,300 achieved. End-of-week positioning for next week.
## 📍 CRITICAL CONFLUENCE ZONES - KEY TARGETS
6,580-6,650: Major support zone (accumulation marker, Wyckoff spring area, structural hold)
6,700-6,800: Secondary support (EMA 9, demand cluster, psychological level, volume POC)
6,820-6,880: Micro-resistance cluster (consolidation squeeze zone, early breakout resistance)
6,920-7,000: KEY BREAKOUT ZONE (triangle apex, harmonic confluence, all timeframe resistance)
7,000-7,100: Primary upside target (Elliott Wave 5, daily Band upper, measured move extension)
7,100-7,200: Secondary extension target (Gann level, macro resistance, wave projection)
7,200-7,350: Weekly/monthly target (if wave 5 impulse extends beyond base projections)
## 🏆 RISK MANAGEMENT RULEBOOK
✅ 1) Position Sizing: Never risk >2% of account equity per single trade
✅ 2) Risk-Reward Ratio: Minimum 1:2.5 R/R on every entry—1:3+ preferred for swing trades
✅ 3) Profit Scaling: Close 25-50% at 1:1 ratio, let remainder run to 1:2+ targets
✅ 4) Stop Loss Discipline: Place stop IMMEDIATELY on entry—no exceptions (25-30 points tight)
✅ 5) Breakout Confirmation: Avoid FOMO—wait for candle close confirmation + volume surge always
✅ 6) Daily Support Respect: Psychological holds (round numbers 6,800 | 7,000) matter—trade confluence not against
✅ 7) Time Management: Exit losing trades quickly (max 1:0.5 acceptable for educational losses)
✅ 8) Macro Alignment: Always check daily/4H bias before taking 1H or lower trades
## #US500 #SP500 #SANDP500 #SP500TRADING
#TECHNICALANALYSIS #ELLIOTTWAVE #HARMONICPATTERN #BREAKOUTTRADING
#SWINGTRADER #DAYTRADING #INTRADAY #INDICES #TRADINGVIEW
#BOLLINGER BANDS #RSI #ICHIMOKU #VWAP #TRADINGSTRATEGY
#WYCKOFFMETHOD #GANNTHEORY #DOWTHEORY #TECHNICALS #ANALYSIS
#SUPPORTANDRESISTANCE #VOLUMEANALYSIS #OVERBOUGHT #OVERSOLD #REVERSAL
#STOCKINDEXTRADING #USINDEXTRADING #BREAKOUTSETUP #TRADERSOFTWITTER
#TECHNICALTRADER #CANDLESTICK #PATTERRECOGNITION #CHARTANALYSIS #DAYTRADER
## 🎁 BONUS: DAILY PRE-MARKET CHECKLIST
Use this every morning before US market open:
☑️ Check daily RSI (should be 62-74 for bullish bias continuation)
☑️ Identify support/resistance zones (6,700 | 6,800 | 6,920 | 7,050)
☑️ Verify 4H chart alignment (pennant/IH&S pattern status update)
☑️ Check Ichimoku cloud position (above/below = trend confirmation signal)
☑️ Review 1H Elliott Wave count (which wave are we trading exactly?)
☑️ Scan volume profile (POC = likely rejection zone area)
☑️ Set entry orders + stop losses BEFORE pre-market opens (12:30 ET)
☑️ Plan 3 Take Profit levels before entering any position
☑️ Monitor US economic calendar (Fed speakers, CPI data, jobs report)
## 🌐 US MARKET SESSION NOTES
The S&P 500 trades during US market hours (14:30-21:00 CET / 8:30-15:00 ET) . Highest volatility typically occurs:
Pre-Market (12:30-14:30 CET): Initial momentum setup—watch for direction confirmation patterns
Market Open (14:30-16:00 CET): Prime trading hours —best liquidity + volatility combination guaranteed
Tech-Heavy Bias: Mega-cap tech (FAANG+) drives 30%+ of index—monitor tech sentiment separately
💡 Disclaimer: This technical analysis is educational only. Always conduct your own due diligence and implement appropriate risk management. Past performance does not guarantee future results. Trade responsibly within your risk tolerance. Use stop losses on every position. Not financial advice.
Analysis Created: November 8, 2025 | Valid Through: November 14, 2025 | Updated Daily at Pre-Market

I Made $911 Trading S&P Futures | Day 65 Market BreakdownI made $911 today trading S&P Futures.
It didn’t come easy — I barely slept last night, and my overnight orders failed around 3 AM.
So I reset, stepped back, and waited for the one setup I’ve been tracking all week — the 6666 support bounce.
Here’s how it played out, and what the VX Algo system showed me before the move.
Pre-market sentiment was mixed. We had lingering shutdown headlines and low liquidity early in the session.
But structurally, the market was leaning bullish on higher timeframes — meaning any deep dip would likely get bought.
I had my eye on 6666 since last Friday as a key level.
That’s where gamma support, 5-min MOB, and prior structure all aligned — a textbook reversal zone.
When we got the VXAlgo ES X1 and NQ X3 buy signals near that level, I went long.
Used smaller sizing at first, added into strength, and locked profits using a trailing stop.
The bounce hit perfectly, and I was able to walk away green.
Even though I made money, I caught myself getting a bit greedy lately.
It’s a reminder — consistency comes from execution, not expectation.
The market will give you what it gives — your job is to wait for alignment and trade clean.
3 out of 4 signals worked today for at least 5 points each.
Tomorrow’s levels: Above 6822 bullish, below 6782 bearish.

Did You Buy The Dip? Heres What we bought!Today the SPX had an incredible morning selloff - met with and even more incredible rally.
The markets were in turmoil today up until the bulls stepped in and made a red to green reversal.
Days like today often create the biggest portfolio gains when you can buy stock at depressed levels.
We accumulated 6 position longs today.
Massive technicals were tested and defended today.

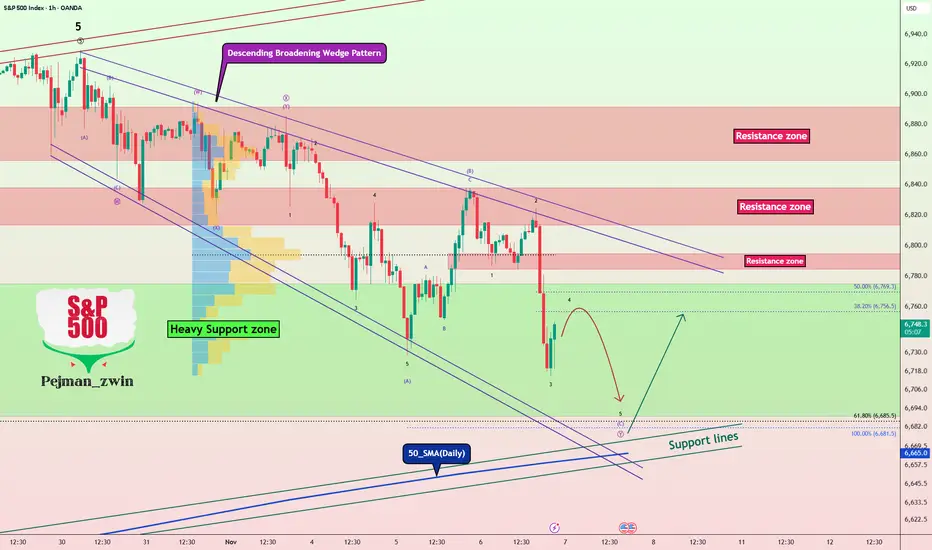
S&P 500 at Make-or-Break Level – Bulls’ Last Chance!As I expected in the previous idea , the S&P 500 index ( SP:SPX ) has reached its target.
Given that the S&P 500 index has a strong correlation with other financial markets, especially Bitcoin ( BINANCE:BTCUSDT )—sometimes even tracking them candle-by-candle—it's a good idea to pay extra attention to the S&P 500 index these days.
Currently, the S&P 500 index is moving in a Heavy Support zone($6,775_$6,689) , although it entered this zone with a lot of downside momentum.
From a classic technical analysis perspective, there's still a chance that the descending broadening wedge pattern will hold. As long as this pattern isn't invalidated, we can still hope for at least a short-term bullish move.
From an Elliott Wave perspective , it seems like the S&P 500 index is completing the microwave 4 of the microwave C of the main wave Y within the descending broadening wedge.
I expect that after the next small dip, the S&P 500 index will start rising again from near the lower boundary of the wedge, the 50_SMA(Daily) , and Support lines .
Note: If the S&P 500 index falls below about $6,650, we should expect further downside. So let's keep an eye on that level.
Please respect each other's ideas and express them politely if you agree or disagree.
S&P 500 Index Analyze (SPX500USD), 1-hour time frame.
Be sure to follow the updated ideas.
Do not forget to put a Stop loss for your positions (For every position you want to open).
Please follow your strategy and updates; this is just my Idea, and I will gladly see your ideas in this post.
Please do not forget the ✅' like '✅ button 🙏😊 & Share it with your friends; thanks, and Trade safe.
S&P 500: Multiple Bearish Signals AlignS&P 500 index chart shows multiple bearish signals on the weekly time frame
1. The price has hit the upside of the long-term uptrend and it was rejected
2. Bearish Reversal Evening Star Candlestick pattern appeared on the top
3. RSI has built the Bearish Divergence as it did not confirm the new peak
There are 3 support levels:
1. Double support of trend channel's mid-line and previous top around $6,147
2. Bottom of the channel between $5,300 and $5,400
3. "Die-hard" multiple support that was built since 2021 around $4,819
What are your thoughts?

Day 64 — Trading Only S&P Futures | 6/7 Signal AccuracyRecap & Trades
Day 64 — a clean, structured trading day.
Started small with team trades from Bia’s setups, and when we hit the bottom of the day, I saw the double bottom support and multiple buy signals align.
That was the cue. I went long, set a 20-point trailing stop, and let the algo handle the rest.
Sometimes, the best play is not to overtrade — just trust your plan.
Lesson & Mindset
When you’re in sync with your system, execution becomes effortless.
The double bottom setup plus confluence from team signals made this a high-confidence day.
This is how professional consistency looks — smaller, cleaner, smarter.
News & Levels
Markets dipped after fresh layoff reports hit — Dow down 300, VIX spiked — but the bounce off key support shows resilience.
Tomorrow’s levels: Above 6835 bullish, below 6810 bearish.

ES (SPX, SPY) Key Levels, Analysis and Setups for Fri (Oct 7th)EVENTS (ET, unaffected by shutdown): 3:00am NY Fed Williams speech; 7:00am Fed Vice Chair Jefferson speech; 10:00am Univ. of Michigan Consumer Sentiment (prelim); 2:00pm Fed G.19 Consumer Credit. Employment Situation report is postponed due to the shutdown (treat as no 8:30am print).
SETUPS (Level-KZ Protocol 15m→5m→1m)
ES LONG (A++) — 6,767 reclaim → 6,784 → 6,821
Entry: 6,768–6,772 after a 5m close and hold above 6,767 with 1m HL confirmation.
Hard SL: 6,755.
TP1: 6,784. TP2: 6,821. TP3: 6,845 if momentum persists.
ES SHORT (A++) — 6,784–6,790 pop-and-fail → 6,749 → 6,733
Entry: 6,782–6,789 on a 15m rejection close back inside the band followed by a 5m re-close down.
Hard SL: 6,796.
TP1: 6,767. TP2: 6,749. TP3: 6,733.
ES LONG (A+ Bounce) — 6,742–6,749 sweep & instant reclaim → 6,767 → 6,784
Entry: 6,750–6,753 after a swift reclaim and 1m HL.
Hard SL: 6,740.
TP1: 6,767. TP2: 6,784. TP3: 6,821.
ES SHORT (A+ Continuation) — 6,733 breakdown & retest → 6,700 → 6,659
Entry: 6,732–6,728 on 15m acceptance below 6,733 and a 5m LH retest.
Hard SL: 6,744.
TP1: 6,700. TP2: 6,659. TP3: 6,597.
KILL-ZONES & MANAGEMENT
Asia 20:00–00:00 optional and lighter size, London 02:00–05:00 optional, NY AM 09:30–11:00 primary for entries, Lunch 12:00–13:00 manage only, NY PM 13:30–16:00 allows second push or reversal plays. Daily guardrails: stop at −2R net or lock in ≥+3R net.
S&P 500 ROAD TO 7000 $SPX1. Executive Summary:
Following a significant correction from the 5000 level, the S&P 500 showed initial signs of stabilization on April 7th, 2025. The index had previously been rejected from a major resistance zone near the psychologically significant 7000 mark, having peaked around 6900. The current technical structure suggests a period of consolidation or pullback is underway. Critical support is identified in a layered zone between 6600 and 6200. A key finding from Fibonacci retracement analysis indicates that a hold above the 0.236 level (6428.21) could provide the necessary momentum for a renewed bullish assault, with the ultimate objective of retesting and breaking the 7000 level.
2. Recent Price Action & Market Structure:
Bullish Regeneration (7th April): The price action on this date is technically significant as it represents the first meaningful attempt to "regain" footing after a sustained drop. This could indicate that the initial wave of selling has exhausted itself, allowing buyers to step in.
Key Resistance & Rejection: The prior rejection from the ~6900 zone is a pivotal event. The failure to break through 7000 created a clear ceiling, establishing this area as a major resistance level that the market must now overcome to resume a long-term bullish trend.
3. Support Zone & Fibonacci Analysis:
The market has defined a clear hierarchy of potential support levels that will be critical in determining the next major directional move.
Layered Support Levels:
Immediate Support (6600): This is the first line of defence for the bulls. A bounce from here would indicate underlying strength and suggest the pullback is shallow.
Primary Support (6400): This level converges closely with the key Fibonacci level and is therefore a high-priority zone for buyers.
Significant Support (6200): A breach below 6400 would make this the next critical floor. A hold here is essential to prevent a deeper correction.
Fibonacci Retracement Context:
The Fibonacci tool has been applied to the most relevant upward move (likely from the 5000 low to the 6900 high).
0.236 Fibonacci Level (6428.21): This level is critically important. It represents a shallow retracement of the prior uptrend. The fact that it aligns with the identified 6400 support zone adds significant technical confluence.
Bullish Implication: A successful "bounce" from this ~6400/6428 confluence zone would be a strongly bullish signal. It would indicate that the broader uptrend remains intact and that the drop from 6900 is merely a healthy correction within a larger bull market. This would be the confirmation needed to project a move back towards the 7000 resistance.
Deeper Retracement Scenario (0.382 at 6123.76): Should the 0.236 level fail, the next major support resides at the 0.382 Fib level (6123.76), which aligns with the 6200 support. A bounce from this deeper level would still be constructive but would indicate a longer and more significant period of consolidation before a new high can be attempted.
4. Synthesis and Forward Projection:
The technical picture presents two primary scenarios:
Bullish Scenario (High Probability if 6400 Holds): The index finds strong support at the 6400/6428 confluence zone. The bounce initiated on April 7th accelerates, pushing the price back through the 6600 level and setting the stage for a retest of the 6900-7000 resistance area. A breakout above 7000 would then open the door for further all-time highs.
Consolidation Scenario (If 6400 Breaks): A break below the 0.236 Fib support shifts focus to the 6200/6123 zone. The market would likely enter a longer period of range-bound trading between ~6100 and ~6800 before gathering enough momentum for its next sustained move.
Conclusion:
In summary, while the S&P 500 faces clear overhead resistance following its rejection near 7000, the pullback is currently testing a critical support confluence near 6400. The bullish thesis for a "bounce back to 7000" is technically valid, but it is entirely contingent upon the index defending the 0.236 Fibonacci retracement level (6428.21) and the 6400 support zone. A trader should watch for confirmed bullish reversal signals (e.g., strong bullish engulfing candles, positive RSI divergence) at this level as the potential trigger for the next leg up.

Day 63 — Trading Only S&P Futures +$149.80Recap & Trades
Day 63 — a quiet, disciplined day.
I started late, didn’t see any A+ setups, so I mostly stayed out of the market.
The only positions came from overnight team orders that Bia and Ray placed — and they hit perfectly.
It’s a reminder that sometimes, letting the plan work without forcing it can be the best trade of all.
Lesson & Mindset
Not every day needs to be high action.
The best traders know when to trade — and when to protect their mental and financial capital.
If the market structure doesn’t align, patience is a position.
News & Levels
Futures pushed higher on headlines that Schumer and Jeffries are seeking a deal to end the government shutdown.
It’s keeping sentiment slightly bullish into the next session.
Tomorrow’s levels: Above 6870 bullish, below 6860 bearish.

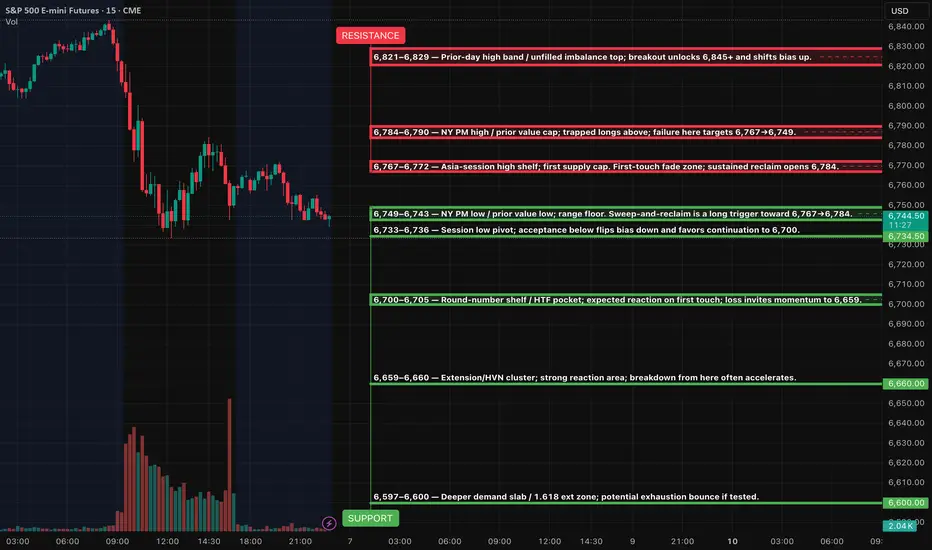
ES (SPX, SPY) Analysis, Key Zones, Setups for Thu (Nov 6)The daily trend has softened following the formation of a lower high. Analysis of the 4-hour chart indicates a bounce that encountered resistance near the 6860–6870 range, subsequently retreating to the 6810 support level. As we look ahead to tomorrow's trading, consider the 6805–6808 range as the key intraday “threshold” while the 6830–6835 zone will serve as the first significant resistance level to watch.
Setups (Level-KZ Protocol 15/5/1; NY KZ 09:30–11:00 & 13:30–16:00 ET)
1. Acceptance long from support
Trigger: 15m holds S1 6805–6808 → 5m reclaim 6823 VWAP → 5m close above 6830.
Entry: 6831–6834 on first 1m HL after the 5m re-close.
SL: 6821 (hard) or 15m trigger-wick −0.25–0.50 pt.
TP1: 6856–6861 (≥2R gate).
TP2: 6870–6873.
TP3: 6890–6895 if squeeze.
Management: No partials before TP1; at TP1 close 70%, set 30% runner to BE; no trail before TP2.
2. Rejection fade short from resistance
Trigger: Pop into 6856–6861, stall, then 5m full-body re-close back below 6856 with 1m LH.
Entry: 6850–6854.
SL: 6864.25 (hard) or 15m wick +0.25–0.50.
TP1: 6830–6832.
TP2: 6823 VWAP.
TP3: 6805–6808.
Note: If 5m re-claims 6861 after entry, exit early; setup invalid.
3. Breakdown continuation short
Trigger: 5m body close below 6805 with retest fail from beneath.
Entry: 6800–6803.
SL: 6810.75 (hard) or 15m wick +0.25–0.50.
TP1: 6790–6795.
TP2: 6768–6772.
TP3: 6747–6752.
Note: If reclaim and 5m closes back above 6808, cancel.
4. Breakout continuation long
Trigger: 5m acceptance above 6861 and hold on retest.
Entry: 6862–6865 on first 1m HL.
SL: 6853.25.
TP1: 6870–6873.
TP2: 6885–6890.
TP3: 6905–6912.
Note: If acceptance fails (5m body back under 6861), flip bias back to fade R3.
Event map for Thursday (ET)
FOMC meeting Day 1 (runs Thu–Fri; Fed is not affected).
EIA Weekly Natural Gas Storage 10:30.
Most BLS/DOL macro releases (e.g., Productivity & Costs, Weekly Jobless Claims) are suspended during the shutdown. Expect fewer 8:30 prints and thinner liquidity until the cash open.
QQQ : Stay heavy on positionsQQQ : Stay heavy on positions (QLD, TQQQ)
Entering a risk-on, high-volatility zone.
A signal for catching a bounce has emerged.
In stay light on positions zones, I hold QQQ and reduce exposure.
In stay heavy on positions zones, I increase allocation using a mix of QLD and TQQQ.
** This analysis is based solely on the quantification of crowd psychology.
It does not incorporate price action, trading volume, or macroeconomic indicators.

SPY : Stay heavy on positionsSPY : Stay heavy on positions (2x leverage)
Entering a risk-on, high-volatility zone.
A signal for catching a bounce has emerged.
In stay light on positions zones, I hold SPY(+QQQ) and reduce exposure.
In stay heavy on positions zones, I increase allocation using a mix of SSO(+QLD) and TQQQ.
** This analysis is based solely on the quantification of crowd psychology.
It does not incorporate price action, trading volume, or macroeconomic indicators.

Markets Looking SOFT at highs - Correction Underway (Key Levels)October 10th candle is a very important low for all US Markets
-S&P
-Nasdaq
-Dow
-Russell
The rally from that Oct 10 candle low (Friday) was met with aggressive
support but was only showing rallies in Mag 7 and AI related plays
Earnings for the most part are coming in meeting or exceeding expectations, but
price action is certainly looking soft with the market making lower highs and lower
lows for now
We have plenty of technical support, but given the longest US Government Shutdown
in history with dot.com like valuations (there is bubble and non-bubble evidence),
sentiment and elevated volatility are taking their toll and dragging the markets lower
I've closed a lot of open positions and de-risked the portfolio pretty severely this week
with the intention of finding ways to participate in a cautiously bullish environment. As I mention in the video, markets tend to V bottom, but round out the tops so the longer we
stall at these highs and the more "rounded" look we have near these highs, the more
fragile and support can be if we eventually see a break lower - TBD
Day to day, we continue to do good work carving out short-term winners and properly
position for what is next - good or bad
Thanks for watching. See you in the live markets
-Chris

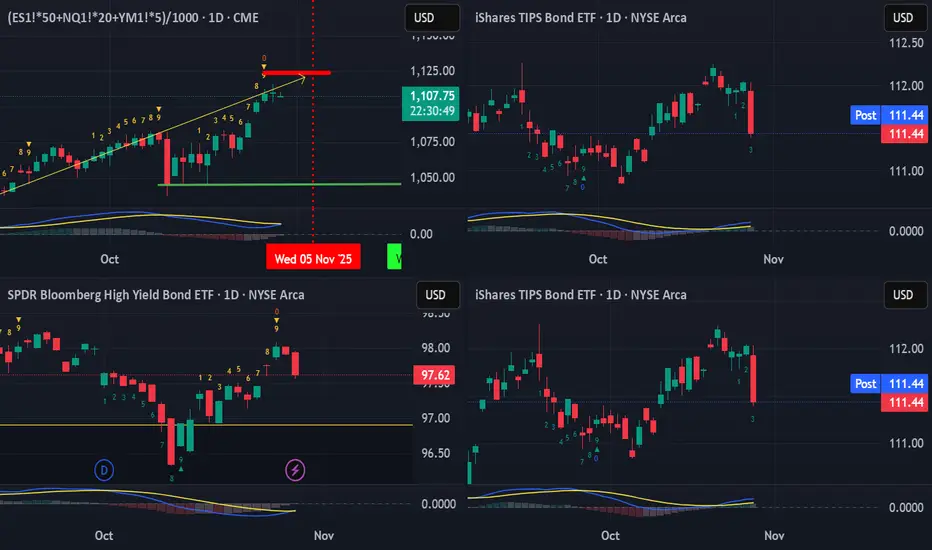
US Equities have this week left... Part IISo, yesterday heads up was given that the US Equities (and pretty much global equities generally) have this week left of bullishness.
This was observed with a TD Bear Setup perfected completion, coming into a stall. What was not mentioned was that the leading indicators of JNK, TIP and TLT were already showing signs of imminent breakdown (to understand about these three leads, refer to the book: Anatomy of the Bear by Russell Napier)
So just wanted to show it more obviously here.
While the US Equities were in a bit of a stall to close slightly positive, the three leads were clearly Bearish in the candlestick patterns with a single wipeout bearish, near marubozu, down candlestick that wiped out at least three days to two weeks of gain.
This like a slap in the morning while we are at the sweetest part of the dream.
Heads up, wake up!
Btw, with this kind of risk-off, crypto would not be spared either.
Short, sharp, sweet...
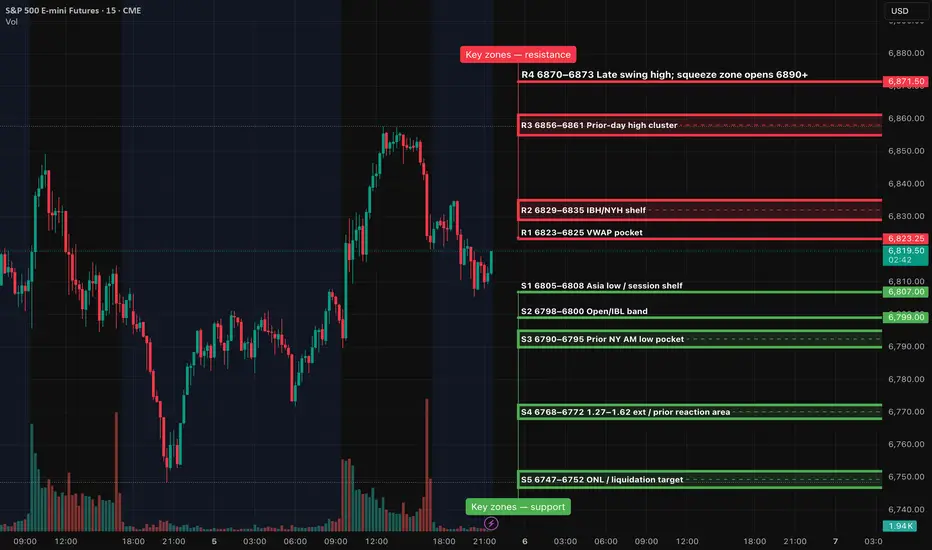
ES (SPX, SPY) Analysis, Levels, Setups for Wed (Nov 5th)News & timing (ET): ADP 8:15; ISM Services PMI 10:00; EIA Crude 10:30. Release status: all three are scheduled to run (not shutdown-affected).
Bias & context: Short-term trend remains lower after a sequence of 15m lower-highs/lows and failure to hold 6,793–6,805. Expect dip-buys to be sold unless 6,860+ is reclaimed and defended.
Overnight → NY forecast:
Base path: probe 6,748–6,756 into Asia/London, bounce to 6,793–6,805, then decide at NY open. Lose 6,748 on momentum and the magnet becomes 6,713–6,725.
Alt squeeze: reclaim and hold above 6,852–6,860, push to the 6,900–6,906 “gate”, then 6,940–6,955. Only above 6,955 can 6,968–6,985 and 7,020–7,052 come into play.
Bear extension: clean break and 15m body acceptance below 6,713–6,725 opens 6,660s (deeper extension) before any meaningful bounce.
Key-Zones
Resistance (top→bottom):
7,020–7,052 premium band (W3 major; first touch favors profit-taking)
6,968–6,985 measured-extension / weak-high pocket (W2)
6,940–6,955 prior distribution top / supply shelf (W2)
6,900–6,906 immediate ceiling “gate” (W2 pivotal)
Support (top→bottom):
6,852–6,860 defended floor / quick-reclaim bounce zone (W2)
6,793–6,805 swing-equilibrium magnet (W2)
6,748–6,756 next demand shelf / measured support (W2)
6,713–6,725 extension target and last strong shelf before deeper repricing (W3)
Setups (Level-KZ Protocol 15/5/1)
Rejection Fade (short): sell 6,852–6,860 or 6,900–6,906 after a 15m rejection close back inside → 5m re-close in your favor; use the 15m wick +0.25–0.50 pts as hard SL. TP1 = next opposing MAJOR level (e.g., 6,805 then 6,756).
Acceptance Continuation (long): only after a full-body 15m close above 6,860 and a 5m pullback that holds; target 6,900–6,906 → 6,940–6,955; invalidate on a 15m close back below 6,852.
Quick-Reclaim Bounce (Tier-2): flush into 6,748–6,756, instant reclaim on 1–5m, enter on first HL; TP1 = 6,793–6,805; invalidate on a 15m close back below the shelf.
Exhaustion Flush (Tier-3): if 6,748 breaks with force and a 15m body holds below, sell the first 1–5m LH; TP1 = 6,713–6,725; runner eyes 6,660s if momentum persists.
Risk & management (use consistently):
Instructions: only take a setup if TP1 ≥ 2.0R using the 15m-wick SL.
At TP1: close 70%, set 30% runner to BE; runner aims TP2 at the next major level.
No trailing before TP2. Time-stop 45–60m if neither TP1 nor SL hits. Max 2 attempts per level per session.
Kill-zones (ET): London 02:00–05:00 (optional ½–¾ size); NY AM 09:30–11:00 (primary); NY PM 13:30–16:00 (primary). Manage only 12:00–13:00.
What flips decision:
Bullish: sustained 15m acceptance above 6,860 then above 6,906 turns path toward 6,940–6,955 → 6,968–6,985.
Bearish: 15m acceptance below 6,748 invites 6,713–6,725; losing that level opens 6,660s before any notable bounce.
