$SPY & $SPX Scenarios — Wednesday, Jan 7, 2026🔮 AMEX:SPY & SP:SPX Scenarios — Wednesday, Jan 7, 2026 🔮
🌍 Market-Moving Headlines
• Services and labor cross-check: ADP, ISM Services, and Job Openings together shape the near-term labor and growth narrative.
• Rates sensitivity: Markets will gauge whether services strength offsets soft manufacturing momentum from earlier in the week.
• Setup into Friday jobs: Today’s data can influence positioning ahead of the official employment report.
📊 Key Data & Events (ET)
8 15 AM
• ADP Employment Change Dec: 48,000
10 00 AM
• ISM Services Index Dec: 52.2 percent
• Job Openings Nov: 7.6 million
• Factory Orders Oct: -1.2 percent
⚠️ Disclaimer: For informational use only — not financial advice.
📌 #SPY #SPX #ISM #ADP #JOLTS #macro #markets #trading
SPX (S&P 500 Index)

New All Time Highs - Bullish Price ActionToday the S&P500 made new all time highs.
It was a perfect breakout trend day and breakout.
Today we were able to trim and take profits on some of our long exposure.
We trimmed and sold NASDAQ:AMZN NYSE:SNAP NASDAQ:TEM NYSE:SMR
When the market is giving you all time highs and higher highs its always a good time to pair back longs.
Tomorrow we have some employment data that could gap the market higher.
If we can confirm a weekly chart breakout the probabilities of hitting 7k on spx is very likely.

S&P500 This is the level that confirms the Bear Cycle.The S&P500 (SPX) has reached a point where it could be on the verge of initiating a new Bear Cycle as the price action that led to the end of 2025 (mostly Q4) has been very similar with the one in late 2021 that kick-started the 2022 Bear Cycle.
What confirmed that Bear Cycle was the market closing a 1W candle below the 1D MA100 (red trend-line). This is extremely critical as it has already proven its role as a catalyst during the most recent short-term pull-back in November, where it held upon tested on the week of November 17 2025 and thus rebounded. This is exactly what took place in November 2021, with the index eventually closing a 1W candle below the 1D MA100 almost 2 months later on the week of January 17 2022. That confirmed the 2022 Bear Cycle as the sell-off was accelerated and in just 1 week, the market even hit the 1W MA50 (blue trend-line).
The structure between the two fractals is so far very similar, with a huge 1W RSI Bearish Divergence (Lower Highs against price's Higher Highs) leading the index towards a potential Top. If the price action continues to repeat that of 2022, then we are looking at the very real possibility of a -27.60% overall correction within roughly 12 months time, with the first potential Target being the 1W MA200 (orange trend-line) around 5350 and second the full -27.60% extension at 5050. Those two levels technically form the potential Buy Zone for the next Bull Cycle.
The metric though that cannot be ignored as far as long-term buying is concerned, is the 1W RSI, which has historically given optimal buy opportunities when it turned oversold (i.e. 30.00 or below). If this level is hit before any of the above two Targets, we will be turning into long-term buyers again regardless.
---
** Please LIKE 👍, FOLLOW ✅, SHARE 🙌 and COMMENT ✍ if you enjoy this idea! Also share your ideas and charts in the comments section below! This is best way to keep it relevant, support us, keep the content here free and allow the idea to reach as many people as possible. **
---
💸💸💸💸💸💸
👇 👇 👇 👇 👇 👇

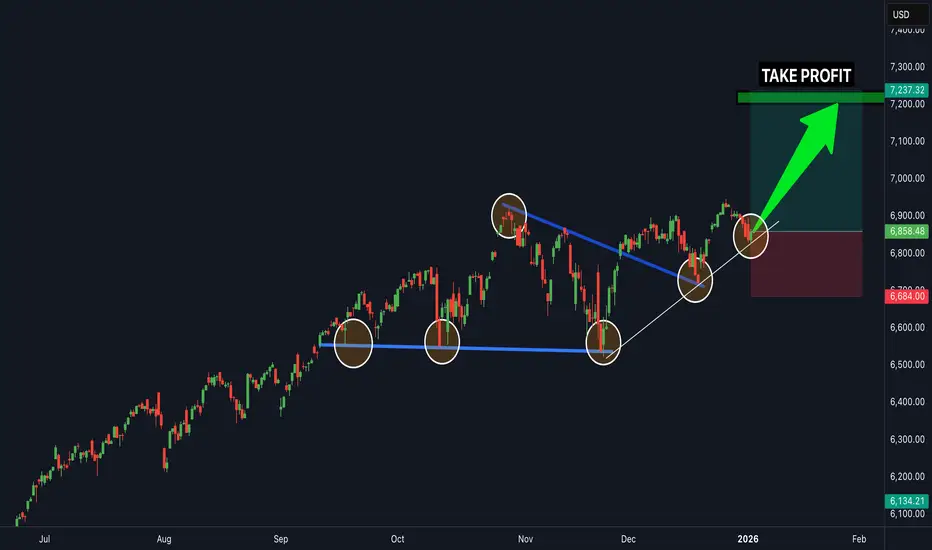
SPX - Next LevelsWe’re evaluating the move starting from April 2025.
It looks like we’re nearing the end of this move, currently plotting the fifth wave.
Corrections of waves 2 and 4 are roughly equal in size.
Fibonacci levels indicate the next target around 7,200 .
The 7,600 level (slightly below or above) roughly aligns with a larger Fibonacci extension, counting the first wave from October 2022 to July 2023.
Potential targets:
7,200
7,600
---
Please subscribe and leave a comment.
You’ll get new information faster than anyone else.
---

$SPY & $SPX Scenarios — Tuesday, Jan 6, 2026🔮 AMEX:SPY & SP:SPX Scenarios — Tuesday, Jan 6, 2026 🔮
🌍 Market-Moving Headlines
• Quiet macro session: No major inflation or labor data ahead of Wednesday and Friday’s heavier releases.
• Services tone in focus: Final PMI helps confirm whether services momentum held up into year-end.
• Markets in reset mode: Early-year positioning and flows remain the primary driver.
📊 Key Data & Events (ET)
9 45 AM
• S and P Final U.S. Services PMI Dec: 52.9
⚠️ Disclaimer: For informational use only — not financial advice.
📌 #SPY #SPX #PMI #services #markets #trading #stocks #macro

ES (SPX, SPY) Analysis, Levels, Setups for Tue (Jan 6)U.S. stock markets closed on a positive note today, buoyed primarily by gains in the energy sector and large banking institutions. This upside was propelled by headlines related to Venezuela, which invigorated both the energy market and investor risk sentiment. Meanwhile, the ISM Manufacturing Index for December showed a contraction, remaining below the 50 threshold, which reinforces the narrative of uneven economic growth and places increased emphasis on upcoming services data scheduled for release later this week.
Looking Ahead to Tuesday:
The macroeconomic calendar for Tuesday appears relatively light, suggesting that the equity markets may engage in a more directional trading pattern unless unexpected geopolitical developments emerge overnight. The primary risk window looms larger later in the week with significant reports on ADP employment, ISM Services, and the EIA energy outlook, culminating in the Nonfarm Payrolls report.
Overnight Outlook into New York:
The most probable scenario sees a rotation around the 6948.50 level (VWAP), with a two-sided trading dynamic expected. Key support is identified at the 6942.50/6940.00 range, while the first resistance ceiling is placed between 6955.25 and 6963.50. A bullish scenario would emerge with a stable hold above 6942.50 and a successful move through 6955.25, paving the way toward the 6963.50 resistance level and beyond. Conversely, bearish pressure may materialize if the index falls below 6940.00, with a failure to reclaim 6942.50 potentially exposing levels around 6932.75 and the 6912.75-6906.00 range.
Trade Setups for Tomorrow
A++ Long Setup (Preferred):
Entry: 6932-6935 (PDL / NYAM.L test)
Stop: 6927
Target: 6948-6955
B+ Short Setup (Fade Rally) :
Entry: 6950-6955 (VWAP / Y-POC rejection)
Stop: 6960
Target: 6935-6940
Deep Discount Long (If Major Flush):
Entry: 6906-6912 (LO.H / AS.H zone)
Stop: 6900
Target: 6940-6950
Good Luck !!!

SPX 0DTE idea JAN 6 2026SPX is currently trading inside a balance zone, not a clean trend.
Momentum slowed after the last push up, and price is now reacting around key levels.
This is a wait-for-confirmation environment, not a prediction market.
Key Levels
• 6900–6922 → Balance / Chop zone
• 6922 → Major resistance
• 6898→ Breakdown trigger
• 6883 → 6869 → 6857 → Downside targets if selling accelerates
Bullish Scenario (CALL)
Only valid after confirmation:
• Break and hold above 6922
• Acceptance above the level (15m / 1H close)
• Successful retest holding above.
Targets:
• TP1: 6935
• TP2: 6960
Bearish Scenario (PUT)
More favorable if price loses balance:
• Breakdown below 6898
• Failure to reclaim.
Targets:
• TP1: 6883 ( is the acceleration level. Acceptance below it usually leads to faster downside movement. )
• TP2: 6869
• Extension: 6857
Summary
• ❌ No trades inside 6900–6920
• ❌ No guessing direction
• ✅ Trade confirmation, not hope
Above 6922 → CALL
Below 6895 → PUT

SPX.. buy now SPX 500 is in a clear upwards channel and has broken the last bit of resistance (white trendline line shown) - this is a clear confirmation that the next target will be the next resistance zone to the upside shown above (this is a great buy trade opportunity) - buy SPX 500 now...
US500 Structure Turns Positive as Demand Builds📈 Bullish US500 / SPX500 Swing Trade Opportunity | Thief Layer Strategy 🛡️💰
🔥 Asset: US500 / SPX500 Index
📅 Trade Style: Swing Trade
📊 Market Bias: Bullish Momentum
💡 Trade Plan – Thief Layer Entry Strategy
We’re playing a multi-layered bullish entry using Thief’s layering method 👇
🔹 Limit Layers:
• Buy Limit @ 6820
• Buy Limit @ 6840
• Buy Limit @ 6860
• Buy Limit @ 6880
(Add more layers based on personal risk tolerance & preference)
Layer Method: Using multiple limit orders helps accumulate positions on weakness and improve average entry for swing upside.
🛑 Stop Loss – Thief OG Rule
🔒 SL: 6800 (Thief SL)
➡️ Adjust SL based on your own risk level and strategy. Manage risk yourself — only use my SL as reference, not guidance.
⚠️ I am not recommending you ONLY use my SL/TP — trade at your own risk & adjust as needed.
🏁 Target Zone
🎯 Primary Target: 6980
📌 This zone aligns with strong resistance, potential overbought reaction & trap level — cautious profit-taking area.
🔗 Related Markets to WATCH
Here are correlated markets that often move with SPX500:
✔️ US Dollar Index (DXY) – correlation influences risk sentiment and equities. A stronger USD often supports equity strength, though relationship varies over time.
✔️ NASDAQ / US Tech Index – tech is a big driver for US500 performance due to sector weight.
✔️ Crude Oil (WTI / Brent) – recent patterns showed equities trending in tandem with oil, reflecting risk appetite.
✔️ EUR/USD & GBP/USD — sentiment indicators that often swing with risk on/off market mood.
🧠 Fundamentals & Macro Drivers
📌 Economic Outlook: U.S. growth expected without recession in 2026, aiding risk assets.
📌 Fed Policy: Recent rate cuts and expectation of additional easing support equity valuations.
📌 Earnings Growth: Most major sectors projected with higher expected growth for 2026.
📌 AI + Tech Tailwinds: Continued AI investment remains a key bullish driver for US equities.
📅 Watch Upcoming News Events:
• U.S. Nonfarm Payrolls
• Fed Rate Decisions / FOMC Minutes
• CPI & Inflation data
• PMI & Retail Sales
📌 Why This Setup
✅ Multi-layer entries improve execution quality
✅ Bullish macro backdrop + earnings support
✅ Clear risk zone + target
✅ Correlation watchlist for context
💬 Trade smart, manage risk, and always confirm with your own analysis.
If this idea helped, *like 👍, comment 💬, and follow 📌 for more Thief strategy setups!

SPX: Around 7.500 by YE2026?S&P 500 opened 2026 with a mild gain and positive sector rotation into chip/industrial stocks, though broader sentiment remains cautious after a strong prior year. The S&P 500 edged higher to start trading in 2026, rising modestly, 0.2% on January 2nd, after snapping a brief multi-session losing streak, helped by gains in chip and industrial stocks. Semiconductor names like Nvidia, Intel and Micron led the upside, while some mega-cap tech stocks were weaker. Despite the uptick, overall market breadth was mixed. The index entered 2026 on the back of strong 2025 performance, finishing that year up about 16%, but market analysts noted cautious sentiment and the absence of a typical “Santa Claus rally.”
Western Digital & Micron Technology continued strong performance with notable gains, reflecting persistent demand for data storage and memory chips tied to AI growth trends. Sandisk, newly added to the S&P 500, also jumped sharply. Nvidia regained momentum after tech export concerns and remains a central driver of semiconductor strength, supported by chip demand (especially in China) and upcoming tech-show catalysts. Tesla underperformed this week, declining after reporting lower Q4 deliveries versus expectations, while various EV and AI sectors saw mixed moves. Energy and defensive sectors showed relative strength compared with some lagging big tech names, as investors balanced growth vs defensive exposures amid early-year trading.
Analysts' predictions for the level of S&P 500 in 2026 are more or less in alignment, meaning up to 10% gain for the year. JPMorgan’s base case includes an index at app. 7.500 by the year end, which would be a 10% gain for the year. In their bull case, the S&P 500 should rise up to 8.000. Analysts from UBS are predicting a base case around 7.700 by the end of this year, supported by broad earnings growth, a constructive macro backdrop and continued AI and tech sector leadership. Strategists from Morgan Stanley see the index ending this year around 7.800, reflecting expectations for a continued bull market with supportive policy and strong earnings. Analysts from Goldman Sachs target around 7.600, underpinned by robust earnings growth and ongoing strength in leading sectors like tech.

ES (SPX, SPY) Analysis Week-ahead from Jan 5 to Jan 9, 2026Multi-Timeframe Market Analysis
Weekly Overview: The Big Picture
The E-mini S&P 500 (ES) continues to demonstrate an uptrend on a macro scale, characterized by a series of higher highs and higher lows. However, the recent market activity has resembled a gradual grind near the upper boundaries of a multi-month trading range—a behavior often referred to as “premium.” This indicates a slowdown in upward momentum, with pullbacks becoming increasingly pronounced. While the market does not exhibit extreme overbought conditions, the acceleration seen in prior weeks has noticeably diminished.
Daily Trend and Range Dynamics
On a daily basis, the market is operating within an upward trend that is currently exhibiting range-bound characteristics. We are witnessing repeated attempts to test the upper supply zone around the 6980-7000 level, followed by mean reversion toward the mid-to-lower 6900s. The latest daily swing reflects a pullback from this upper band, positioning prices now towards the center of this range, where liquidity zones take precedence over simply chasing trends.
4-Hour Perspective: Impulse vs. Correction
Analyzing the 4-hour chart reveals a distinct corrective move followed by a rebound that has yet to solidify a sequence of higher highs. While the overarching weekly trend remains bullish, the current 4-hour action feels more like a rebound effort, with the market in a phase of "repair" after experiencing a sharp decline.
1-Hour Intraday Context
At the intraday level, the latest 1-hour movement reflects a rebound from the lower 6800s towards the resistance zone in the low-to-mid 6900s. This places traders in a critical “decision zone” as we enter Monday's session, where the market faces a pivotal moment: it must either reclaim and sustain levels above these key resistance shelves (indicating bullish continuation) or risk further fading of rallies, which would suggest a return to range-bound or corrective trading.
Oscillator and Momentum Indicators (Weekly and Daily)
From a momentum perspective, the weekly oscillators point to a constructive yet cooling outlook, lacking signs of a fresh breakout structure. Daily momentum indicators are closer to neutral territory, indicative of a market that appears to be in a wait-and-see mode, poised for a catalyst to determine its next direction.
Volatility Metrics Analysis
VIX Overview
The CBOE Volatility Index (VIX) closed the previous session at 14.51, reflecting a decline throughout the day.
VIX Term Structure
The VIX term structure remains in contango, with an upward-sloping curve indicating that implied volatility is anticipated to rise over the coming months. Specifically, the implied volatility for January sits at 12.55, February at 15.38, and March at 17.34, with further increases projected for later months. This pattern is typically indicative of stable market conditions, suggesting that volatility is being priced higher down the line compared to the present.
Rates Volatility (MOVE)
The MOVE Index, which measures volatility in interest rates, is currently at 62.36 as we approach market close, also reflecting a decrease on the day. This level does not indicate significant stress within the market, aligning more with an environment in which investors are not exhibiting panic regarding interest rate fluctuations.
Options and Positioning Overview
Current Put/Call Ratios (Latest Daily Figures)
- Total Put/Call: 0.83
- Index Put/Call: 1.08
- ETP Put/Call: 0.85
- Equity Put/Call: 0.56
Analysis: The equity flow currently exhibits a call-leaning sentiment, as indicated by the lower equity put/call ratio. In contrast, index hedging remains active, with the index put/call ratio above 1. This duality is characteristic of late-cycle market behavior, where investors often purchase upside in individual stocks while simultaneously maintaining protective index hedges.
10-day Moving Average of Put/Call Ratios
Unfortunately, a definitive and authoritative 10-day moving average for the total put/call ratio is not readily available from the sources providing daily data in a machine-readable format. While the daily figures presented are confirmed, the 10-day averages cannot be securely sourced at this time.
SKEW - Tail Risk Pricing
The SKEW index closed at 141.86, a figure that Cboe describes as reflective of the pricing dynamics surrounding out-of-the-money SPX options, particularly those associated with tail risk. Typically, values for SKEW fluctuate within the 100-150 range. The implication is clear: despite a calm front-end volatility environment (as suggested by VIX levels), tail hedges are attractively priced.
Dealer Gamma Insights
Considering the current landscape of low spot volatility coupled with contango and a modest equity put/call ratio, market conditions suggest that dip buyers may defend the initial downside levels effectively. However, the elevated SKEW indicates that the demand for downside tail protection is increasing, meaning that if the market breaches key support levels (S4), panic-induced hedging activity could accelerate rapid downward movements. This interpretation is based on the metrics discussed and does not represent direct insights from dealer positioning.
Market Breadth and Internals Analysis
Advancers vs. Decliners (NYSE)
On January 2, 2026, the New York Stock Exchange recorded 1,882 advancing issues compared to 882 declining ones.
Breadth Oscillator (McClellan)
The NYSE’s McClellan Oscillator is currently at -18.826, a notable improvement from -76.414 previously. This indicates that while breadth remains slightly negative, the recent uptick suggests a reduction in selling pressure.
Sector Performance Snapshot
Recent market activity has highlighted leadership in the energy sector, along with notable strength in semiconductor stocks, while consumer segments have lagged behind. Should this trend continue, it would support a “grind/range” market environment rather than a drastic “waterfall selloff,” unless unexpected macroeconomic events disrupt the landscape.
Market Dynamics: Minor Wobble vs. Distribution Day
With breadth showing signs of improvement and credit markets not exhibiting significant stress, the current evidence leans towards a “minor wobble/consolidation” scenario rather than a full-scale distribution. This outlook holds, provided that key support levels remain intact and market internals do not deteriorate concurrently.
Credit and Funding Overview
High Yield ETFs
- HYG: 80.67
- JNK: 97.24
High Yield Spreads (OAS)
As of the last available print on December 31, 2025, the ICE BofA US High Yield OAS stands at 2.81%. This level is considered tight and typically signifies “orderly credit” conditions. It is important to monitor these spreads closely; a sharp widening could signal increased risk aversion, which often leads to more significant pullbacks in equity markets.
Sentiment and Crowd Positioning
AAII Sentiment (Latest)
- Bullish: 42.0%
- Neutral: 31.0%
- Bearish: 27.0%
The current sentiment readings indicate a notable tilt toward optimism. While this sentiment alone does not serve as a reliable timing mechanism for market reversals, it effectively diminishes the “wall of worry” that frequently fuels market squeezes.
Cross-Asset and Global Risk Tone
Crypto (Risk-On Proxy)
- BTC: 91,314
- ETH: 3,137.63
The resilience in cryptocurrency prices typically reflects a broader risk-on sentiment, although it should be noted that this is not a definitive indicator for daily movements in equities.
ES vs. NQ Relative Strength
The Nasdaq (NQ) continues to exhibit higher beta characteristics. If NQ consistently underperforms during market rallies, it may hinder attempts for the S&P 500 (ES) to push through resistance levels at R1 and R2.
Scheduled Events(ET):
Mon Jan 5
• 10:00 AM - ISM Manufacturing PMI (Dec)
Tue Jan 6
• 9:45 AM - S&P Global Final Services PMI (Dec)
Wed Jan 7
• 8:15 AM - ADP Employment Change (Dec)
• 10:00 AM - ISM Services PMI (Dec)
• 10:00 AM - JOLTS Job Openings (Nov)
• Late afternoon - Fed speaker risk (watch headlines)
Thu Jan 8
• 8:30 AM - Weekly Unemployment Claims
• 8:30 AM - Productivity and Unit Labor Costs (Q3)
Fri Jan 9 (highest impact)
• 8:30 AM - Nonfarm Payrolls, Unemployment Rate, Average Hourly Earnings
• 10:00 AM - University of Michigan Consumer Sentiment (prelim)
Two A++ setups (Level-KZ Protocol 15/5/1)
A++ Setup 1 - Rejection Fade Short (R1/R2 cap)
Entry: 6934.75-6937.50
Hard SL: 6946.25 (above the 15m rejection wick)
TP1: 6906.50 (S1)
TP2: 6889.50 (S3 top)
TP3: 6875.50 (S4 top)
Invalidation: 15m acceptance above 6940.75 and holding (no immediate snapback)
A++ Setup 2 - Bounce Long (S4 defend)
Entry: 6869.00-6876.00
Hard SL: 6859.75 (below the reclaim wick and below 6861.75 fib magnet)
TP1: 6902.75 (S1)
TP2: 6938.50 (R1)
TP3: 6982.50 (R3 first tag)
Invalidation: 15m bodies holding below 6866.75
Good Luck !!!

$SPY & $SPX Scenarios — Week of Jan 5 to Jan 9, 2026🔮 AMEX:SPY & SP:SPX Scenarios — Week of Jan 5 to Jan 9, 2026 🔮
🌍 Market-Moving Headlines
• First full week of the year: Positioning resets, fresh macro signals, and liquidity normalization after holidays.
• Growth vs labor balance: ISM, services data, and jobs will shape early 2026 rate expectations.
• Labor market focus Friday: Payrolls and wages remain the dominant macro driver for rates and equities.
📊 Key Data & Events (ET)
Monday Jan 5
10 00 AM
• ISM Manufacturing Index Dec: 48.3 percent
• Auto Sales Dec: 15.6 million
Tuesday Jan 6
9 45 AM
• S and P Final U.S. Services PMI Dec: 52.9
Wednesday Jan 7
8 30 AM
• ADP Employment Change Dec: 45,000
10 00 AM
• ISM Services Index Dec: 52.1 percent
• Job Openings Nov: 7.7 million
• Factory Orders Oct: -1.2 percent
Thursday Jan 8
8 30 AM
• Initial Jobless Claims Jan 3: 199,000
• U.S. Trade Deficit Oct: 58 billion
• U.S. Productivity Q3: 4.7 percent
3 00 PM
• Consumer Credit Nov: 12.4 billion
Friday Jan 9
🚩 Primary Macro Day
8 30 AM
• U.S. Employment Report Dec: 54,000
• Unemployment Rate Dec: 4.7 percent
• Hourly Wages Dec: 0.3 percent
• Hourly Wages Year over Year: 3.5 percent
• Housing Starts Oct: 1.33 million
9 45 AM
• UMich Consumer Sentiment Jan: 53.5
🧭 Trading Context
• Manufacturing still contractionary while services remain expansionary.
• Labor data Friday will set the tone for January rate expectations.
• Expect higher volatility as liquidity returns and positioning rebuilds.
⚠️ Disclaimer: For informational use only — not financial advice.
📌 #SPY #SPX #markets #macro #jobs #ISM #Fed #trading #stocks

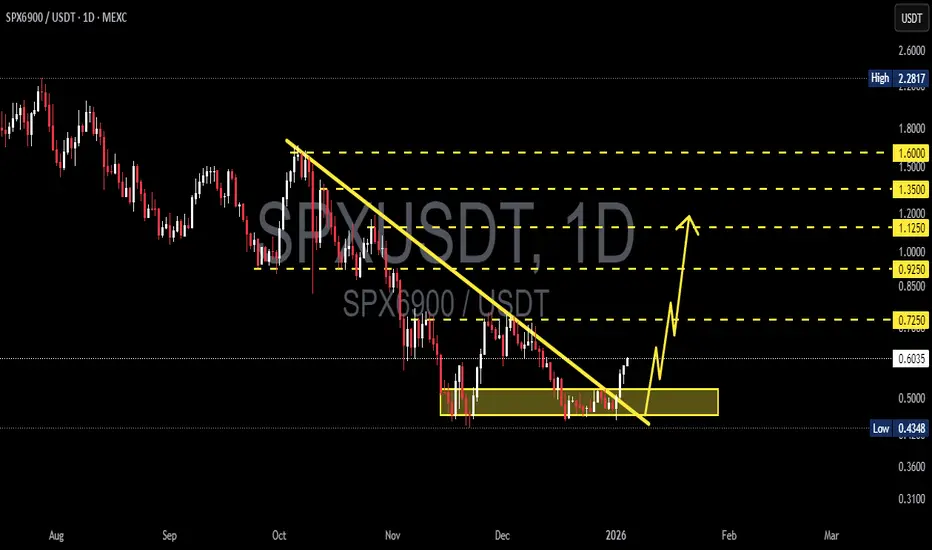
SPX/USDT - Reversal Signal After Descending Trendline PressureSPX6900 has been moving in a clear downtrend structure, characterized by consistent Lower Highs (LH) and Lower Lows (LL). The descending trendline has been acting as strong dynamic resistance since the price peaked around the 1.6 USDT area.
Currently, price has reached a major demand zone (support area) around 0.45 – 0.55 USDT, highlighted by the yellow box on the chart. This zone has historically triggered strong buying reactions.
Most importantly, recent candles show a bullish reaction and an attempt to break above the descending trendline, signaling potential momentum exhaustion on the bearish side.
---
📐 Pattern Explanation
1. Descending Trendline (Bearish Market Structure)
Price has been trading below the descending trendline for an extended period.
Every bullish attempt was rejected at the trendline, confirming seller dominance.
2. Strong Demand / Accumulation Zone
The 0.45 – 0.55 USDT area acts as a key support level.
Multiple rejections from this zone indicate accumulation by buyers.
3. Early Trendline Break Attempt
Price is attempting to break the descending trendline.
A daily close above the trendline is required for valid confirmation of a trend shift.
---
📈 Bullish Scenario
If price:
Closes above the descending trendline
Holds above the 0.55 – 0.60 USDT support area
Then bullish continuation becomes likely, with upside targets:
🎯 Bullish Targets (Resistance Levels):
0.725 USDT
0.925 USDT
1.00 – 1.125 USDT
1.35 USDT
1.50 – 1.60 USDT (major resistance zone)
📌 This scenario will be strengthened by increasing volume and the formation of Higher Lows (HL).
---
📉 Bearish Scenario
The bearish scenario remains valid if:
Price fails to hold above 0.55 USDT
Strong rejection occurs at the descending trendline
⚠️ Downside risks:
Retest of the 0.45 USDT support
Breakdown below demand may push price toward 0.40 – 0.36 USDT
📌 A clean breakdown below the demand zone would invalidate the reversal scenario and confirm bearish continuation.
---
🧠 Key Takeaway
SPX6900 is currently trading at a critical decision zone:
Major demand area
Descending trendline breakout attempt
Price is deciding between: 👉 A bullish reversal and trend change
or
👉 Continuation of the broader bearish trend
Daily candle confirmation is crucial.
---
#SPX6900 #SPX6900USDT #CryptoTechnicalAnalysis #AltcoinAnalysis #DailyChart #TrendlineBreak #DescendingTrend #DemandZone #SupportResistance #BullishScenario #BearishScenario #PriceAction #CryptoTrading
SPX 2 day spreadBull put spread
6715 / 6710
$1.25 credit
A BUNCH of support levels here. And 3 selling days in a row...


Wyckoff's Everywhere? Or Hallucinations?Is anyone else seeing Wyckoff distributions all over the place in stocks right now? I feel like I saw one and then started noticing them everywhere on major stocks
Bitcoin has one, started back in July and is straight out of a TA textbook. The prior cycles, Crypto peaked 1st being the most sensitive to liquidity changes.
Seems Bearish
Seems Bearish
However, TSM looks bullish!
It was forming a similar pattern but appears to be breaking out to the upside. If other stocks can follow this track things could keep going.

GOOGL: Triangle Breakout, Set-Up Confirmation, Target Zone.Hello There,
welcome to my new analysis about GOOGL. Recently I spotted an important pattern and setup. As the new year started, new patterns within the prices are unfolding. Therefore, it is interesting to watch which titles in the market are likely to yield appropriate returns and complete crucial trading setups. Looking at the 2-hour timeframe, the key setup of GOOGL caught my attention.
When looking at my chart, there is this major triangle formation that offers a substantial price range in which GOOGL is building up the whole time. Within this zone, the price action found several supports. One of them being the lower boundary of the massive triangle formation. Another being the uptrend line. Within these zones, GOOGL already bounced several times.
What are also important indicators are the 50-EMA and the 20-EMA. As marked in blue and green in my chart, these EMAs are substantial supports off which GOOGL has already bounced several times. Above these main supports, GOOGL is now continuing to form a crucial next formation. This formation is actually a bull-flag formation completing above the upper boundary of the zones.
Also, the volume profile seen on the right of my chart, measuring volume by price, offers a fundamental support. With the price action bouncing further from these levels, a continuation of the local trend is likely. Especially when the bull flag confirms the next, this will offer a central setup on the long side as it is marked. A breakout above the upper boundary of the bull flag will determine a conservative entry.
With this being said, it is great to consider the important trades upcoming.
We will watch out for the main market evolutions.
Thank you very much for watching!

ES (SPX, SPY) Analysis, Key Levels, Setups for Fri (Jan 2nd)Market Overview: Context for Friday
As the market transitions from year-end positioning, traders should anticipate a choppy session influenced by holiday-thinned activity. Initially, expect fluctuations without a clear directional trend, but anticipate more definitive movements once New York cash volume resumes its normal pace.
From a structural standpoint, higher timeframes continue to reflect an uptrend. However, a recent decline from the 6980s has initiated a fresh pullback, leading to a short-term bias focused on “repair mode.” A shift in sentiment could occur if prices can reclaim and hold the mid-6940s.
Currently, prices are stabilizing around the 6920 mark following a sharp decline and subsequent bounce. This positioning places the E-mini S&P 500 (ES) in a mean-reversion zone, where oscillations between key value levels are expected as traders navigate the current landscape.
Forecasting Potential Market Movements
Base Case: Expect a range-bound market with a focus on repairing price levels.
Overnight Activity: The market has shown rotation around key levels of 6916 and 6922.50, with buying interest emerging above 6908.50.
Opening Analysis: As the New York session begins, we anticipate attempts to breach the 6922.50 to 6935.25 range. Should buyers fail to maintain support above 6922.50 during retests, the market is likely to rotate back towards 6916, followed by support at 6908.50.
Bullish Scenario: A strong upward movement could materialize with a decisive breakout above 6922.50.
- Trigger Point: A 15-minute close above 6922.50, followed by pullbacks that maintain support above 6921.50.
- Target Levels: Initial target at 6935.25, with further upside potential towards 6947.50 to 6951.50.
Bearish Scenario: A downward failure could emerge if the market loses the 6908.50 level.
- Trigger Point: Persistent failures to sustain above 6916, accompanied by a 15-minute close below 6908.50.
- Target Levels: An initial downside target at 6895.25, followed by 6890.25 to 6888.00. If 6888 is breached and held, the next level of interest would be 6873.
Events to watch tomorrow (timing is ET)
• 09:45 - S&P Global US Manufacturing PMI (final)
• 16:30 - Fed H.4.1 balance sheet update (released on the next business day when the usual Thursday release falls on a federal holiday)
A++ SETUP 1 (LONG) - Rejection Fade
Entry: 6888.00-6892.25 (buy only after a flush into the pocket, then reclaim)
Stop: 6878.00
• TP1: 6922.50
• TP2: 6935.25
• TP3: 6947.50
• Invalidation: 15m body closes below 6888.00 and does not reclaim quickly
A++ SETUP 2 (SHORT) - Rejection Fade
Entry: 6947.50-6951.50 (sell only after a push up, then fail back under 6947.50)
Stop: 6962.00
• TP1: 6922.50
• TP2: 6916.00
• TP3: 6890.25
• Invalidation: 15m closes and holds above 6951.50 (or a clean push above 6962.00)
Good Luck !!!

$SPY & $SPX Scenarios — Friday, Jan 2, 2026🔮 AMEX:SPY & SP:SPX Scenarios — Friday, Jan 2, 2026 🔮
🌍 Market-Moving Headlines
• First trading day of the year: Thin liquidity + positioning resets can exaggerate moves.
• Manufacturing tone check: PMI helps frame growth momentum heading into the first full trading week of 2026.
📊 Key Data & Events (ET)
9 45 AM
• S&P Final U.S. Manufacturing PMI (Dec): 51.7
⚠️ Disclaimer: For informational use only — not financial advice.
📌 #SPY #SPX #PMI #markets #trading #stocks #macro

Happy New Year S&P 500: Why I am BULLISH on Stocks for 2026.Hello There,
in the recent year, the S&P 500 has formed historical volatilities to the upside and downside while still sustaining the underlying trend. Several important factors drove the major price moves seen in the past year. Considering these fundamentals, I have detected important fundamental and technical signs that should be considered when preparing potential market participation for 2026.
In 2025, the major price moves that were recorded in the price actions resulted from crucial fiscal decisions. The main decline right at the beginning of the year due to tariff increases resulted in a drop of over -20% for the index. While this seemed to be a doomsday scenario for the whole market and a potential setup of a year-long bear market, the markets could quickly recover again and form several new highs.
The major price move that resulted from the market recovery gave the implication that the bull market won't be over so far, as prices reached far beyond the previous all-time high already. What is important here is that this price move was also supported by increased bullish volume, making it a fundamentally strong price action that is also likely to continue within 2026.
FUNDAMENTAL PERSPECTIVE
There are also several fundamental signs that are main implications for my consideration of a huge bull market continuation in 2026. These factors determine the underlying bullishness of the market from an economic perspective, supporting also the technical factors seen in my chart. There I am pointing out the most determining fundamental factors to consider here.
___________________________________________
Sustained GDP Growth and All-Time-High Demand
___________________________________________
Considering the important macroeconomic dynamics of the underlying fundamentals. The year 2025 has shown great increases within the U.S. GDP, continuing with the main uptrend of GDP growth. This has been supported by subsequent interest rate decreases. It is important to note here that the U.S. volume share of the S&P 500 accounts for almost 72% of the total volume of the index, making the U.S. volume entering from the economy the most important factor of price growth.
Also, the expectations of interest rate drops as well as inflation declines create a main bullish environment, which is offering an underlying bullishness from a fundamental perspective. With decreasing inflationary pressures, the interest rates are also likely to decrease, creating a dynamic that is supporting further investments into the index. Considering the forecasts, this will create a bullish dynamic, especially in Q2 and Q3, when the forecasted expectations turn out in reality.
____________________________
Nominal Interest Rate Decreases
____________________________
The decreasing nominal interest rates are a strong sign of the market turning more and more bullish. In the past year, the FED lowered the interest rates subsequently to lower levels. Creating a strong demand for money and investments in the market. These drivers were also particularly important for the price action holding to the upside and not declining more after the major drop at the beginning of the year.
It is highly likely that interest rates will decline further in 2026, creating further bullish underlying fundamental factors, increasing money demand and investment. This adds to the overall bullish expectations and considerations of forecasts for 2026. It will also be an interesting indication to follow for Q1 and Q2 and see how the FED considers further rate declines.
___________________________________________
An Bullish Sentiment Determined by the VIX Index
___________________________________________
This is an indicator especially important for the S&P 500 Index. It measures the market expectations of volatility derived from options prices. A low VIX index signals a bullish sentiment with a high risk tolerance, and firms are likely to invest more. A high VIX index signals a bearish sentiment with a high risk aversion, and the firms are not likely to invest more than necessary.
Throughout the year of 2025, the index was, the vast majority of the time, below the 15 threshold. With an average VIX of 15, this is a very bullish base that has built up in the year 2025. Especially in Q3 and Q4 of 2025, the index kept several times below the 15 threshold. This dynamic signals firms and investors willingness to invest more in the market and get ready for further bullish moves in 2026.
TECHNICAL PERSPECTIVE
Major Historical Ascending Trend Channel
As seen in my chart, the S&P 500 index is still trading within this huge and sustained uptrend channel. Within this channel, the index already bounced several times in this massively important and crucial lower bullish accumulation zone, especially followed by many famous investors pointing out supporting facts about the bullish dynamics. This channel is not yet broken, and the index already had the ability to visit the middle line of the channel, making it highly likely that the index will also bounce till the upper boundary of the channel again.
Bollinger Bands Tightening and Breakout Expectations
The Bollinger Bands indication is very interesting to consider. Because this constellation is now actually tightening above the middle line of the historical accelerating channel. Also, the index is bouncing above the middle line of the Bollinger Bands. As the bands tighten, they get ready for a major breakout and expansion of the bands towards the upside. What is also important here is that they follow the overall uptrend and EMA structure. An upthrust within this Bollinger Band dynamic is very likely to occur.
Substantial and Sustained Fibonacci Extensions
The index is still trading within a major Fibonacci extension. With the major waves 1 and 2 already completed. Now the index moves forward with expanding the wave 3 towards the upside. Within this dynamic, it is very interesting to see that the first 1.618 Fibonacci extension level of the first wave has already been reached. After this level is reached, the next target is the next higher Fibonacci level of 2.618. As the uptrend is still going on and the Fibonacci extension is holding, this is the next reasonable target. The target also matches with the huge ascending uptrend.
Strong Volume Supporting Bounces in the Channel
The bounces from the lower boundary of the uptrend channel were severely supported by major volume spikes. This is very important in an uptrend; the volume spikes have to correspondingly support the uptrend dynamics. The spikes were always conducted when a major bottom and the following uptrend bounce had been formed. As the substantial volume is holding on, it will be an important driver for further bullish price action throughout the year. Therefore, especially if volume should increase in the next term, it will offer additional support.
EMA-Support and Overall Trend Dynamics
The whole uptrend is still holding above the whole main EMA structure. Also greatly to consider here is that the EMA bounce occurred in March 2023, as also the market was able to recover from the inherent dynamic. The trend is still holding above the EMAs, and if a pullback should occur, the EMAs will be strong supports, likely holding the trend to the upside. Therefore, there are two possible scenarios that are most likely. The first is the uptrend just goes on, and the second is a pullback into support zones happens from where a stabilizing bullish price action can establish the further bullish uptrend.
CONCLUSION AND PROJECTIONS
Taking all of these important considerations into account, Q1 will be very decisive. Especially in price action, Q1 will set up how the rest of the year will move forward in price action. Therefore, there are two main scenarios that should be highly necessarily considered. The first is the uptrend dynamic as it currently established just goes on till the upper target zones are reached. The second is the price action firstly pulling back into the support zones determined by EMA, the Bollinger Bands, the bullish accumulation channel, and the volume profile. Then it will also be important how the macroeconomic indications pointed out will behave. If the expected forecasts show up as mentioned, it will highly likely be a major boost for the bullish price action. In any case, it will be highly determining and interesting to see the S&P 500 index evolve.
With this being said, it is great to see an increased support.
We will watch out for the important market evolutions.
Thank you very much for watching!

Whats in store for 2026?Predicting that, the stock market will move in any direction other than upwards has historically proven to be a fool's errand.
Typically, it's advisable to maintain a long position of America and its robust capital markets until the signs of a recession truly start to emerge.
However, last year's forecast of "7k plus" did indeed come to fruition, albeit by the narrowest of margins (just 11 points on the futures).
Now, let’s consider a potential scenario for 2026, shall we?
Following a stagnant fourth quarter and a lackluster conclusion to the last few trading days of 2025, I suspect that the initial half pf the year may be weaker than the prevailing consensus suggests.
Will we experience a technical bear market with a -20% decline?
Or will policymakers intervene at -19%, as they have done so many times in the past? :)
Regardless of how deep the pullback may be or how quickly the potential softness at the start of the year could occur...
It might actually present another fantastic buying opportunity that paves the way for a strong finish to the roaring twenties, with the SPX trading well above 10,000.
(indeed my SPX chart points towards 17,000 by 2032)
Could the bottom align with a possible four-year cycle low for BTC? That would be quite synchronistic and feasible, especially since crypto has become so intertwined with DJT's policies and serves as a performance metric that this administration is judged on whether praised or criticised for.
Have conviction but remain nimble would be my overriding message.

FRIDAY JAN 2ND 26 - TRADING IDEAIMO, Friday trading session will start with a drop going into the ~6778-6820 range then we might see a good rebound, might be a red to green as the market will be touching the bottom of the upward channel on the DAILY chart and usually many buyers will step in at the bottom of the channel + ~6780 is a strong support.
Trading idea: within the first 30 mins see how the market moves then buy puts and flip when we reach the bottom, this also is subject to normal market conditions (i.e. this is assuming NO sudden catalysts)
Disclaimer: THIS IS NOT AN ADVICE
GOOD LUCK TRADING

#GOLD - RALLY STILL FAR FROM THE END Briefly — I expect Gold to keep growing in the next couple of years, we are far from the end of the rally. Three reasons why:
- Safe Haven. Gold (and other metals which was recently proved) still act as the main safe heaven for retail, institutionals, banks (including CBs) . The ongoing geopolitical tensions around the world make them allocating more funds to $XAU.
- Stocks. The stock market is extremely overheated (a quick look at the SP:SPX 1Y chart makes it obvious) . No significant correction since 2008, the 2022 pullback was only a bare minimum and clearly insufficient. RSI is now near critical overbought levels. Most likely we will see new highs on stocks in 2026 — but that will mark the cycle top. Add an AI bubble that is about to pop. The puzzle fits together. Rotation from stocks to metals has already begun.
- Crypto. The 10/10/25 crash was dramatic for crypto and its future. It pushed Bitcoin from "high risk" into "extreme risk" bracket. Altcoins are out of any measurement scale with some of them dumping -90% in one day. Crypto market needs huge reforms, one day I will cover that topic in a separate post. For now: Gold > Bitcoin. Sadly.
💰 Add up a weak TVC:DXY and you will clearly see that there are not many places where investors can allocate their money other than metals, primary $XAU.
My forecast: we will see TVC:XAU near $10,000 mark before 2029.
