ES (SPX, SPY) Analysis, Key Levels, Setups for Wed (Dec 31st)Market Outlook for December 31, 2025 (NY Session)
As we approach the end of the year, investors should be aware of key economic data slated for release that could influence the equity markets, particularly the E-mini S&P 500 (ES).
Economic Calendar (All Times Eastern)
07:00 – MBA Mortgage Applications
While typically seen as a low-impact indicator, this data will be closely watched for any surprises due to its sensitivity to interest rates.
08:30 – Initial Jobless Claims
This report has been advanced this week as Thursday is a federal holiday. Given its implications for labor market strength, it could have noteworthy effects on investor sentiment.
10:00 – NY Fed Corporate Bond Market Distress Index
This indicator serves as a pulse on credit market conditions. A significant change here could signal broader market stress.
10:30 – EIA Weekly Petroleum Status Report
The release of this report comes at a time of heightened scrutiny on energy prices and inflationary pressures. It's advisable to keep an eye on potential spillover effects into the broader indices.
Market Structure Note
Please note that while the US stock market will be open for regular trading hours, the US bond market will have an early close at 2:00 PM ET. This adjusted schedule may influence trading volumes and market dynamics as we wind down the year.
Market Analysis: The Path Ahead Amid Holiday-Induced Thin Trading
The trading session was marked by subdued yet erratic price movements, a natural consequence of reduced market participation during the holiday season. Despite some fluctuations, traders largely refrained from aggressively pursuing dips, while upward movements faced difficulties in maintaining momentum.
In the macroeconomic landscape, the recently released Federal Reserve minutes underscored significant internal divisions regarding prospective interest rate cuts. This lack of consensus diminishes certainty about future rate adjustments, extending uncertainty into early 2026.
As we approach year-end, upcoming trading dynamics will be affected. With Wednesday signaling the final trading day of the year, participants should anticipate a landscape characterized by uneven liquidity. This could lead to increased volatility, particularly around key support and resistance levels, with a heightened potential for stop hunts as markets test widely recognized highs and lows.
Overnight NY Market Forecast: A Scenario Analysis
As we observe the market dynamics, we present a scenario plan that outlines potential movements for the coming hours.
Base Case: Currently, the market is oriented towards a bearish sentiment while trading below the 6950-6953 range. We anticipate a two-way trading environment within the 6928-6950 band, characterized by sharper price fluctuations than typically expected as we approach year-end.
Bullish Scenario: A definitive reclaim and sustained trading above 6953.50 would open pathways for an upward movement into the 6958-6961 range, and potentially to the psychological level of 6969-6970 thereafter.
Bearish Scenario: Conversely, a significant breach below 6928.25 could trigger a cascade towards 6926.25, followed rapidly by 6918.00. Should selling pressure intensify, the 6900 mark may become the next focal point for traders.
SETUP 1 (A++) - Long - Reclaim and go (support to value)
Entry
• Buy 6934.00-6935.00 (only after the reclaim hold is visible)
Hard SL
• 6925.75 (below 6926.25, with extra buffer)
Targets
• TP1 6953.50
• TP2 6957.75
• TP3 6961.50
SETUP 2 (A++) - Short - Rejection fade from upper cap (premium to PDL)
Entry
• Sell 6956.75-6958.00
Hard SL
• 6964.00 (above the 6961.50/6960.75 cap with buffer)
Targets
• TP1 6940.75
• TP2 6930.00
• TP3 6918.00
Good Luck !!!
SPX (S&P 500 Index)

S&P500 rejection can cause a very bearish start to 2026.The S&P500 index (SPX) hit last Friday its Higher Highs trend-line and got rejected, so far not aggressively.
The 1D RSI rejection though on a Lower Highs trend-line that goes as back as the September 22 High, illustrates a massive Bearish Divergence (Lower Highs against price's Higher Highs), has the potential to accelerate the decline first to the 1D MA100 (red trend-line) and then the lower Support Zone.
As long as the Higher Highs trend-line holds, we expect the index to target 6510 (top of Support Zone) at least within January 2026.
---
** Please LIKE 👍, FOLLOW ✅, SHARE 🙌 and COMMENT ✍ if you enjoy this idea! Also share your ideas and charts in the comments section below! This is best way to keep it relevant, support us, keep the content here free and allow the idea to reach as many people as possible. **
---
💸💸💸💸💸💸
👇 👇 👇 👇 👇 👇

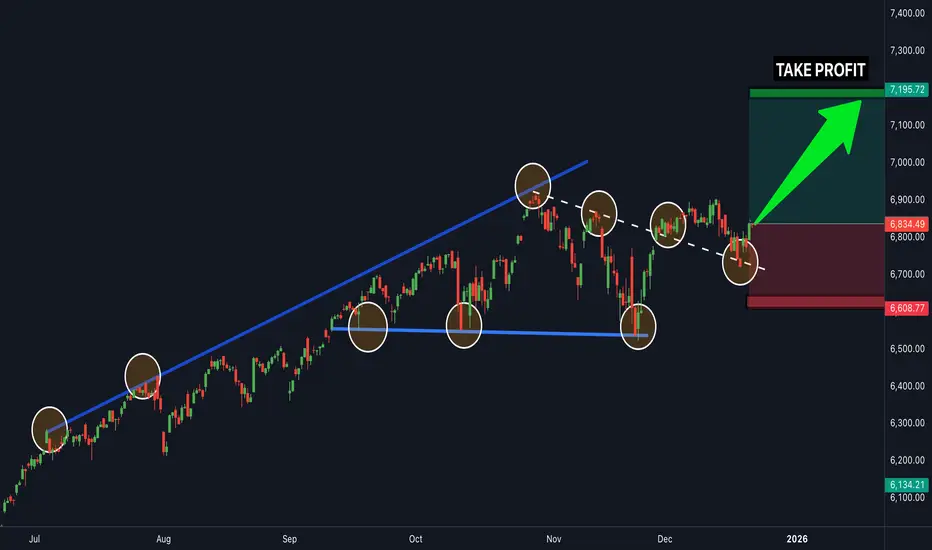
SPX.. buy now it's going upSPX 500 is in a clear upwards channel and has broken the last bit of resistance (white trendline line shown) - this is a clear confirmation that the next target will be the next resistance zone to the upside shown above (this is a great buy trade opportunity) - buy the SPX 500 now... it's going up

SPX: ready for quiet holidaysAs it was expected, the positive sentiment was holding on US equity markets during the first Christmas week. This sentiment could be treated as “traditional” as holiday season is approaching and especially year-end and book-closing. In this manner, inventors could book positive evaluations of their investments, which is quite important for the presentations of yearly results. What will January 2026 bring in terms of the sentiment, analysts' opinions are divided. Nevertheless, the S&P 500 managed to reach a fresh, new all time highest level at 6.944, trading in a positive mood for the last five trading days.
After markets reopened from the Christmas holiday, Nvidia shares rose, helped by news of its major AI technology deal. Nvidia’s AI licensing agreement dominated headlines, contributing to market optimism despite the holiday low-volume trading environment. Apple shares also climbed modestly. Other influential S&P 500 names like Tesla fell amid a regulatory investigation, and Micron and Lam Research showed mixed moves. A less expected driver this week was a copper miner stock emerging as one of the best performers in the S&P 500, highlighting how rotation into value/mining names briefly outpaced some tech megacaps.
Shares of Paramount surged after Oracle co-founder Larry Ellison backed a substantial equity financing push in a bid for Warner Bros. Discovery, a development that can influence broader media and tech sentiment.
As we are approaching the New-year holiday and non-working days, it could be expected that the markets will be in a silent-mood for the year end. Investors are usually using this period of the year to take some rest, in which sense, it could be expected that the S&P 500 will close the year 2025 somewhere around its ATH. What will the year 2026 bring, is to be seen.

$SPY & $SPX Scenarios — Week of Dec 29, 2025 to Jan 2, 2026 🔮 AMEX:SPY & SP:SPX Scenarios — Week of Dec 29, 2025 to Jan 2, 2026 🔮
🌍 Market-Moving Headlines
• Holiday liquidity regime: Thin volume all week, exaggerating moves on otherwise modest data.
• Year-end positioning: Window dressing, tax-loss cleanup, and book-closing flows can override fundamentals.
• Fed minutes risk: Even in a quiet tape, tone from December FOMC minutes can spark rate-sensitive moves.
📊 Key Data & Events (ET)
Monday Dec 29
• 10 00 AM — Pending Home Sales (Nov)
Tuesday Dec 30
• 9 00 AM — Case-Shiller Home Prices (Oct)
• 9 45 AM — Chicago PMI (Dec)
• 🚩 2 00 PM — FOMC Meeting Minutes (Dec)
Wednesday Dec 31
• 8 30 AM — Initial Jobless Claims (Dec 27)
Thursday Jan 1
• New Years Day — Markets Closed
Friday Jan 2
• No major U.S. data scheduled
🧭 Trading Context
• Expect low participation and wider intraday ranges on small catalysts.
• Trend continuation or mean reversion will be driven more by flows than fundamentals.
• Volatility sellers often dominate unless minutes surprise.
⚠️ Disclaimer: Educational and informational only — not financial advice.
📌 #SPY #SPX #markets #macro #Fed #FOMC #yearend #trading

S&P 500 Index Approaches the 7,000-Point LevelOver the past five trading sessions, the U.S. equity index S&P 500 (SPX) has maintained a consistent bullish bias, posting gains of more than 2% in the short term and moving closer to the psychological 7,000-point level. For now, the index has managed to sustain firm buying pressure, supported by optimism around potential interest rate cuts in 2026 by the Federal Reserve. This scenario could foster a lower cost of borrowing, helping market liquidity remain stable while supporting investment and consumption—key pillars for equity market confidence. If this perception holds, it could continue to act as a positive catalyst allowing the SPX to maintain sustained buying pressure toward the close of 2025. As long as confidence remains in place, buying pressure may continue to shape short-term price action.
The Bullish Trend Holds
For several months now, the SPX has sustained a consistent bullish trend across its average price movements, keeping the index very close to the 7,000-point area. At this stage, no meaningful bearish corrections have emerged that would threaten the bullish technical structure, which remains the dominant formation to monitor. However, it is important to note that as prices have reached new highs in recent sessions, a sense of neutrality has begun to appear in price action. If this indecision persists, it could open the door to short-term bearish corrections.
RSI
At present, the RSI remains above the neutral 50 level, suggesting that average momentum over the past 14 sessions continues to favor buyers. However, a notable technical development has emerged: while the SPX price posts higher highs, the RSI shows lower highs, forming a bearish divergence. This pattern may signal a recent excess in buying pressure, increasing the likelihood of selling corrections in the coming trading sessions.
MACD
The MACD continues to display a histogram oscillating very close to the neutral zero line, reflecting persistent neutrality in short-term moving average momentum. If this behavior continues, it may point to an ongoing indecision phase in SPX price action, potentially allowing for a period of consolidation and the emergence of short-term pullbacks.
Key Levels to Watch
7,000 points – Key resistance: A major psychological level that stands out as the most relevant resistance given the lack of prior price references. Sustained moves above this area could trigger a more aggressive bullish bias and extend the current uptrend.
6,900 points – Nearby support: A level associated with the neutrality observed around recent all-time highs. Price action holding near this zone could reinforce a more stable consolidation phase and favor the formation of a short-term sideways range.
6,800 points – Major support: An area where the bullish trendline aligns with the 50-period simple moving average. Bearish moves below this level could put the broader bullish structure at risk and open the door to a more dominant selling bias in the sessions ahead.
Written by Julian Pineda, CFA, CMT – Market Analyst

$SPX 6970-6990 before a pullbackCalled for a move to ATH when SP:SPX was at 6800. And we are now at 6930. Looking for another move higher from here to 6970-90 before a pullback.

ES (SPX, SPY) Analysis, Key Zone, Setups for Fri (Dec 26)Market Overview: Context for Tomorrow
Trend Analysis: The market maintains a risk-on sentiment as we approach the holiday period, characterized by strong index performance accompanied by light trading volume. This condition often results in a “grind up or chop up” scenario, although we may witness abrupt price movements due to diminished liquidity.
E-mini S&P 500 (ES) Positioning: Currently, prices are situated in the upper range of the recent swing high, indicating a premium area. This positioning heightens the probability of a retracement towards mid-range levels before any further upward momentum takes place.
Looking Ahead to Tomorrow: Investors should anticipate one of two scenarios: (a) a decisive dip that finds support at the Volume Weighted Average Price (VWAP) or Value Area Low (VAL), followed by a re-acceleration towards the Previous Day High (PDH) or Value Area High (VAH), or (b) a definitive rejection at the PDH/VAH that results in a retracement back to the VWAP/VAL zone.
Event Risk - Friday Schedule (ET):
Macro Releases: No major U.S. economic data is scheduled for release tomorrow.
Notable Item: The NY Fed Staff Nowcast will be published at 11:45 a.m. ET, though it typically produces limited market impact relative to key indicators like CPI or NFP.
Implications for the Market: With fewer scheduled economic shocks on the calendar, we can expect a market environment driven more by trading flows than by significant data releases, indicative of a "holiday hangover" effect.
New York Session Forecast
As we head into the New York trading session, the anticipated price path for the day suggests a cautious approach.
The primary range rotation is centered around key levels at 6982.50 (Y-POC) and 6976.75 (VWAP). We expect two-way trading to persist within the confines of 6971.50 to 6988.50 until we see a clearer indication of cash volume dynamics in New York.
Bullish Scenario:
In a bullish scenario, we would need to maintain support in the range of 6976.75 to 6971.50 on any pullbacks. A sustained rally would then target upward moves, aiming for 6988.00 to 6988.50. A decisive break above 6988.50 could trigger a significant advance towards the 6996 to 7000 range.
Bearish Scenario:
Conversely, if we experience a failed attempt to break into the 6988.00 to 6996 area—indicative of a lack of acceptance—we may see a pullback towards 6976.75. A breach of the critical support at 6971.50 could lead to testing lower levels at 6962.75 and 6957.25.
A++ SETUP 1 - LONG (pullback reclaim)
Entry: 6976.75-6971.50
Trigger: 15m tags pocket and closes back above 6976.75 -> 5m higher-low -> 1m pullback holds then push
SL: 6966.00
• TP1: 6988.50
• TP2: 6996.00-7000.00
• TP3: 7006.00-7012.00
A++ SETUP 2 - SHORT (top rejection)
Entry: 6988.00-6996.00
Trigger: 15m pushes into band then closes back below 6988.50 -> 5m lower-high -> 1m pullback fails then drop
SL: 6999.00
• TP1: 6971.50
• TP2: 6962.75
• TP3: 6957.25
Good Luck !!!

$SPY & $SPX Scenarios — Friday, Dec 26, 2025🔮 AMEX:SPY & SP:SPX Scenarios — Friday, Dec 26, 2025 🔮
🌍 Market-Moving Headlines
• Post-holiday, low-liquidity session: No scheduled macro data — price action driven by flows, positioning, and thin volume.
• Year-end dynamics: Window dressing, tax positioning, and reduced participation can exaggerate moves without real conviction.
📊 Key Data & Events (ET)
• None scheduled
⚠️ Disclaimer: For informational use only — not financial advice.
📌 #SPY #SPX #markets #trading #holiday #yearend

SPX500 | Santa Rally Pushes Index Toward New ATHSPX500 | Technical & Fundamental Overview
The S&P 500 hit a new record high, extending its winning streak for the fourth consecutive session as the Santa Rally continues to support bullish sentiment.
U.S. GDP grew at a 4.3% annualized pace in Q3, the fastest growth in two years and well above expectations.
Strong consumer spending drove the expansion, easing concerns that a cooling labor market could weigh on household demand and reinforcing confidence in the U.S. economic outlook.
Technical Outlook
SPX500 is currently trading near its all-time highs (ATH).
The structure suggests a potential breakout to a new ATH around 6957, especially if the price can close a 1H or 4H candle above 6920.
If the market fails to hold above 6920, a retest or consolidation toward the 6895 area may occur before the next directional move.
Key Levels
Pivot Line: 6920
Support: 6897, 6880
Resistance: 6955, 6990
Bias: Bullish above 6920; corrective below it.

SPY (ES-US500-SPX) Weekly Prediction – Outlook (21 DEC)SPY (ES-US500-SPX) Weekly Prediction – Outlook (21 DEC)
📊 Market Sentiment
Market sentiment turned fully bullish after the CPI data came in significantly lower than expected on Thursday. While the expectation was 3.1%, the actual CPI print came at 2.7%, which was a meaningful downside surprise.
This data does not directly determine the outcome of the January FED meeting, as another CPI report will be released on January 13, 2026, which will be far more critical for the FED’s decision making process. However, the current soft inflation trend increased the probability of another lower CPI reading in January, which positively impacted risk sentiment across markets.
📈 Technical Analysis
In my previous SPY analysis last week, I clearly outlined the expectation of an early week pullback followed by a precise reversal level. That scenario played out exactly as anticipated.
Following the CPI release, price completed its reversal and closed the week with very strong bullish price action on Friday. In my opinion, this behavior suggests that the corrective phase has likely ended and price is now preparing for continuation to the upside.
📌 Game Plan
I think price may target the 683.5 level early in the week.
For call options and long positions, the key lower timeframe reaction zones I will be monitoring are 678.25 and 675.25.
If price rallies directly toward 683.5, I plan to sell the majority of my existing call positions around that level. However, if price first tests 678.25 or 675.25 before reaching 683.5, I am considering adding additional call exposure from those zones.
That said, my decision to enter will strongly depend on 1H and 4H candle closes. I will not enter positions in a market that simply breaks through these levels. If price tests these zones and prints strong bullish 1H or 4H closes, that is when I will begin executing call option entries.
💬 For deeper sentiment and strategy insights, subscribe to my Substack free access available.
This analysis is for educational purposes only and does not constitute financial advice. Always conduct your own research before trading or investing.

S&P500 Time to buy again!The price can form a head and shoulders pattern. If that is happen, expect a significant price increase.
PRIVIOUS ANALYSIS

ES (SPX, SPY) Analysis, Key Zones, Setups for Wed (Dec 24th)Market Overview: Insights from Today's Trading
U.S. equities closed higher once again, reaching fresh highs primarily driven by large-cap technology and AI stocks, although broader market participation appeared mixed. The momentum was fueled by stronger-than-expected Q3 GDP data, which, combined with a dip in consumer confidence, suggests that economic growth may remain robust even as interest rates trend lower in the future. As we approach the holiday season, thinner liquidity in the markets is becoming increasingly relevant, often resulting in subdued trading activity punctuated by abrupt moves in response to key economic releases.
Analyzing the structure, the E-Mini S&P 500 (ES) is positioned in the upper range of recent trading and is approaching a notable overhead supply zone, characterized by the recent swing highs. The recent upward movement was significant, demonstrating a rapid recovery from the low 6900s to the mid-to-high 6900s; however, the price is currently stalling beneath a well-defined resistance level. This scenario typically leads to one of two potential developments:
1. A prolonged period of consolidation beneath the resistance, followed by a sharp breakout, often triggered by key economic data released at 8:30 AM.
2. A failure to maintain support at mid-range levels, which could result in a downward rotation toward previous demand zones, commonly aligning with metrics such as VWAP, Y-VAL, or PDL.
Market Update: Key Economic Indicators and Early Closures
This Wednesday, investors should pay close attention to the following economic releases:
- 8:30 AM ET: Initial Jobless Claims report, adjusted for the holiday schedule.
- 8:30 AM ET: Advance Durable Goods Orders and the Philly Fed Non-Manufacturing Survey will also be released.
- 11:30 AM ET: Weekly Economic Index will provide additional insights into economic trends.
Please note that equity markets will close early at 1:00 PM ET, while bond markets are set for an even earlier close at 2:00 PM ET.
In noteworthy news from the energy sector, the EIA Weekly Petroleum Status Report will not follow its regular schedule this week. The next anticipated release is slated for December 29, 2025.
Overnight Forecast into the NY Session
Base Case Scenario:
Expect a period of consolidation overnight, with prices likely fluctuating within the range of 6948 to 6964. The key moment will come during the 8:30 AM ET data announcement, which should provide a clearer directional bias. If the support level at 6948-6938 holds through this data window, we anticipate another attempt to test the resistance levels at 6963.75 and 6968.75. However, a failure to surpass 6968.75 typically leads to a retraction back towards the 6947-6943 region, with a potential dip to 6938.
Upside Potential:
A decisive push above 6968.75, particularly if it sustains on a pullback rather than merely wicking through, could pave the way for movement toward the 6985-7000 range. Given that tomorrow marks a shortened trading session, these higher targets may be more suitable for “runner” strategies unless we see significantly robust momentum.
Downside Risk:
Conversely, if the 6938.50 level gives way and fails to rebound swiftly, the market is likely to rotate towards the 6919-6913 zone. This area represents the initial support level where buyers may have a viable opportunity to regain control.
A++ Setup 1 - Short rejection from the top
Entry: 6962.50-6966.00 (only after a test into 6963.50-6968.75 fails and price closes back below 6963.75)
Stop: 6974.25
TP1: 6943.50
TP2: 6938.50
TP3: 6919.25-6918.75
A++ Setup 2 - Long breakout and hold
Entry: 6970.50-6972.25 (only after a 15m close above 6968.75, then a pullback that holds above 6963.75)
Stop: 6961.75
TP1: 6998.75-7000.00
TP2: 7012.50
TP3: 7036.75-7040.00
If you enjoy our analysis, please consider boosting and sharing our post.
Good Luck !!!

$SPY & $SPX Scenarios — Wednesday, Dec 24, 2025🔮 AMEX:SPY & SP:SPX Scenarios — Wednesday, Dec 24, 2025 🔮
🌍 Market-Moving Headlines
• Holiday-thinned session: Early close dynamics and reduced liquidity can exaggerate moves.
• Labor check-in only: Jobless claims is the sole macro print before markets wind down for Christmas.
📊 Key Data & Events (ET)
8 30 AM
• Initial Jobless Claims (Dec 20): 225,000
⚠️ Disclaimer: For informational use only — not financial advice.
📌 #SPY #SPX #JoblessClaims #markets #trading #macro #stocks

SPX500 at Range Highs — Breakout or Another Rejection?Summary:
SPX500 has rallied back into a well-defined resistance zone after a fake downside penetration from demand. Price is once again compressing near range highs, making this area critical for the next directional move.
Technical Breakdown:
Market Structure: Price remains in a broader range, respecting clear demand (lower purple zone) and resistance (upper purple zone). Higher lows from the recent demand reaction show short-term bullish momentum within the range.
Key Levels:
The range box midline (~6,767) has acted as a clean equilibrium level with multiple reactions — price acceptance above it favors buyers.
The recent fake penetration below mid-range support (highlighted on your chart) suggests sell-side liquidity was swept before aggressive buying stepped in.
Resistance Behavior: The upper zone has at least three clear touches, confirming it as strong supply. Each test shows slowing momentum, signaling decision time.
Candlestick Context: Strong bullish impulses from demand with shallow pullbacks indicate active buyers, but no confirmed breakout close above resistance yet.
Fundamental Context:
With US indices supported by expectations of looser financial conditions in 2026 and resilient corporate earnings, dips continue to attract buyers. However, year-end positioning and macro data sensitivity keep upside capped near key technical levels.
Key Price Levels (3-touch validation):
Resistance: 6,900–6,920 (range highs, multiple rejections)
Mid Support: ~6,765–6,770 (range equilibrium, role flip level)
Demand Zone: 6,560–6,600 (major buy-side reaction area)
Upside Target (on breakout): 6,980–7,000
Downside Target (on rejection): 6,650 then 6,580
Takeaway:
➡️ Bullish if price accepts and closes above 6,920, opening the door for range expansion higher.
➡️ Bearish / mean-reversion if resistance holds and price loses 6,765, targeting the demand zone again.
#SP500 #Indices #PriceAction #TradingView #MarketStructure #SupplyAndDemand

ES (SPX, SPY) Analysis, Levels, Setup for Tue (Dec 23rd)MARKET OVERVIEW: Key Highlights of the Day
Investor sentiment remained resilient as equity markets advanced ahead of a holiday-shortened trading week, with large-cap technology and AI-related stocks driving the momentum. This robust performance sets a positive tone as we approach year-end. Notably, hard assets, particularly gold and silver, displayed continued strength, indicating that investors are still seeking hedges amid a rising equity environment. Meanwhile, oil prices remain sensitive to geopolitical developments. Interest rates held steady without causing significant disruptions.
For the E-mini S&P 500 (ES), the overarching trend remains upward; however, the holiday trading environment can lead to choppy price movements. Currently, the ES is testing the upper boundary of its range, making this nearby resistance level a critical point to watch as we progress into overnight trading and the New York session.
Nvidia's stock rose over 1% following a Reuters report indicating that the company plans to start shipping its H200 chips to China by mid-February. Micron Technology experienced a surge of approximately 4%, while Oracle's shares climbed more than 3%. This movement underscores Nvidia’s profound impact, as it now makes up a remarkable 8% of the S&P 500, marking the highest concentration for a single stock in over fifty years. Institutional investment flows continue to be fueled by ongoing developments in AI infrastructure.
The Federal Reserve concluded its December meeting with a 25 basis point reduction in the federal funds rate, adjusting it to a range of 3.50% to 3.75%. This marks the third consecutive rate cut, bringing rates to their lowest since November 2022. Notably, the committee exhibited a divide, with three members dissenting against the cut, reflecting the most disagreement since September 2019. The updated "dot plot" suggests only one additional 25 basis point cut in 2026, followed by another in 2027.
Equity markets have successfully recovered their December losses, positioning the S&P 500 for what could be its eighth consecutive month of gains, the longest winning streak since 2018. On Monday, nearly 400 stocks within the index posted gains as it approached record highs. Historically, the so-called Santa Claus rally has yielded positive results about 80% of the time, averaging a gain of 1.6% since 1928.
TOMORROW - EVENTS TO RESPECT (ET)
08:30 - GDP (Q3 estimate) + Corporate Profits
08:30 - Durable Goods (advance report)
10:00 - Consumer Confidence
10:00 - New Home Sales
16:30 - API crude oil inventory
Liquidity note: shortened week continues - moves can be sharp, then stall quickly.
NY PATH MAP: Overnight Analysis
The market is expected to navigate a range between 6908.50 and 6948.25. Notably, the “gravity pocket” is identified around the 6929.75 to 6925.75 range. Maintaining a position above 6920.50 is crucial for sustaining a bullish outlook. However, a decisive move between 6936.25 and 6948.25 would likely pave the way toward a target of 6983.00.
Bullish Scenario: For a bullish trajectory, it is imperative for the market to defend the 6920.50 level during the Asian and London trading sessions. A successful reclaim and sustain above 6948.25 in New York would open possibilities for a push towards 6983.00, with 7000.00 serving as an upper stretch target.
Bearish Scenario: On the downside, a rejection within the 6936.25 to 6948.25 range, coupled with a drop below 6908.50, would shift the odds in favor of a move towards 6891.00 to 6887.00. Continued selling pressure could then target levels between 6846.00 and 6840.00.
A++ SETUPS (Level-KZ 15/5/1 execution, two plays only)
A++ SETUP 1 - LONG - Break and hold above R1 (pop-and-go)
15m trigger: full body close above 6948.25
5m confirm: pullback holds 6948.25 and re-closes back above it
1m entry: buy 6946.75 to 6948.25 on the first pullback after the hold is proven
Hard SL: 6935.75
TP1: 6983.00
TP2: 7000.00
TP3: 7070.00
A++ SETUP 2 - SHORT - Rejection from R1 (pop-and-fail)
15m trigger: push into 6936.25 to 6948.25, then 15m close back below 6936.25
5m confirm: re-test of 6933.50 to 6936.25 fails and 5m re-closes lower
1m entry: sell 6932.75 to 6934.25 on the first lower-high after the failure is proven
Hard SL: 6949.75
TP1: 6889.00 (middle of S1)
TP2: 6846.00
TP3: 6820.00
If you enjoy our analysis, please consider boosting and sharing our post.
Good Luck !!!

$SPY & $SPX Scenarios — Tuesday, Dec 23, 2025🔮 AMEX:SPY & SP:SPX Scenarios — Tuesday, Dec 23, 2025 🔮
🌍 Market-Moving Headlines
• Heavy delayed macro dump: Markets digest a backlog of growth, manufacturing, and production data all at once.
• Growth vs slowdown check: GDP revision and durable goods help frame whether the economy is cooling into year-end.
• Consumer pulse: Confidence print may influence risk appetite heading into the holiday-shortened week.
📊 Key Data & Events (ET)
8 30 AM
• GDP Q3 (delayed): 3.2 percent
• Durable Goods Orders Oct (delayed): -1.1 percent
9 15 AM
• Industrial Production Oct: 0.1 percent
• Capacity Utilization Oct: 75.9 percent
• Industrial Production Nov: 0.1 percent
• Capacity Utilization Nov: 76.0 percent
10 00 AM
• Consumer Confidence Dec: 91.7
⚠️ Disclaimer: For informational use only — not financial advice.
📌 #SPY #SPX #GDP #DurableGoods #ConsumerConfidence #macro #markets #trading

S&P500 Elliott Wave Analysis | SPX | SPY This technical analysis is not financial advice. This is bases on Elliott Wave Theory. SP:SPX

S&P500 mini Santa Rally up next on a 1H Golden Cross.S&P500 (SPX) is about to complete a Golden Cross today on the 1H time-frame. The last time it did that was on November 25, almost 1 month ago, while trading on the first Bullish Leg of the current Channel Up pattern.
Following the 1H Golden Cross, the index rallied to the 1.236 Fibonacci extension level, before turning sideways. As a result this could be the mini Santa Rally that the market is waiting, targeting 6920.
---
** Please LIKE 👍, FOLLOW ✅, SHARE 🙌 and COMMENT ✍ if you enjoy this idea! Also share your ideas and charts in the comments section below! This is best way to keep it relevant, support us, keep the content here free and allow the idea to reach as many people as possible. **
---
💸💸💸💸💸💸
👇 👇 👇 👇 👇 👇

SPX.. buy nowSPX 500 is in a clear upwards channel and has broken the last bit of resistance (white trendline line shown) - this is a clear confirmation that the next target will be the next resistance zone to the upside shown above (this is a great buy trade opportunity) - buy the SPX 500 now
ES (SPX, SPY) Week-ahead Analysis (Dec 22-26)This week is notably shortened due to the holiday, resulting in thinner liquidity and heightened volatility. Market participants should prepare for an early close on Wednesday, December 24, with the markets remaining shut on Thursday, December 25. Normal trading hours will resume on Friday, December 26.
Investors should approach breakouts with caution, demanding clearer confirmations at critical levels and exercising stricter time stops.
Multi-Timeframe Analysis (ES)
Weekly Overview:
The broader trend remains upward, suggesting that the larger swing is constructive; however, prices are testing a weekly supply cap near recent highs, entering a premium zone. Momentum has tempered from previous peaks, raising the risk of a "grind and fade" scenario rather than a straightforward continuation.
The market is currently experiencing a rebound leg, yet it is now hitting a daily supply band overhead, where previous selling pressure originated. Upside potential is limited by the upper band near prior highs, while downside risk is anchored by the last swing base and value areas below.
The most recent movement displays an impulsive rally from a base, followed by a controlled pause - though it does not indicate a full reversal at this stage. As long as pullbacks remain above the recently established reclaim shelf (mid to high 6800s), current price action is indicative of "healthy digestion." A breach below this shelf could signal a deeper correction.
1-Hour Context (Intraday):
Prices are currently positioned in the upper range of the recent trading day, approaching key overhead levels. This presents a pivotal moment for either a breakout continuation or a potential failure.
Momentum/Oscillator Analysis (Weekly + Daily):
- Weekly Perspective: Momentum is currently in a neutral zone—not excessively overbought, yet not undervalued either - as it has eased from earlier peak levels.
- Daily Perspective: Momentum has improved off the lows and is showing upward curvature, indicating that dips are being supported; however, the presence of overhead supply may lead to rapid stalls in momentum.
The key trend delineation, or "line in the sand," for market observers currently stands at 6760.
For trading positions resting above this benchmark, any pullbacks can still be classified as "corrections within an overarching uptrend." This suggests that the bullish sentiment remains intact as long as the market holds above this critical threshold. Conversely, a decisive move below 6760 - particularly if there’s acceptance level would signal potential damage to the rebound narrative, indicating that the market is showcasing areas of diminished demand.
NQ Intraday Reference Map:
For the Nasdaq (NQ), immediate resistance is noted between 25600 and 25645, aligning with prior highs and current push zones, followed by further resistance at 25800 to 26000, which serves as the next magnet zone for traders.
On the support side, key levels to watch include 25592 to 25568, which represents a value shelf, descending to the levels of 25504, and further extending to 25393 to 25357, marking the prior day’s low pocket. Should the market breach these levels, the overnight low at 25210 will be significant in assessing downward momentum.
Volatility Metrics Overview
VIX Analysis
The VIX has been trading in the mid-teens recently, with a notable decline observed late last week, indicating a growing risk appetite among investors, albeit with a continued sensitivity to market headlines. FRED's latest reported close was at 16.87 on December 18. However, a subsequent market data feed indicated a significant drop on December 19, with a low/close around 14.91. The takeaway here is that a lower VIX tends to support dip-buying strategies; however, sudden spikes in the VIX during a holiday week often result in sharp mean-reversions.
Rates Volatility - MOVE Index
The MOVE index is currently sitting at approximately 59, indicating a low-to-moderate level of stress in the rates market. This suggests that there is no acute funding stress present, which typically supports equities by mitigating the risk of disorderly sell-offs.
Tail Risk Pricing - SKEW Index
The SKEW index remains elevated in the mid-150s range. This suggests that while the market is not experiencing daily panic, investors are willing to pay a premium for crash insurance, indicating a cautious approach to tail risks.
Options and Positioning
The put/call ratios indicate a measured market sentiment, with the total put/call ratio currently at approximately 0.88 (based on a 10-day moving average), suggesting a balanced approach rather than extreme fear. On a daily basis, the total put/call ratio hovers around 0.86, while the equity put/call ratio is more subdued at about 0.59.
From a qualitative perspective, the VIX trading in the mid-teens, coupled with stable put/call ratios, suggests that dealers are likely positioned closer to long gamma in this range, indicating potential for pinning and mean-reversion behavior unless an external macro catalyst disrupts the current balance. This observation, while not rooted in explicit positioning reports, draws from the context provided by volatility and options data.
Market Breadth and Internals
The NYSE breadth snapshot reveals a positive market internal dynamic, with 1,424 advancing issues versus 1,338 declining, yielding a net advance of 86. The McClellan Oscillator stands at approximately +12.8, indicating that market breadth is not experiencing significant deterioration. Current data suggests we are witnessing a “minor wobble/digestion” phase rather than a full-blown distribution cascade.
Credit and Funding Environment
In the realm of credit markets, US high yield option-adjusted spreads (OAS) are around 2.95%, indicating a tight and orderly credit environment. The NAV of HYG is approximately 80.24, while JNK trades close to 96.82. These observations suggest that the credit markets are not currently signaling a risk-off narrative. However, any rapid widening of spreads may be interpreted as an indicator of shifting sentiment toward a more cautious stance.
Sentiment and Crowd Positioning
The latest reading from the AAII survey reflects a balanced sentiment landscape, with about 44% bullish, 23% neutral, and 33% bearish positions. This lack of overwhelming fear suggests reduced potential for a sustained market squeeze driven solely by under-positioning, unless the price action returns decisively above previous highs.
Cross-Asset and Global Risk Tone
In the cryptocurrency markets, Bitcoin is trading around $88,600, while Ethereum is near $3,000. This firmness in crypto typically aligns with a risk-on sentiment but may also serve as a precursor to heightened volatility should macro developments arise.
Lastly, recent trading has showcased strength in the Nasdaq and tech sectors. Should the Nasdaq (NQ) begin to underperform relative to the S&P 500 (ES) at these elevated levels, it may serve as an early warning signal for a potential fade in risk appetite.
MACRO AND DATA-CALENDAR (EVENT RISK)
Key US Economic Releases This Week (ET)
Monday, December 22
No significant economic data scheduled for release.
Tuesday, December 23
- 8:30 AM: Q3 GDP (delayed due to government shutdown)
- 8:30 AM: Durable Goods Orders (also delayed)
- 10:00 AM: Conference Board Consumer Confidence
Wednesday, December 24** *(Early market close at 1:00 PM ET)
- 8:30 AM: Weekly Jobless Claims
Thursday, December 25
Markets will be closed in observance of Christmas.
Friday, December 26
Markets will reopen with normal hours; however, no notable economic data is scheduled for release.
Event Impact Analysis:
- GDP and Durable Goods: Historically, these releases can lead to rapid volatility spikes, potentially mean-reverting if prices remain confined within established ranges. A breakout, however, could serve as fuel for further trends, particularly if it breaks through resistance levels R2/R3 or support levels S3/S4.
Good Luck !!!
- **Consumer Confidence:** This indicator typically influences equity markets based on growth expectations. A key point of analysis will be the NASDAQ index's reaction, which can provide a clearer picture of risk-on sentiment.
- **Jobless Claims on Early-Close Day:** Expect an increase in volatility, as lower liquidity may lead to exaggerated initial moves, potentially setting traps for traders.
As always, we advise close monitoring of these releases for potential market implications and trends.

ES for the Holiday WeekLooking at ES for the holiday week it seems generally bullish. After bouncing off this weekly support they seem to be targeting this untested daily level at 6907. There is also the 4hr sitting at 6912. Confluence of these levels being so close together makes me think they are targeting this area. If they continue to push with momentum 6942 is in play to attack those previous highs.
Trend plotted by TrenVantage LITE
Trades plotted by BreakPoint LITE

$SPY & $SPX Scenarios — Week of Dec 22 to Dec 26, 2025🔮 AMEX:SPY & SP:SPX Scenarios — Week of Dec 22 to Dec 26, 2025 🔮
🌍 Market-Moving Headlines
• Holiday week liquidity: Thin volumes amplify moves, especially around Tuesday’s data dump.
• Delayed macro catch-up: GDP and durable goods hit at once, giving markets a late-cycle growth read before year-end positioning.
• Consumer confidence update: One of the few forward-looking signals in a quiet, holiday-shortened week.
📊 Key Data & Events (ET)
Tuesday, Dec 23
8 30 AM
• GDP Q3 (delayed): 3.2 percent
• Durable Goods Orders (Oct, delayed): -1.1 percent
9 15 AM
• Industrial Production (Oct): 0.1 percent
• Capacity Utilization (Oct): 75.9 percent
• Industrial Production (Nov): 0.1 percent
• Capacity Utilization (Nov): 76.0 percent
10 00 AM
• Consumer Confidence (Dec): 91.7
Wednesday, Dec 24
8 30 AM
• Initial Jobless Claims (Dec 20): 225,000
Thursday, Dec 25
• Christmas Holiday — Markets Closed
Friday, Dec 26
• No major data scheduled
⚠️ Disclaimer: For informational use only — not financial advice.
📌 #SPY #SPX #markets #macro #holidayweek #GDP #durablegoods #consumerconfidence
