ES (SPX, SPY) Analysis, Key-Zones, Setup for Tue (Feb 10)Continuation of Weekly Analysis | Pre-Wednesday Data Bomb
---
OVERALL BIAS: BEARISH INTO WEDNESDAY (UNCHANGED)
Monday validated the volatility thesis but not the directional conviction. The 76-point intraday range (6,924 to 7,000) showed both sides getting tested. Wednesday's NFP + CPI simultaneous release remains THE event. Light positioning today.
---
1. WHAT ACTUALLY HAPPENED MONDAY
Monday's Session Data (Verified)
- Open: 6,935.50 - Gap DOWN 51 pts from Friday close (6,986)
- High: 7,000.50 - Tested Y-VAH / R2 Psychological Level
- Low: 6,924.25 - Tested S2 Friday Close Area
- Close: ~6,980 - Near Y-POC (6,986)
- Range: 76.25 pts - High volatility pre-data
Weekly Levels vs. Monday Reality
- R2 (7,000): TESTED and REJECTED
- R3 (6,970-6,964): TESTED - passed through both ways
- S1 (6,935-6,942): HELD - opened here
- S2 (6,920-6,932): HELD - low at 6,924.25
---
2. TODAY'S SENTIMENT AND FLOWS
SPX Greek Hedging (Volland Data)
- Delta Hedging: $17.4B - Dealers hedging SPX price moves
- Vega Hedging: $51.4M - Hedging against volatility changes
$17.4B daily delta hedging creates mechanical flow that amplifies moves.
China Data Tonight (20:30 ET)
- CPI YoY: 0.4% exp vs 0.8% prior
- PPI YoY: -1.5% exp vs -1.9% prior
---
3. TUESDAY ECONOMIC CALENDAR
08:30 ET - RETAIL SALES MoM | Exp: 0.4% | Prior: 0.6% | HIGH IMPACT
12:00 - Fed's Hammack Speaks
13:00 - Fed's Logan Speaks
16:00 - Trump on Fox Business - WILD CARD
---
4. KEY LEVELS - Tuesday Feb 10
RESISTANCE
R1: 7,040-7,043 - PWH / ATH Zone
R2: 7,000-7,005 - Psychological (REJECTED Monday)
R3: 6,983-6,986 - Monday High / Y-POC
R4: 6,970-6,975 - Strong High Zone
SUPPORT
S1: 6,964-6,970 - Entry Zone
S2: 6,948-6,952 - Offer Wall
S3: 6,935-6,942 - Monday Open (HELD)
S4: 6,920-6,925 - Monday Low (HELD)
CRITICAL: 6,980 - Y-POC / Monday Close
---
5. BOTTOM LINE
Monday proved the market is coiled but not committed. A 76-point range that ended flat = everyone waiting for Wednesday.
Tuesday Strategy: Trade the range, respect the edges, preserve capital.
Good Luck !!!
Spy!

$SPY & $SPX — Market-Moving Headlines Tuesday Feb 10, 2026🔮 AMEX:SPY & SP:SPX — Market-Moving Headlines Tuesday Feb 10, 2026
🌍 Market-Moving Themes
🧠 Capex Winners vs Losers
Meta spending fears weigh on platforms while Nvidia and infrastructure names absorb AI investment flows
🛍️ Consumer Stress Signals
Pepsi revenue miss raises concern that pricing power is breaking across staples and retail
🛒 E-Commerce Speculation
Shopify volatility builds ahead of earnings following Amazon’s cloud and retail strength
₿ Crypto Confidence Damage
Bitcoin remains rangebound as regulatory scrutiny freezes institutional participation
📊 Data Compression Risk
Markets remain cautious ahead of Wednesday’s delayed labor data release
📊 Key U.S. Economic Data & Fed Events — Tuesday Feb 10 ET
6:00 AM
NFIB optimism index Jan: 99.5
8:30 AM
Employment cost index Q4: 0.8%
Import price index Dec delayed: 0.0%
U.S. retail sales Dec delayed: 0.4%
Retail sales ex autos Dec: 0.3%
10:00 AM
Business inventories Nov delayed: 0.2%
12:00 PM
Cleveland Fed President Beth Hammack speaks
1:00 PM
Dallas Fed President Lorie Logan speaks
⚠️ For informational purposes only. Not financial advice.
📌 #SPY #SPX #RetailSales #AI #Macro #Markets #Stocks #Earnings

$FFIV After Earnings Pullback TradeOverview of the Trade Setup
FFIV reported its earnings after the market closed on January 27th. The following day, January 28th, the stock experienced a gap up of over 10% and traded both higher and lower throughout the session. By the end of the day, FFIV closed with a gain on the day of nearly 8%. Since that initial surge, the stock has gradually pulled back on declining volume and tested the 21-day Exponential Moving Average (EMA). Over the last two trading days, FFIV has closed above the 21 EMA, confirming support at this level. Additionally, the stock has formed a higher low, which is characteristic of an uptrend.
Trade Execution and Risk Management
An alert was placed just above the previous day's high. This alert was triggered shortly before the close of the current trading session. Upon activation, a half-size position was initiated, with the stop loss set at a decisive close below the 21 EMA. This setup provides an attractive risk-reward profile for the trade. As the position develops, further opportunities will be evaluated to potentially increase the position to full size, contingent on favorable risk-reward conditions.
FFIV Earnings Results
F5 Networks (FFIV) reported earnings of $4.47 per share on revenue of $822.47 million for the fiscal first quarter ended December 2025. The consensus estimate for earnings was $3.66 per share with revenue expected at $759.97 million. The Earnings Whisper number was $3.79 per share. FFIV delivered earnings growth of 14.6%, surpassing expectations by 17.94%. Revenue grew 7.30% year-over-year, with a revenue surprise of 8.2%.
Important Disclaimer
Readers are strongly encouraged to conduct their own analysis and adhere to their individual trading strategies. All investments carry inherent risks, and it is essential to make careful and informed decisions when allocating capital in financial markets.

SPY Weekly Outlook – Week 6 of 2026 (Feb 09–13)SPY Weekly Outlook – Week 6 of 2026 (Feb 09–13)
Weekly Recap
Last week, my core projection for SPY was that price lacked a clear directional bias and would trade within a range, reacting from key levels. Price behaved exactly as expected throughout the week, rejecting from those levels and forming short-term bounces.
The framework was simple and worked very well:
If price takes liquidity from a key level and closes above it → buy calls and target the next higher liquidity level.
If price fails to hold the level and closes back below → exit calls, buy puts, and target the next lower key level.
This structure played out cleanly. After 687.25 broke and price closed below it, we shorted SPY and entered puts. Profits were taken sequentially at 684.75 and 676.5.
Once price found a bounce at 676.5, the remaining put position was stopped, and we flipped long into calls on Thursday, anticipating a bounce. That long positioning paid off very well into Friday.
Overall, execution aligned perfectly with the framework, making it a highly successful week.
(For reference, last week’s SPY outlook is shared as a linked idea.)
Scenarios – Prediction
Bullish Continuation (Likely)
I am tracking two possible paths for bullish continuation next week. For SPY to resume its move toward all-time highs, the 690 level must be reclaimed.
Scenario 1:
Price breaks above 690 and secures acceptance above it (a gap up open also qualifies).
In this case, I expect price to move quickly early in the week toward 697.75 and 700.
Bullish Targets:
697.75 → 700
Scenario 2:
Price fails to break 690, pulls back to build energy, and finds support in the 685–680 bounce zone.
If price bounces from this area and creates deviation:
Bullish Targets:
690 → 697.75 → 700
Bearish Scenario
If price breaks and accepts below 675.5, I will consider SPY to have shifted into bearish mode.
In that case, all call and long positions should be closed, and bias should flip to puts.
Bearish Targets:
669 → 649
Position Management Notes
I only consider a level broken after two consecutive 1H candle closes above or below it. If price deviates into a level and then confirms by closing above or below, I treat that as a valid deviation setup.
No trades are taken without confirmation. If price closes back inside a level we assumed was broken or deviated from, again confirmed by two 1H closes the trade idea is invalidated and positions should be exited.
I share deeper US Market breakdowns and mid week scenario updates on Substack. Link is in my profile.
This analysis is for educational purposes only and reflects my personal opinion. It is not financial advice.

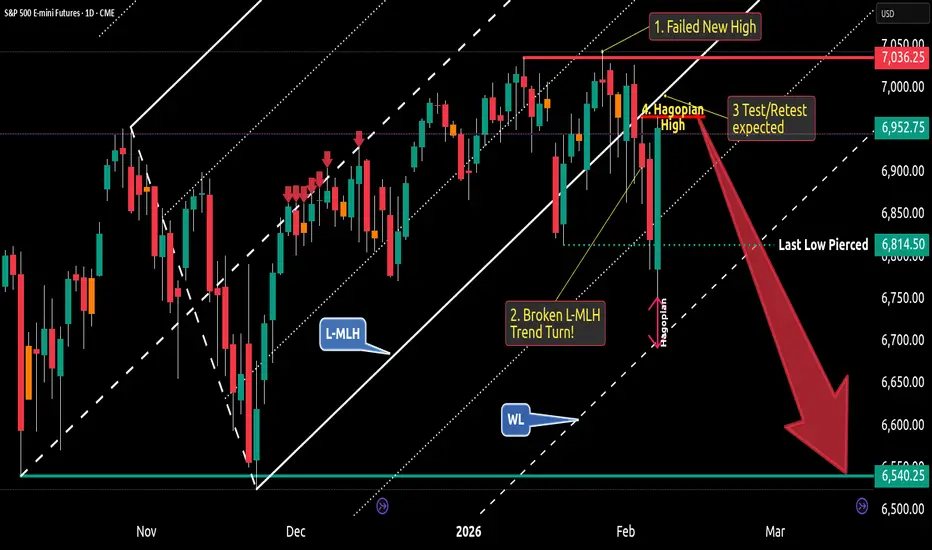
S&P500 Bearish Trend Turn - Here's My Short Trade🔱 As long as price follow the projection of a pitchfork, the trend is OK. But what we see here is a turn - and here's why:
1. The market failed to close above the last high. So, this is a failed new high - or a Double-Top
It is confirmed because the last low is pierced by the last Fridays bar.
2. Price opened & closed below the Lower-Medianline-Parallel = The projection of the fork, which shows the temporary trend, is clearly broken. And this means: Temporary Trend Turn.
3. What we see now with last Fridays bar is a expected Test/Retest of the L-MLH. It's also a slap in the face of early Bears.
4. And if you dig really deep, you also see the Hagopian against the Warning-Line (WL), which confirms the thesis of the Test/Retest of the L-MLH. Because Hagopian says, that price will go farther in the opposite direction than from where price came. In clear words: Price will go higher than the "Hagopian High". And to be precise, I expect the S&P500 to test the L-MLH.
So, week Short hands are completely clueless now. How can it be that price pulls back so hard...?
Thank God I'm trading with the pitchfork. They give me clear rules. And I never have to doubt, because there is zero subjectivity involved.
Can price go higher than the last high at 1. ?
Sure, everything is possible. But - It's not likely to happen, my Pitchfork rules say.
My trade?
I will observe price-action at the L-MLH.
As soon as the markets show it's hand by clear weakness, I'm loading my Boat to the Short side.
My exit? If a full bar is closing above the last high at 1.
There you have it.
👉 FYI: I'm NOT a signal service. I provide educational content. If you want to learn more about trading with the Pitchforks/Medianlines, I'm here for you to help. And of course you can always check out all my links where you find helpful, educational material.
I hope this helps and I wish you all a great and profitable new week.
Day 103 — +$1,286 Profit: Preparing for a Wild WeekEnded the day +$1,286 trading S&P 500 Futures. Apologies for the lack of posts recently—I've been incredibly busy, but I'm making an effort to get these journals out, even if I have to shift to a weekly format. The market has been playing out exactly according to our weekly analysis, which is huge validation for the strategy. We are seeing range expansion everywhere, which tells me this coming week is going to be wild. Big ranges mean big opportunities if you stick to the major levels.
Day 103— Trading Only S&P 500 Futures
Daily P/L: +1286
Sleep: 5 hours
Well-Being: Good
🔔News Highlights: *STOCK FUTURES RISE IN SUNDAY NIGHT TRADE, VIX FALLS AS INVESTORS BRACE FOR BUSY WEEK
📈Key Levels for Tomorrow:
Above 6890 Bullish Level
Below 6870 = Bearish Level

QQQ Weekly Outlook – Week 6 of 2026 (Feb 09–13)QQQ Weekly Outlook – Week 6 of 2026 (Feb 09–13)
Weekly Recap
Last week, my base projection was that the market would lack a clear directional trend and trade in a range, reacting from key levels. Price behaved exactly as expected, rejecting from those levels and forming short term bounces throughout the week.
Relative to SPY, QQQ was noticeably weaker, which made put side trades significantly more effective on QQQ.
After a strong break and acceptance below 618, we entered puts and shorted QQQ. Price moved quickly, reaching 607 on Wednesday and 599.5 on Thursday, where we took profits.
When price closed back above 599.5 on Thursday, we exited the remaining puts in profit and flipped long with calls. By Friday, those call positions had already started printing gains.
Overall, the execution followed the plan cleanly, and it was a highly profitable week.
Scenarios – Prediction
Bullish Scenario (Likely)
I am tracking two potential bullish paths for the coming week.
Scenario 1:
Price opens with a gap up above 609.5, or breaks and holds above this level with two consecutive 1H candle closes.
In this case, my upside targets are:
616.75 → 630 → 636.5
Scenario 2:
Price fails to hold above 609.5 and pulls back to build energy. A retracement into the 600 or 593 area followed by a bounce, confirmed by price running liquidity and closing above the level with two 1H candles, would be treated as a deviation and signal bullish continuation.
In this case, bullish targets remain:
609.5 → 616.75 → 630 → 636.5
Bearish Scenario
If price closes below 593, I will shift my bias to bearish and look to short the market.
Bearish Target:
580
This level represents the strongest potential bounce zone, so I would plan to close approximately 75% of the position there.
Position Management Notes
I only consider a level broken after two consecutive 1H candle closes above or below it. If price deviates into a level and then reclaims or loses it with confirmation, I treat that as a valid deviation setup.
No trades are taken without confirmation. If price closes back inside the level we assumed was broken or deviated from, again confirmed by two 1H closes, the trade idea is invalidated and positions should be exited.
I share deeper US Market breakdowns and mid week scenario updates on Substack. Link is in my profile.
This analysis is for educational purposes only and reflects my personal opinion. It is not financial advice.

ES (SPX, SPY) Weekly Analysis, Key-Zones, Setup for Week of Feb Friday looked impressive on the surface - ES rallied 134 points from Thursday's 6,798 low to close at 6,952. But look under the hood and it tells a different story. NVDA ripped +7.87% and mechanically dragged the index higher while three of the biggest AI capex spenders (AMZN -5.55%, GOOGL -2.53%, META -1.31%) all closed RED. That's not broad buying - that's a squeeze.
The positioning tells the story: 437K spec shorts on ES facing 927K fund manager longs. When NVDA popped, shorts got torched. Price is now sitting in the premium zone near 6,960 with momentum fading into the weekend. The 50-DMA at 6,881 remains unreclaimed resistance, and we're overextended above equilibrium.
The Big Event - Wednesday Feb 11:
NFP + CPI release simultaneously at 08:30 ET. This is unprecedented and creates massive binary risk. Expect subdued, coiled action Sunday through Tuesday as traders position for the data bomb.
Scenario Matrix:
• Strong NFP + Cool CPI (Goldilocks): Target 7,000+ as shorts get squeezed
• Weak NFP + Hot CPI (Stagflation): Target 6,800-6,850, 100-DMA at 6,797 becomes the line
• Mixed data: Choppy, directionless - wait for clarity
Resistance:
• 7040-7043 – PWH / ATH Zone
• 7000 – Psychological Level
• 6964-6970 – Strong High - Rejection Zone
• 6948-6952 – Offer Wall - Heavy Sell Orders
Support:
• 6935-6942 – Equilibrium - First Support
• 6920-6932 – Friday Close Area
• 6881 – 50-DMA - Key MA
• 6797-6800 – 100-DMA = THE LINE
How I'm seeing it:
• Bearish bias into Wednesday's data release
• If gap up to 6,970-7,000 fails: short entries with stops above 7,010
• Light positioning through Tuesday - don't commit size ahead of Wednesday
• A++ setups only at clear range edges with 3:1+ risk-reward
Friday's squeeze doesn't change the bigger picture - labor market deterioration, AI spending ROI questions, Iran risk, none of that got fixed by one green day. The asymmetry favors the bearish side given positioning, but let the data speak on Wednesday.
Good Luck !!!

$SPY & $SPX — Market-Moving Headlines Week of Feb 9–13, 2026🔮 AMEX:SPY & SP:SPX — Market-Moving Headlines Week of Feb 9–13, 2026
🌍 Market-Moving Themes
🧠 AI Capex Anxiety Returns
Meta spending leak revives fears that AI margins will lag spending, reopening the hardware vs platform divide
⚙️ Pick-and-Shovel AI Trade
Rising AI budgets continue to funnel into chipmakers and infrastructure suppliers rather than end platforms
📉 Crypto Trust Shock
Weekend Bitcoin exchange glitch damages confidence and raises volatility risk across crypto-linked equities
📊 Data Delay Volatility
Delayed labor data creates a compressed macro week with multiple releases colliding midweek
🛍️ Consumer Stress Test
Retail sales, confidence, and CPI converge to define whether spending is holding up or cracking
📊 Key U.S. Economic Data & Events Feb 9–13 ET
Monday Feb 9
10:50 AM Atlanta Fed President Raphael Bostic speaks
1:30 PM Fed Governor Christopher Waller speaks
2:30 PM Fed Governor Stephen Miran speaks
5:00 PM Fed Governor Stephen Miran podcast interview
Tuesday Feb 10
6:00 AM NFIB optimism index Jan: 99.5
8:30 AM Employment cost index Q4: 0.8%
8:30 AM Import price index Dec delayed: -0.1%
8:30 AM U.S. retail sales Dec delayed: 0.5%
8:30 AM Retail sales ex autos Dec: 0.3%
10:00 AM Business inventories Nov delayed: 0.2%
12:00 PM Cleveland Fed President Beth Hammack speaks
1:00 PM Dallas Fed President Lorie Logan speaks
Wednesday Feb 11
8:30 AM U.S. employment report Jan: 55,000
8:30 AM U.S. unemployment rate Jan: 4.4%
8:30 AM U.S. hourly wages Jan: 0.3%
8:30 AM Hourly wages YoY: 3.7%
10:10 AM Kansas City Fed President Jeff Schmid speaks
2:00 PM Monthly U.S. federal budget: -50.0B
Thursday Feb 12
8:30 AM Initial jobless claims Feb 7: 222,000
10:00 AM Existing home sales Jan: 4.15M
7:05 PM Fed Governor Stephen Miran speaks
Friday Feb 13 — CPI DAY
8:30 AM Consumer price index Jan: 0.3%
8:30 AM CPI YoY: 2.5%
8:30 AM Core CPI Jan: 0.3%
8:30 AM Core CPI YoY: 2.5%
⚠️ For informational purposes only. Not financial advice.
📌 #SPY #SPX #CPI #Jobs #RetailSales #AI #Fed #Macro #Markets #Stocks #Options

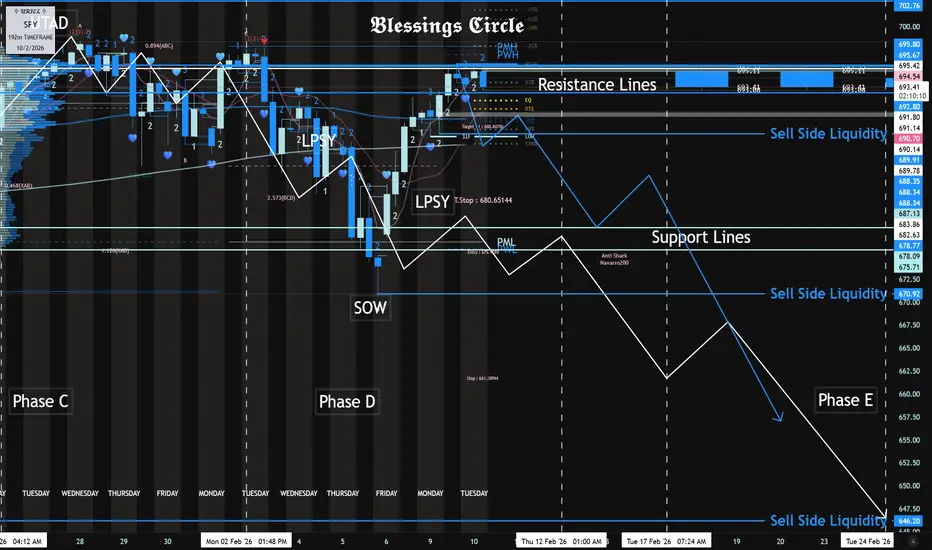
SPY Distribution Schematic Sub 650 by EOMAs Long As 695.80 - 695.67 Resistance Is Respected Today.
The Sells Targets Are As Follows:
SPY Sub 650 by Late Feb.
SPY Sub 600 by End of March.
Part Two:
S&P 500: Wave 5 Aims At $7,580 As Minimum Target After completion of consolidation in wave 4
The last wave 5 is expected to unfold
The minimum target of $7,580 is set at the 38.2% of waves 1-3 distance
Bullish trigger is located at the previous all-time high of $7,002

S&P500 Free Signal! Sell!
Hello,Traders!
SPY taps a well-defined supply zone after buy-side liquidity grab. Clear bearish BOS and rejection from premium signal downside continuation toward sell-side liquidity.
--------------------
Stop Loss: 698$
Take Profit: 690$
Entry: 695$
Time Frame: 2H
--------------------
Sell!
Comment and subscribe to help us grow!
Check out other forecasts below too!
Disclosure: I am part of Trade Nation's Influencer program and receive a monthly fee for using their TradingView charts in my analysis.

SPY Structure Update (Daily)SPY experienced a structural reset during the February–April drawdown, followed by a clear trend shift. Since that transition, price has maintained a steady upward trajectory, with all key EMAs remaining in healthy alignment well above the 200 EMA.
Short-term and intermediate EMAs continue to support price, confirming that the broader trend structure remains intact rather than corrective.
Momentum & Participation
RSI: Holding near the neutral 50 level, reflecting balanced conditions with a slight upward bias rather than exhaustion.
On-Balance Volume (OBV): Showing early improvement, suggesting participation remains constructive and supportive of trend continuation.
Summary:
Trend structure remains healthy on the daily timeframe. Momentum is stable, participation is supportive, and no structural degradation is present at this time. This remains a structural read of current conditions, not a prediction.

Stock Market Forecast | BTC TSLA NVDA AAPL AMZN META MSFTWelcome to your essential weekly guide for navigating the dynamic stock market! In this in-depth analysis, we provide a comprehensive stock market forecast covering key movers like the S&P 500 CME_MINI:ES1! (SPY) and Nasdaq 100 CME_MINI:NQ1! NASDAQ:NDX (QQQ), alongside a detailed Bitcoin ( CRYPTOCAP:BTC ) analysis. We dive deep into major large-cap stocks, including Tesla (TSLA), Nvidia (NVDA), Apple (AAPL), Amazon (AMZN), Meta (META), and Microsoft (MSFT), offering crucial insights for your day trading and investing strategies.
This video breaks down complex market movements using advanced technical analysis, identifying critical support and resistance levels. We also analyze sector rotation, market sentiment, dark pool activity, and upcoming earnings reports, integrating key macroeconomic data to pinpoint high-probability market scenarios for the week ahead. Whether you're focused on individual stocks or broader market trends, our financial analysis aims to equip you with actionable knowledge. Discover the future of the stock market and gain valuable trading tips to stay ahead!
Timestamps are provided below so you can easily jump to specific tickers and chart analysis that matter most to your portfolio.
0:00 Intro
0:14 Sector Data & Rotation
1:49 Sentiment Data
2:07 Dark Pools (QQQ / PSQ)
4:03 Rate Cut Odds
4:29 Earnings Calendar
4:53 Economic Data Next Week
5:21 SPY Technicals
7:36 MAG7 Dark Pool Context
9:23 QQQ Technicals
11:58 Bitcoin Technicals
18:01 Tesla (TSLA)
20:02 Meta (META)
23:50 Amazon (AMZN)
26:30 Microsoft (MSFT)
30:18 Google (GOOGL)
32:15 Apple (AAPL)
34:12 Nvidia (NVDA)
35:39 Wrap Up

SPY: Short Signal with Entry/SL/TP
SPY
- Classic bearish formation
- Our team expects fall
SUGGESTED TRADE:
Swing Trade
Sell SPY
Entry Level - 690.62
Sl - 692.78
Tp - 684.19
Our Risk - 1%
Start protection of your profits from lower levels
Disclosure: I am part of Trade Nation's Influencer program and receive a monthly fee for using their TradingView charts in my analysis.
❤️ Please, support our work with like & comment! ❤️


QQQ Weekly Outlook – Week 5 of 2026 (Feb 02–06)QQQ Weekly Outlook – Week 5 of 2026 (Feb 02–06)
Weekly Recap
Last week, the market followed our bullish framework perfectly. QQQ fully respected the bullish scenario, delivering a clean and profitable week. The market opened with a gap up and reached all bullish targets, allowing positions to be closed in profit.
After hitting those targets, price moved back into a range and started to show some retracement following the Mid Week update. I’m also sharing last week’s QQQ Weekly Outlook on the side for reference.
At this stage, I see increasing indecision in the market. Below, I’m outlining my strategy to navigate this uncertainty.
Scenarios – Prediction
Scenario: The Range
At the moment, I do not see a clear directional bias. Price is trading between well defined key levels, and I expect range behavior unless those levels are decisively broken.
My base case is a range bound market, where price reacts from the Range High and Range Low zones and rotates back into the range.
Deviations into these areas followed by a close back inside the range would keep price compressed within its internal structure. A strong break and acceptance beyond the range boundaries would signal the market’s true directional bias.
Key Levels to Watch / Trade
Range High: 636.5
Range Low: 607 – 599.5
Mid Range / Internal Liquidity: 630 – 618
Game Plan
If price sweeps liquidity at one of these key levels and then closes back inside the range, I will look to trade in the opposite direction of the liquidity grab.
The core idea is to fade moves where traders get trapped thinking the level has broken, only for price to reverse back into the range.
Example:
If the 618 level gets tapped and price closes back above it with either two 1H candles or one 4H candle, I will treat that as a deviation and look for call side setups.
If, instead, price breaks a key level with strong acceptance and closes firmly above or below it, that would suggest continuation in that direction.
Example:
A strong close below 618 would shift my focus toward the Range Low at 607, where I would look to trade the downside using puts.
Position Management Notes
Positions should only be taken after confirmation, either through a clean break or a clear deviation at key levels. If price closes back against the direction of the expected move, the setup is invalidated and the position should be stopped.
For example, if 618 breaks strongly and I enter short, but price then reclaims 618 with two consecutive 1H closes above it, that would invalidate the short setup and signal the need to exit.
I share deeper US Market breakdowns and weekly scenario updates on Substack. Link is in my profile.
This analysis is for educational purposes only and reflects my personal opinion. It is not financial advice.

PUT/Call Buy signal was given at the close 2/5We had an A x 1.618 to = wave C at the low in the cash sp 500 this now can be counted 2 ways this wave simple wave 4 low it also held .786 This is at 80% odds this would give 7021/7031 target by 2/9 to 2/11 Cycle turn . Or the bearish or should i say very bearish count wave abc down for wave A of the crash this is now 60 % I took profit on open I went long in after market when I saw the math for a 15 % long I am in 100 % now . and will relax today and watch structure . Best of trades WAVETIMER

ES (SPX, SPY) Analysis, Key-Zones, Setup for Fri (Feb 6)Yesterday was rough for tech with Nasdaq dropping over 1.3% after GOOGL's capex guidance spooked the market. MSFT down nearly 5% didn't help either. But overnight we got some relief - Amazon announcing $200B in AI infrastructure spending gave futures a decent lift. VIX pulled back from the 21+ levels which is helping stabilize things a bit.
ES bounced off the 6820 area and pushed back up toward the prior range. We're currently sitting around the 6850-6860 zone which is right at VWAP and the prior day's equilibrium. The bounce looks corrective so far rather than impulsive.
Forecast:
- Overnight: Choppy consolidation with slight upward drift
- Morning Session: Expecting a push into 6865-6875 resistance zone
- Afternoon: Likely fade if rejection at resistance holds
- Daily Close: Targeting below 6850 if short setup triggers
- Expected Range: 6825 to 6890
- Most Likely Path: Grind up into 6865-6875, find sellers, mean revert back toward 6840-6825
Friday Events:
- Pre-market: Watching for continuation of tech bounce
- Morning: Jobs data aftermath still influencing sentiment
- VIX: Currently around 20 - elevated but cooling
- After the bell: Light earnings calendar
Resistance:
- 6960-7005 – Major resistance, 7005 is the RTH High from earlier this week
- 6900-6920 – Upper resistance zone, would need strong momentum to reach
- 6880-6890 – Secondary resistance, this is where the short thesis gets invalidated
- 6865-6875 – Primary zone of interest, entry zone for mean reversion short
Support:
- 6845-6840 – First support and T1 target for shorts
- 6825-6835 – T2 target zone, prior support area
- 6800-6820 – Major support and T3, this is the key level bulls need to hold
- 6760-6780 – Deep support, only in play if 6800 breaks
Critical Level:
- 6850 – VWAP and equilibrium pivot, the line in the sand for intraday bias
Strategic Bias - Mean Reversion Short:
The setup here is a mean reversion short looking for a fade off the 6865-6875 resistance zone. Here's the thinking:
- Structure: The 1H chart shows a lower high pattern forming. Yesterday's selloff created a clear supply zone in the 6865-6890 area. The overnight bounce looks like a retracement into that supply rather than a trend reversal.
- Context: Despite the bounce, the broader picture still shows weakness. Tech got hit hard and one Amazon headline doesn't fix the GOOGL/MSFT damage. Buyers need to prove themselves above 6880 for me to flip bullish.
- The Play: Looking for price to push into 6865-6875 and show rejection (wicks, failed breakout, momentum divergence). If we get that, the trade is short targeting VWAP at 6850 first, then 6840, with a runner toward 6825.
- Risk: Stop above 6881. If price closes above that level with momentum, the lower high thesis is dead and shorts need to step aside.
- Invalidation: A strong push through 6890 with follow-through would shift bias to neutral/bullish and open up a run toward 6920+.
How I'm seeing it:
- Bearish bias below 6880, looking for mean reversion short at 6865-6875
- First target is VWAP at 6850, then 6840, extended target 6825
- If 6881 breaks with conviction, step aside - bulls taking control
- Below 6800 would confirm broader weakness and open 6760-6780
The overnight bounce gave us a setup. Now it's about waiting for price to reach the zone and show its hand. No need to chase - let the trade come to us.
Good Luck !!!

SPY Weekly Outlook – Week 5 of 2026 (Feb 02–06)SPY Weekly Outlook – Week 5 of 2026 (Feb 02–06)
Weekly Recap
Last week, SPY respected our bullish framework perfectly, resulting in a clean and profitable execution. The market opened with a gap up and reached Bullish Target 1, where we took partial profits and reduced exposure.
We then carried the remaining position toward the 700 level with a break even stop. However, price failed to expand further, closed back inside the range, and started to retrace after the mid week. As a result, the remaining position was stopped out around breakeven.
(For reference, I’m sharing last week’s SPY Weekly Outlook on the side.)
At this stage, I see growing indecision in the market, and below I outline my strategy to navigate this environment.
Scenarios – Prediction
Scenario: Range Play
At the moment, I do not see a clear directional bias. Price is trading between well defined key levels and I expect reactions from these zones.
My base case is a range bound market, where price gets rejected from the Range High and Range Low areas and rotates back inside the range.
Deviations into these levels followed by acceptance back inside the range would keep price compressed within its internal structure. A strong break and acceptance beyond the range boundaries would signal the market’s true directional bias.
Key Levels to Watch / Trade
Range High: 697.75
Range Low: 676.5 – 669.5
Mid Range / Internal Liquidity: 687.25 – 684.25
Game Plan
If price sweeps liquidity at one of these key levels and then closes back inside the range, I will look to trade in the opposite direction of the liquidity grab.
The core idea is to fade moves where traders get trapped thinking the level has broken, only for price to reverse back into the range.
Example:
If the 676.5 level gets tapped and price closes back above it with either two 1H candles or one 4H candle, I will treat that as a deviation and look for call side setups.
If price instead breaks a key level with strong acceptance and holds above or below it, that would signal continuation beyond the range.
Example:
A strong close below 684.25 would shift my focus toward the Range Low at 676.5, where I would look to trade the downside using puts.
Position Management Notes
Positions should only be taken after confirmation, either through a clean break or a clear deviation at key levels. If price closes back against the direction of the expected move, the setup is invalidated and the position should be stopped.
For example, if 684.25 breaks strongly and I enter short, but price then reclaims 684.25 with two consecutive 1H closes above it, that would invalidate the short setup and signal the need to exit.
I share deeper US Market breakdowns and weekly scenario updates on Substack. Link is in my profile.
This analysis is for educational purposes only and reflects my personal opinion. It is not financial advice.

$SPY & $SPX — Market-Moving Headlines Friday Feb 6, 2026🔮 AMEX:SPY & SP:SPX — Market-Moving Headlines Friday Feb 6, 2026
🌍 Market-Moving Themes
☁️ Cloud Confidence Restored
AMZN earnings reverse the AI capex panic as AWS profit growth proves spending is paying off
🚗 Legacy Auto Breakdown
Ford EV losses confirm widening gap between legacy automakers and Tesla as price wars intensify
📱 Ad Tech Surprise
SNAP earnings signal renewed advertiser demand and Gen Z engagement after years of stagnation
📊 Jobs Day Volatility
Non-Farm Payrolls set the tone for rates expectations, risk appetite, and end-of-week positioning
🛡️ Gold as Shock Absorber
Gold remains bid as hedge against both recession fear and inflation surprise from jobs data
📊 Key U.S. Economic Data Friday Feb 6 ET
8:30 AM
U.S. employment report Jan: 55,000
U.S. unemployment rate Jan: 4.4%
U.S. hourly wages Jan: 0.3%
Hourly wages YoY: 3.6%
10:00 AM
Consumer sentiment prelim Feb: 55.0
12:00 PM
Fed Vice Chair Philip Jefferson speaks
3:00 PM
Consumer credit Dec: $8.0B
⚠️ For informational purposes only. Not financial advice.
📌 #SPY #SPX #JobsReport #NFP #AMZN #AI #Cloud #Macro #Markets #Stocks #Options

SPY Distribution Schematic Sub 650 by EOMSPY Sub 650 by Late Feb.
SPY Sub 600 by End of March.
AMEX:SPY CBOE:UVXY

BITCOIN targets updated The chart is that of my work in Bitcoin I still see this as the ending of the first ABC decline .we are now into the second cluster of support . I still see a 5th wave ENDING Now beginning . I am watch IGV I have a low in 79 Handle they are all connected . I started buying CALLS in spy as of this post and will in IGV best of trades WAVETIMER
