XLM/USD Bullish Market Pathway | Structured Trade Plan📈 XLM/USD — STELLAR LUMENS vs U.S. DOLLAR
🚀 Bullish Breakout Setup (Day / Swing Trade)
Setup Summary:
Bullish bias confirmed with 200 Simple Moving Average breakout + price structure support (momentum aligned with EMAs). Entry viable at any pullback near support zones for flexible risk entry.
🎯 Trade Plan
Entry:
💥 Open at favorable price levels during pullbacks while trend holds.
(Use demand zones + lower time-frame support for precision)
Targets:
✨ Primary: $0.25400
➡️ Price approaching this target aligns with broader XLM forecast ranges seen in current market predictions.
Profit scale in steps: 0.2360 → 0.2460 → 0.2540 for risk management.
Stop Loss (SL):
🔒 $0.22000 — defined weekly support based.
Manage SL dynamically as structure invalidates.
Risk Alert:
⚠️ YOU choose your SL/TP level — trade with personal risk tolerance.
🔁 Related Pairs to Watch (Correlation Plays)
BTC/USD Market leader — crypto risk appetite driven by Bitcoin movement influences XLM.
ETH/USD Broad altcoin sentiment follows ETH strength or weakness.
XRP/USD Payments/bridge asset sentiment may correlate with cross-border utility demand.
Correlation Insight:
When BTC & ETH strengthen, capital often rotates into mid-caps like XLM.
Divergence (BTC down but alt up) often signals specific altcoin setups.
📊 Key Technical Notes
✅ Simple MA breakout indicates bullish momentum continuation.
📉 RSI/MACD cycles trending into confirmation zones — watch for MACD cross & rising histogram.
Volume increase near support = strong buy interest.
🌍 Fundamental + Macroeconomic Factors (Live to London Time)
Macro Drivers Affecting Crypto Now:
🧠 U.S. job data & Fed outlook:
Recent U.S. payroll figures below expectations are influencing rate speculation and liquidity — easing bias can fuel risk assets like XLM.
📊 ETF flows & institutional demand:
Spot Bitcoin ETFs seeing renewed inflows — indicative of institutional risk appetite returning into crypto ecosystem.
🏛️ Central bank moves:
Talks of stablecoin protections and expanding crypto legitimacy in UK and U.S. regulatory landscape have macro implications for digital assets.
📈 Crypto market breadth:
BTC ~ $96k and broader market mixed strength suggests rotation between assets — XLM can benefit from altcoin pull focus.
📅 Upcoming Event Watchlist (London Time)
🔸 U.S. Federal Reserve comments – policy stance → High impact (affects risk sentiment)
🔸 U.S. CPI / PPI releases → Can shift liquidity & crypto flows
🔸 Bitcoin & crypto ETF flow reports → Big cue for directional shifts
(Times subject to official release schedule)
📌 Trade Psychology + Tips
💡 Scale out profits instead of single TP for volatility markets.
📉 Use structure breaks for SL adjustments.
📈 Liquidity sweep levels often trigger continuation plays in crypto.
😎 Final Vibe — Stay Sharp, Trade Smart!
Technical edge + macro awareness = elevated probability setups.
Remember, no trade is perfect — adapt as price reacts.
📌 Keep charts open — trends don’t wait!
STELLAR

Buyers are waiting to re-enter XLM (8H)After creating a series of bearish moves, the market maker aggressively pushed the price upward in a sharp impulse move. During this strong rally, it is important to note that price not only formed a Bullish Change of Character (CHoCH), but also reclaimed key levels, confirming a shift in market structure from bearish to bullish.
Early buyers who entered alongside the market maker at lower prices have already secured their first round of profits, which has led to the current price correction / pullback. This retracement appears to be a natural and healthy reaction after a strong impulsive move, rather than a sign of weakness.
Traders who have already taken profits, along with new buyers, are now waiting for lower and more discounted prices to re-enter the market. Once sufficient buying interest returns at these levels and accumulation is completed, XLM has the potential to initiate another bullish move to the upside.
Trade Setup & Risk Management
To properly manage risk and plan a structured entry, a clear trading setup has been prepared around major support levels. These support zones are areas where we expect buyers to step back in.
We have two planned entry points, and positions should be entered using a DCA (Dollar Cost Averaging) strategy to improve average entry price and reduce risk in case of short-term volatility.
Targets & Invalidation
All targets are clearly marked on the chart.
At Target 1, it is recommended to secure partial profits.
After reaching the first target, move the stop loss to Break Even to protect capital.
If the stop loss is hit, this setup will be invalidated, and the bullish scenario should be reconsidered.
Final Notes
As long as price holds above the key support zones and the bullish structure remains valid, the overall bias stays bullish. Always trade with proper risk management and discipline.
⚠️ This analysis is for educational purposes only and not financial advice.
If you would like us to analyze a coin or altcoin for you, first like this post, then comment the name of your altcoin below.

Lumens Back up to a Quarter each in 2020inflation mechanism is gone, and the bottom barrel supply distribution is complete
nowhere to go but UP when everyone is either a FOMO buyer in the money, or a bagholder along for the reunion tour

STELLAR - Ready for TakeoffStellar has positioned itself on the top of a prior resistance line
A very bullish signal, as it signifies that price no longer respects that line as resistance and newer highs can be found
XLM moves closely with XRP
Daily chart

TradeCityPro | XLM Trapped in Range, Awaiting Breakout Trigger👋 Welcome to TradeCity Pro!
In this analysis, I want to review XLM, one of the DeFi and RWA coins, which with a market cap of $7.72 billion is ranked 15th on CoinMarketCap.
⏳ 4-hour timeframe
On the 4-hour timeframe, this coin has formed a large range box, and for several weeks it has been moving inside this range.
✔️ The bottom of this box is at 0.22826, and the top of the box is at 0.25960, and currently the price is moving in the middle of this box.
📊 A smaller range box has also formed inside the main box, which is between the zones 0.23593 and 0.2467.
⛏ If either 0.23593 or 0.2467 breaks, we can open a short-term position with low risk. However, the main triggers are the break of the main box’s support and resistance.
⭐ So for a short position, the main trigger is 0.22826, and the early trigger is 0.23593.
⚖️ For a long position, breaking 0.2596 is the main trigger, and breaking 0.2467 is the early trigger.
📝 Final Thoughts
Stay calm, trade wisely, and let's capture the market's best opportunities!
This analysis reflects our opinions and is not financial advice.
Share your thoughts in the comments, and don’t forget to share this analysis with your friends! ❤️

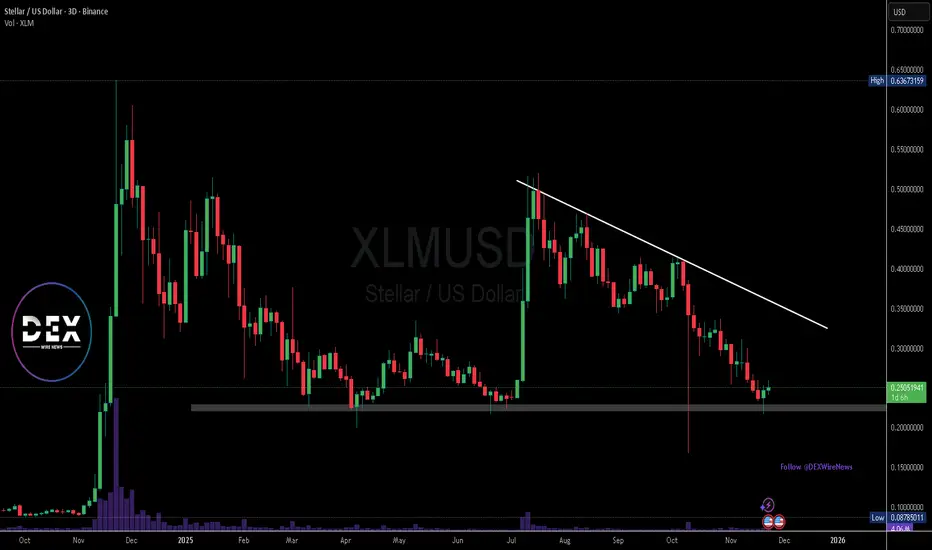
Stellar (XLM) Approaching a Decision Zone inside the Descending Stellar continues to move inside a broad descending channel, a structure that has been guiding price since the October high. The recent decline found support at the lower boundary of this channel, where buyers stepped in and created a short-term reaction. This zone now acts as an important decision point for the next directional move.
Price is currently retesting a mid-range support cluster that includes the fifty percent and sixty-one point eight percent retracement levels of the latest impulse. This confluence zone often acts as a turning area when paired with a corrective decline inside a channel. If the market holds this level and pushes above the minor trendline resistance, the structure allows room for a broader recovery toward the upper boundary of the channel.
A confirmed breakout from the channel, followed by a successful retest, would open the path toward the mid-term resistance near zero point three one. This level aligns with previous supply and serves as the next major upside objective.
However, failure to hold the current support zone may send Stellar back toward the channel’s lower boundary around the zero point two one region. A breakdown below this area would signal continuation of the descending trend and postpone any meaningful recovery attempts.
Key Technical Notes:
Price remains within a well-defined descending channel on the four-hour timeframe.
Current structure is respecting a support cluster formed by Fibonacci retracements and previous demand.
Break and hold above the minor descending trendline would confirm bullish momentum.
First upside target sits at zero point two six, extended target near zero point three one.
Loss of the support zone exposes zero point two one and below.
Bias:
Neutral until the breakout is confirmed. Balanced risk on both sides with clear invalidation levels.

XLMUSD can drop another -50% before it bottoms.Stellar (XLMUSD) is in the middle of its Bear Cycle and currently consolidating within its 1W MA50 (blue trend-line) - 1W MA200 (orange trend-line) in anticipating of Phase 2 of the Cycle's structure.
As you can see, the dominant pattern since the January 2018 High has been a Triangle, with the recent Cycle Top making direct contact with the Lower Highs trend-line and the bottom with the Higher Lows trend-line.
There is a very high degree of symmetry among those Cycles. Fine example is the 1W RSI, which every time it hit 38.50, the price had always tested the 1W MA200 while on its Bear Cycle and always after breaking below the initial (dashed) Triangle, which is the first pattern post the Bull Cycle Top.
As far as the bottom is concerned, there is obviously the Higher Lows trend-line to consider but at the same time, the 0.786 Fibonacci retracement level can also assist as the previous two Cycle bottoms were priced just above it.
As a result we estimate that this Bear Cycle may bottom around 0.13000 before XLM turns into a long-term buy opportunity again.
---
** Please LIKE 👍, FOLLOW ✅, SHARE 🙌 and COMMENT ✍ if you enjoy this idea! Also share your ideas and charts in the comments section below! This is best way to keep it relevant, support us, keep the content here free and allow the idea to reach as many people as possible. **
---
💸💸💸💸💸💸
👇 👇 👇 👇 👇 👇

Wait! Is that a Stellar expansion coming?Stellar has been in denial, whether to expand or stay stagnant for years now, but this time around, Stellar has no way other excuses but to expand. WATCH OUT! 🚀
XLM – The bullish trend is stronger than ever! Updating targetsIn my previous XLM idea, I kept raising the invalidation level higher and higher, gradually bringing it closer to the current price. Eventually, that level was broken.
Many would have considered the plan officially invalidated at that point… but the overall bullish structure didn’t break at all. On the contrary, it only got stronger!
The fact that the price refused to go lower even after breaking the previous key level shows real strength and accumulation. This is exactly the kind of behavior we love to see in a healthy uptrend.
Therefore, I am raising my targets again:
🎯 Previous main target from the last idea: 0.27 (still very much in play)
🎯 New extended target: 0.3
❌New invalidation level (cancellation zone): 0.2505
As long as we stay above this zone, the bullish scenario remains fully intact and I expect continued upside.
The trend is alive and stronger than before. Let’s go, XLM! 🚀
(Chart is updated with new levels)

XLM About to Wake Up? Bullish Targets Ahead!Stellar (XLM) is starting to look very interesting again after a clean consolidation phase. The chart is showing signs of strength and I expect a bullish continuation in the coming days.
🎯My upside targets:
1. $0.255
2. $0.265
3. $0.275 (main target)
❌Invalidation level:
A close below $0.241 would cancel this bullish scenario.
⚠️ Disclaimer: This is not financial advice. This is purely my personal view and technical analysis. Always do your own research and manage your risk and never trade without stoplosses . Trading involves substantial risk of loss.
If you like the idea — hit the LIKE button 🚀
Follow me for more crypto ideas!
Drop in the comments which coin I should analyse next! 👇

Stellar ( $XLM) Eyes Rebound as Protocol 25 Unlocks ZK PowerStellar (XLM) sits near $0.248 after a sharp monthly pullback that pushed the token back into a major demand zone between $0.22–$0.20. This region has triggered three powerful rallies in the past—32%, 53%, and 138%—making it a critical psychological and technical level. With X-Ray now entering the spotlight under Protocol 25, traders are watching closely to see whether renewed fundamentals can fuel another upside reaction.
Protocol 25: X-Ray Brings Zero-Knowledge to Stellar
Protocol 25 is one of Stellar’s most significant upgrades. It introduces X-Ray, a cryptographic toolkit designed to bring configurable privacy through zero-knowledge proofs while maintaining Stellar’s transparency model. Developers can now build privacy-enhanced applications without breaking compliance or altering the chain’s trust assumptions.
The upgrade introduces two key foundations:
BN254 Curve Support
Before Protocol 25, developers faced friction building ZK applications on Stellar. With bn254 precompiles—g1_add, g1_mul, and multi_pairing_check—Stellar now aligns with Ethereum-level ZK tooling and eliminates costly workarounds.
Poseidon & Poseidon2 Hashing
These ZK-optimized hashes enable faster proof generation, smoother off-chain integration, and better circuit performance. Anyone building Merkle trees, commitments, or complex ZK circuits now gains efficient primitives.
Stellar’s timeline is clear:
• Testnet vote: Jan 7, 2026
• Mainnet vote: Jan 22, 2026
Technical Outlook: XLM Must Defend $0.22
XLM broke a long-term descending trendline earlier this year before rejecting at $0.3 and sliding back into the $0.22 zone. This level is a historical launchpad:
Hold $0.22 → Move toward $0.31
Lose $0.22 → Drop toward $0.168
History says this region can ignite explosive reversals—if bulls defend it once again.
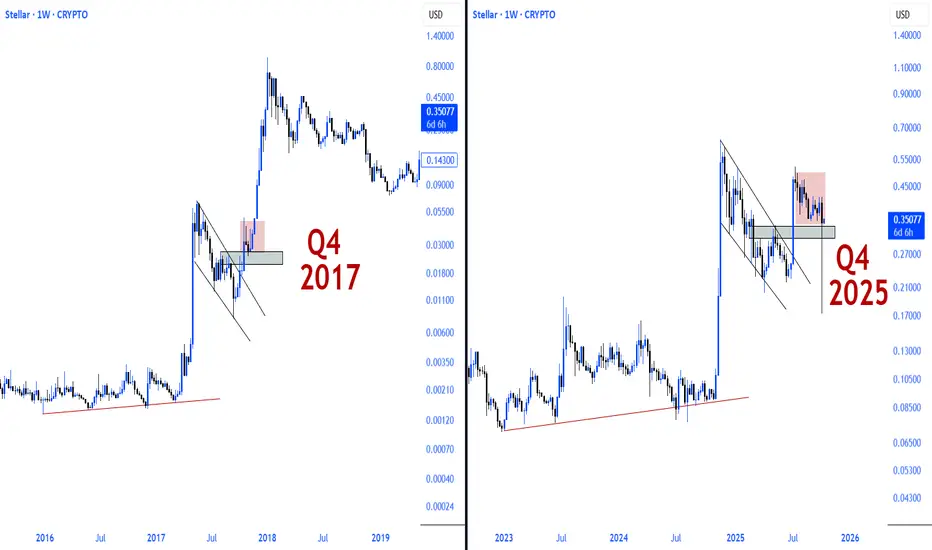
$XLM History Rhymes Again. Stellar once again mirrors its 2017 Wyckoff structure, deep accumulation, silent re-accumulation… and then the eruption.
Structure is set, momentum is brewing, only one phase left.
Parabolic Expansion.
Share if you like it 🤝

XLM/USDT Momentum Watch – Breakout Could Happen Today!🌟 XLM/USDT: The Stellar Heist Blueprint | Kijun Breakout Play 💰
📊 Market Intelligence Report
Asset Under Surveillance: XLM/USDT (Stellar vs Tether)
Operation Type: Swing/Day Trade Hybrid Strategy
Market Sentiment: Bullish Pending Execution 🎯
🎭 The Setup (No Hollywood Fiction, Just Charts)
We're watching STELLAR like hawks eyeing their next meal. The technical setup is cleaner than a freshly pressed suit, and here's why:
🔍 The Technical Breakdown
The Signal: Kijun-sen (Base Line) moving average breakout incoming
Current Status: Asset coiling up, ready to make moves
💎 Entry Strategy - The "Gentleman's Approach"
Entry Zone: Any price level after confirmed breakout above $0.4100
⚠️ Wait for the breakout confirmation - patience pays, FOMO doesn't!
🛡️ Risk Management (AKA: The Exit Plan)
Stop Loss: $0.3800 ⛔
⚖️ Risk Disclaimer:
Listen up, sophisticated traders - I'm sharing MY stop loss level for educational purposes. This isn't financial advice carved in stone. YOU control your own risk tolerance. Adjust your SL based on your capital management strategy and risk appetite. This is YOUR money, YOUR rules, YOUR responsibility.
🎯 Profit Targets (The Escape Route)
Primary Target: $0.4600 🚀
Maximum Resistance Zone: $0.4700 🚧
📍 Why $0.4600?
$0.4700 acts as a fortress-level resistance
Historical price rejection zone (aka the trap door)
Overbought conditions likely at this level
RSI divergence probability increases
Smart Exit Strategy:
Scale out between $0.4600-$0.4700. Don't get greedy - the market rewards discipline, not hope.
⚖️ Profit Disclaimer:
These are MY take-profit levels based on technical analysis. You're the captain of your ship. Take profits when YOUR strategy says so. Secure gains at YOUR comfort level. Risk management > Perfect entries.
🔗 Correlated Pairs to Monitor
Keep these on your radar for confirmation signals:
XRP/USDT 💵 - Brother from another blockchain, similar payment protocol narrative
ADA/USDT 💵 - Altcoin correlation, risk-on sentiment gauge
BTC/USDT 💵 - The godfather, drives overall crypto market sentiment
ETH/USDT 💵 - Smart contract leader, altcoin cycle indicator
📊 Correlation Logic:
When XRP pumps, XLM usually follows (payment token brotherhood). BTC/ETH movements dictate overall market appetite. If BTC dumps, all bets are off - protect capital first!
🔑 Key Technical Points
✅ Kijun-sen breakout = momentum shift confirmation
✅ $0.4100 level = Previous resistance turning support
✅ Volume spike = Smart money accumulation phase
✅ Risk/Reward ratio = Approximately 1:2.6 (sweet spot!)
✅ Market structure = Higher lows forming (bullish bias)
⚠️ The Fine Print (Read This!)
🎩 Trading Style Disclaimer:
This analysis represents a "high-risk, high-reward" trading approach presented in an entertaining format. This is NOT financial advice. This is technical analysis shared for educational and entertainment purposes only.
🎲 Your Responsibility:
Do your own research (DYOR)
Never trade with money you can't afford to lose
Past performance ≠ future results
Markets are unpredictable - manage your risk accordingly
This is a speculative strategy - trade at your own risk
💼 Professional Reminder:
I'm sharing my analysis, not managing your portfolio. You are 100% responsible for your trading decisions, wins, and losses. When in doubt, consult a licensed financial advisor.
✨ If you find value in my analysis, a 👍 and 🚀 boost is much appreciated — it helps me share more setups with the community!
#XLM #XLMUSDT #Stellar #CryptoTrading #TechnicalAnalysis #SwingTrading #DayTrading #Altcoins #CryptoSignals #TradingStrategy #KijunBreakout #IchimokuCloud #CryptoTA #RiskManagement #TradingIdeas #USDT #PaymentTokens #CryptoMarket #TradingCommunity

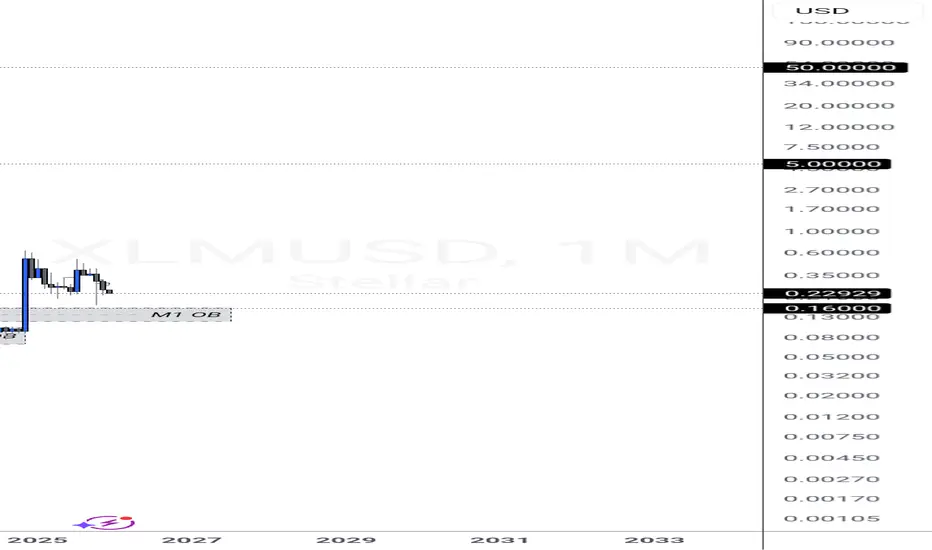
$XLM Fractal $8.00Looking at fractal from the 2017 Era we can see there is a chance the parabolic movement at the end of the pattern will occur again. 1×10^-27

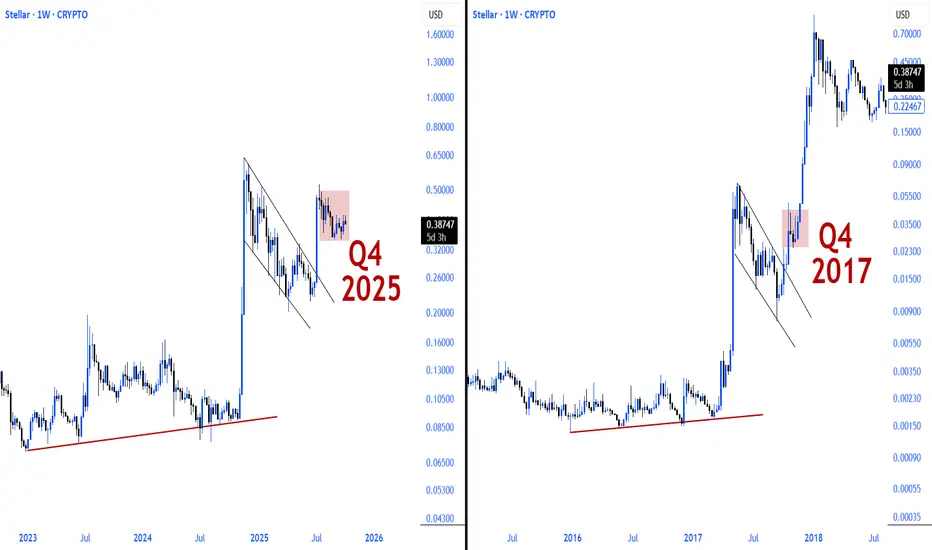
The 2017 and 2025 $XLM structures are strikingly similar.The 2017 and 2025 CRYPTOCAP:XLM structures are strikingly similar.
In 2017, a breakout occurred following a prolonged descending wedge formation, which then began a parabolic run after a brief accumulation phase above the demand zone.
The 2025 structure also forms a similar technical foundation.
Technical reflections of historical cycles.
Same structure, different cycle. However, market psychology and price behavior are shaped similarly.
While times may change, the recurrence of technical patterns is the clearest indicator of cyclical nature.
Dynamics that worked in the past are returning to the scene in the new cycle.
XLM is once again recapturing its historical rhythm.
XLM is the inseparable shadow of XRP.
If XRP runs, XLM will surely follow.
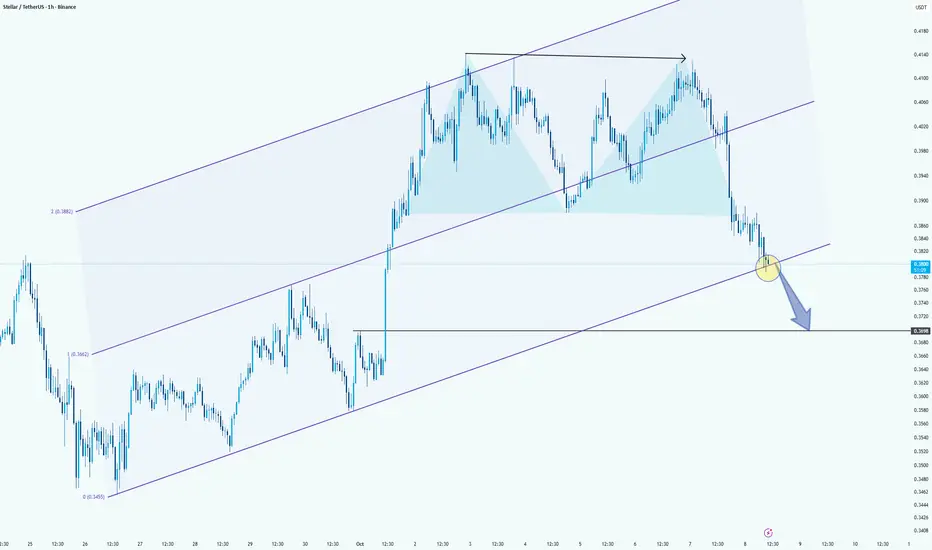
XLM/USDT Technical AnalysisHello guys!
It looks like a clear double top has formed on the chart, signaling potential bearish pressure. The neckline of this pattern has already been broken to the downside, confirming the reversal structure and adding weight to a potential move lower.
Currently, the price is sitting right on the lower boundary of the ascending channel. This is a key decision area, as long as the channel support holds, there’s still a chance for a short-term bounce. However, if this bottom trendline gives way, it would likely trigger a continuation of the bearish momentum that started after the double top confirmation.
If the breakdown happens, the next logical target sits around 0.3698 , which aligns with previous structure support. A sustained move below that level could open the door for further downside, possibly toward the 0.3450–0.3500 zone.
In short:
✅ Double top confirmed → neckline broken
⚠️ Price testing channel support
🔻 Break below = potential short setup toward 0.3698 and lower
$XLM \ Stellar running itThe 2017 and 2025 structures on XLM weekly chart are strikingly similar.
In both periods, a breakout occurred after a prolonged descending wedge formation.
The breakout in 2017 was followed by an aggressive rally. The 2025 structure is forming a similar technical foundation.
Technical reflections of historical cycles.
XLMUSD getting ready for an explosive break-out.Stellar (XLMUSD) has been trading within a Descending Triangle since the July 18 High and currently is ranging within its Support level and the 1D MA50 (blue trend-line).
A similar Ascending Triangle back in May - June, rallied aggressively to its 2.0 Fibonacci extension (the July 18 High) after breaking above both its Lower Highs trend-line and the 1D MA50. Even the 1D RSI sequences among the two fractals are similar.
As a result, if the price breaks above the 1D MA50 - Lower Highs trend-line, we will turn bullish, targeting 0.78000 (Fib 2.0 ext).
-------------------------------------------------------------------------------
** Please LIKE 👍, FOLLOW ✅, SHARE 🙌 and COMMENT ✍ if you enjoy this idea! Also share your ideas and charts in the comments section below! This is best way to keep it relevant, support us, keep the content here free and allow the idea to reach as many people as possible. **
-------------------------------------------------------------------------------
💸💸💸💸💸💸
👇 👇 👇 👇 👇 👇

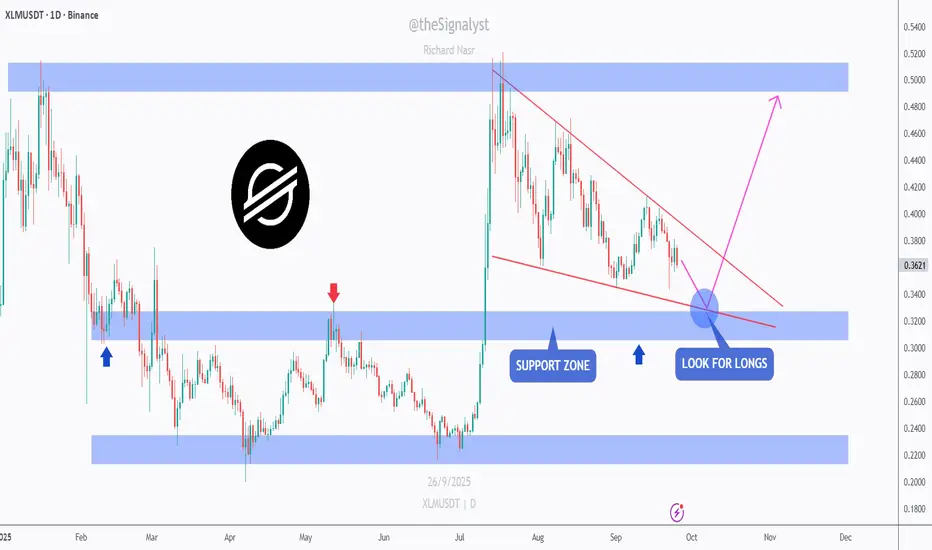
XLM - Waiting for the Wedge × Support RetestXLM is drifting inside a falling wedge and approaching the 0.34–0.32 blue support. I’m waiting for a retest of the intersection between the wedge’s lower trendline and this support to look for longs.
If buyers defend that confluence, I’ll look for a move toward 0.39–0.41, then 0.46–0.52 into the upper supply. A daily close below 0.32 invalidates and puts 0.24–0.23 back in play.
What’s your plan => bid the retest at the intersection, or wait for a clean wedge break first? 🤔
⚠️ Disclaimer: This is not financial advice. Always do your own research and manage risk properly.
📚 Stick to your trading plan regarding entries, risk, and management.
Good luck! 🍀
All Strategies Are Good; If Managed Properly!
~Richard Nasr
Stellar (XLM) Market Outlook — September 02, 2025Sergio Richi Premium ✅
#Stellar CRYPTOCAP:XLM — Market Outlook — September 02, 2025.
Current price : $0.3620
Charts:
Let’s be real: Stellar isn’t just another alt. It’s got actual utility — fast cross-border payments, cheap fees, and big-name partners (Visa, PayPal, MoneyGram, even Telegram wallets). That’s not meme-coin hype, that’s infrastructure.
Why It Matters
➖ Protocol 23 Upgrade (September 3, 2025): A major network enhancement focusing on scalability for tokenization and RWA use cases, including improved smart contract performance and data handling. This is expected to boost institutional adoption and could drive XLM toward $1.27-$2.39 if bullish momentum holds.
➖ Archax Partnership (August 18, 2025): Collaboration with institutional-grade exchange Archax to accelerate RWA tokenization, including fractional real estate and yield-bearing assets.
➖ PayPal PYUSD Integration (July–August 2025 Impact): PayPal's stablecoin on Stellar triggered a 5% price surge earlier, with ongoing effects into August. PayPal's Digital Currencies SVP joining SDF further strengthens ties.
➖ Telegram Wallet Integration: Enables seamless XLM transfers within chats, boosting mass adoption.
➖ ZARC Stablecoin Launch (Ongoing 2025): TD Markets' South African Rand-pegged asset on Stellar, ideal for remittances.
➖ Visa Stablecoin Settlement Support: Visa added Stellar for settlements with PYUSD, USDG, and EURC, enhancing global payment rails.
➖ UNDP Partnership and SDG Accelerator: Stellar joins for pilots in climate finance and social protection.
➖ RWA and DeFi Milestones: Q2 2025 saw $4 billion in RWA payments, with tokenized assets rising from $15.2B to $24B. DeFi TVL growth across protocols signals real-world utility.
The Trade
XLM is sitting at $0.36 after a choppy summer. In my book, it’s coiling for the next leg of the global bull run.
🎯 Targets:
➡️ Take Profit 1: $1.27 (+250%)
➡️ Take Profit 2: $2.39 (+560%)
Final Take
Stellar’s building the rails while half the market’s still arguing about ETFs. At these levels, risk/reward screams long.

XLM — Stellar Lumens: AI x RWA, Real Utility, Real Momentum⭐️ XLM — Stellar Lumens: AI x RWA, Real Utility, Real Momentum
Buy/Hold bias aiming for $0.75 🎯; reload zone ~ $0.25 🔁.
Thesis rests on tokenization (RWA) traction, US gov data on-chain, and 2025 scaling roadmap (5k TPS target, faster blocks) + AI tooling around Soroban. If thesis plays out, upside case ≈ +200% from reload—not financial advice.
________________________________________
🔥 Why now (meaningful catalysts)
• US Dept. of Commerce → GDP on Stellar
First time ever: the Commerce Department is putting official GDP data on-chain (hash) on Stellar, creating an immutable, public record—big signal for gov-grade data + DeFi oracles. (Stellar)
• RWA push: new partners & capital-market pipes
SDF’s 2025 goal: $3B RWA value & $110B volume; continuing integrations with Franklin Templeton, Paxos, Ondo, SG Forge. Recent Archax investment targets regulated tokenization rails. (CoinDesk, Stellar)
• Scaling roadmap → utility unlocks
Targeting ~5,000 TPS, 2.5s blocks, OpenZeppelin token standards, and 100× payout capacity (Merkle trees). These hit the exact pain points for enterprise/RWA and payments at scale. (Stellar)
________________________________________
🤖 The AI angle (pipeline + tools)
• Official roadmap AI
o Stella AI Assistant (enhanced) → a more capable agent interface for builders.
o Contract Copilot → AI-assisted smart-contract generation, linting & testing.
These live on SDF’s 2025 roadmap. (Stellar)
• Community AI on Soroban
o AI Agent Kit: lets AI agents interact with Stellar accounts & Soroban contracts.
o SoroBuilder: AI-driven in-browser Soroban contract builder/auditor.
o AI Transparency Token (AITT): compliance attestations on-chain. (Stellar Community Fund)
Net: AI lowers dev friction (faster dApp iteration) and expands use cases (agents, audits, compliance)—a pull for builders who need programmable money + verifiable data.
________________________________________
🧱 Building blocks already in place
• Smart contracts live (Soroban via Protocol 20) → programmable RWA/DeFi. (Oodles Blockchain)
• Freighter wallet upgrades + RPC/ETL improvements → smoother infra & analytics for apps. (Stellar)
• Stablecoin/RWA breadth (e.g., Franklin’s BENJI, Ondo USDY coming to Stellar) → liquidity primitives that institutions recognize. (Stellar)
________________________________________
📣 Recent social buzz (signal, not noise)
• SDF amplified the GDP-on-chain milestone across socials, triggering wider crypto media pickup.
See SDF’s X post and summary thread references. (X (formerly Twitter))
________________________________________
🧭 Levels & plan (author’s framework)
• Primary target: $0.75 🎯 if catalysts execute (RWA flow + scaling).
• Reload zone: $0.25 🔁 (where bulls re-accumulate in my playbook).
• Positioning: Buy/Hold bias for asymmetric upside tied to execution (RWA + AI-tooling + throughput).
• Risk: headline/regulatory risk on RWAs, roadmap slip, crypto beta. Size accordingly.
Note: A +200% outcome reflects upside math from reload zone to target; it’s not a guarantee. Do your own research.
________________________________________
🗓 What to watch next
• Roadmap drops through Q4-2025:
o 2.5s block times target,
o OpenZeppelin token standards for assets/RWAs,
o Freighter mobile & advanced auth,
o Payouts 100× capacity. (Stellar)
• RWA onboarding flow: progress with Archax, Paxos, Ondo, and Franklin—TVL/volume & issuer announcements. (CoinDesk, Stellar)
• Gov/enterprise data on-chain follow-ups after Commerce/GDP—possible spillover into on-chain data feeds for DeFi. (Stellar

XLM Breakout Watch | How Global Markets Are Setting the StageIn this update, I break down XLM’s mid-term outlook and why the $0.65 level is a key breakout zone to confirm further upside. Based on current patterns, I’m targeting a potential move into the $100–$138 range over the mid-term.
While Bitcoin still influences XLM, the backdrop of massive money printing since 2018 has created conditions for meaningful accumulation, setting the stage for higher prices. Add to that an environment of rising interest rates, Fed interventions, and volatility cycles, and it’s clear we’re only at the beginning of what could be a period of outsized returns.
Stellar’s role in a shifting economic system also can’t be ignored. As fiat currencies face structural limits, crypto offers a framework that breaks those shackles, with altcoins like XLM poised to outperform Bitcoin in the next cycle.
Markets will continue to follow their familiar pump-and-dump patterns, but each cycle brings diminishing returns for central bank interventions—leaving room for crypto markets to step in and restore balance.
Stay tuned for the charts and insights that put these patterns into perspective.

XLMUSD about to rise parabolically?Stellar (XLMUSD) has turned sideways since the July 14 High (weekly) but remains supported by its 1W MA50 (blue trend-line). The 8-year pattern is an Ascending Triangle and this recent consolidation resembles a Bull Flag formation.
The very same pattern was seen in October - November 2017, which after holding the 1W MA50, initiated the final parabolic rally of that Cycle that peaked a little above the 1.618 Fibonacci extension.
Attention is needed though as the last 1W Golden Cross was during the last Cycle and led to its Top a few weeks after.
As a result, the confirmation to resume the bullish trend would be a break above the top (Lower Highs trend-line) of the Ascending Triangle and in that case, our Target will be $2.15 (Fib 1.618 ext).
-------------------------------------------------------------------------------
** Please LIKE 👍, FOLLOW ✅, SHARE 🙌 and COMMENT ✍ if you enjoy this idea! Also share your ideas and charts in the comments section below! This is best way to keep it relevant, support us, keep the content here free and allow the idea to reach as many people as possible. **
-------------------------------------------------------------------------------
💸💸💸💸💸💸
👇 👇 👇 👇 👇 👇
