How to Trade with Stochastics in TradingViewMaster Stochastics using TradingView’s charting tools in this comprehensive tutorial from Optimus Futures.
The Stochastic Oscillator is a momentum indicator that helps traders identify potential turning points in the market by comparing the current closing price to the recent high–low range. It’s designed to show when momentum may be shifting from buyers to sellers — or vice versa.
What You’ll Learn:
- Understanding the Stochastic Oscillator as a momentum tool plotted from 0 to 100
- How the %K line represents the current close relative to the recent high–low range
- How the %D line acts as a moving average of %K and serves as a signal line
- Key thresholds: readings above 80 suggest overbought conditions, while below 20 suggest oversold conditions
- Why overbought and oversold levels are not automatic buy or sell signals — and how strong trends can keep Stochastics extended
- Identifying bullish and bearish crossovers between %K and %D
- Spotting bullish and bearish divergence between price and momentum
- Using Stochastics to confirm trend direction across different timeframes
- How to add Stochastics on TradingView via the Indicators menu
- Understanding the default settings (14, 3, 3) and how adjusting them affects responsiveness
- Practical examples on the E-mini S&P 500 futures chart
- Applying Stochastics across multiple timeframes — daily, weekly, or intraday — for confirmation signals
This tutorial will benefit futures traders, swing traders, and technical analysts who want to incorporate Stochastics into their trading process.
The concepts covered may help you identify momentum shifts, potential reversal zones, and trend confirmations across different markets and timeframes.
Learn more about futures trading with TradingView:
optimusfutures.com
Disclaimer
There is a substantial risk of loss in futures trading. Past performance is not indicative of future results. Please trade only with risk capital. We are not responsible for any third-party links, comments, or content shared on TradingView. Any opinions, links, or messages posted by users on TradingView do not represent our views or recommendations. Please exercise your own judgment and due diligence when engaging with any external content or user commentary.
This video represents the opinion of Optimus Futures and is intended for educational purposes only.
Chart interpretations are presented solely to illustrate objective technical concepts and should not be viewed as predictive of future market behavior. In our opinion, charts are analytical tools — not forecasting instruments.
Stochasticdivergence

BTCUSD - BEARISH DIVERGENCE DETECTEDCAPITALCOM:BTCUSD
BTCUSD has been in a bullish trend over the past few hours and is now approaching the resistance at 119,500.00.
On the hourly chart, a bearish hammer has formed alongside a stochastic divergence, signaling potential downside.
⚡ This signal is reinforced by a strong resistance level above, adding weight to a possible pullback scenario.
📉 If BTCUSD rebounds from this level, consider Sell setups with take profit at the nearest support.
📈 If it breaks out, look for Buy opportunities on confirmation.
⚡ We use Stoch (14) to spot potential reversals when it exits overbought or oversold zones — helping you catch clear, confident entries.

PHA USDTHere is a good and simple setup for PHA. Prioritize preserve your capital and avoid over expectation. It's been awhile since the last I posted. Many invalid calls in my profile. Crypto market moved unexpected to the downside and I was unable to anticipate. All market got liquidated. Cheers to those who still in the game.

The Hidden-Threat(s) To Gold-Trading During Friday!
So the economic-data seemed good today for the Gold-price. Initially, at commencement of NY session today (Thursday) the USDX came rallying off its 38.2% retracement. But it quickly quietened down & retreated even further and Gold was able to lift somewhat.
There are Heads 'N' Shoulders patterns that have formed on the USDX charts from 5m right up to 30m. See the charts & USDX on the left of screen. A rally to the neckline, a retrace and it could really move hard and fast during Friday.
What I also see is hidden divergence on the 15m and 240m Stochastic charts for Gold XAUUSD. This is probably not the main concern, it would be the USDX setting up for a rally very soon.
Lets see how it plays out.

Are you ready to make some money from the forex market? 🤑💌Our AI screener has detected a great opportunity for you: NZDCAD is in a ranging market for the next few days!
What does that mean? It means that the price is moving sideways between two levels: 0.8153 and 0.8333. That’s a range of 170 pips or more!
How can you profit from this situation?
📊There are two ways:
👨💻If you are a manual trader, you can use oscillators like RSI, Stoch, or MACD divergence to spot the best entry points for both long and short trades. You can use lower timeframes like M15 or M5 to find these signals.
🤖If you are a bot trader, you can use a martingale or zone strategy with proper risk control and money management. Trading with a bot will save you time and effort, as you don’t have to watch the charts all the time. You just need to check the bot trading every 4 hours to see if the market pattern changes from ranging to trending. If it does, you can close the bot and take your profits!
This is a simple and effective way to make money from the forex market. But act fast, this opportunity won’t last forever! 🔥
To get more trading ideas like this, follow our channel and subscribe to our newsletter. We will send you the best forex signals and tips every week. Don’t miss this chance to earn money online with us! 😊
Disclaimer: Trading forex is risky and you should only trade with money you can afford to lose. We are not responsible for any losses you may incur from following our signals. Always do your own research and analysis before placing any trades.

Mastering Oscillators In TradingOscillator indicators are technical analysis tools that show the rate at which a particular asset's price or other aspect is changing. Oscillators help traders identify potential trend reversals, trend continuations, and overbought or oversold conditions. These are general strategies that can apply to most oscillators. We would like to cover these in detail so you can ensure that you are using your oscillators to the fullest of their potential.
There are literally thousands of oscillators to choose from on TradingView. All of them probably have a solid use case, but there are a handful of oscillators that have stood the test of time. Those titans of the oscillator category would include the Moving Average Convergence Divergence (MACD), Relative Strength Index (RSI), and Stochastic Oscillator.
1. Trading with Oscillators: Identifying Entry and Exit Points
To use oscillators for trading, traders can look for signals to enter or exit trades. For example, a bullish signal could occur when the indicator crosses above its centerline, indicating that the trend is shifting from bearish to bullish. A bearish signal could occur when the indicator crosses below its centerline, indicating that the trend is shifting from bullish to bearish. Depending on if you are currently in a trade or considering a trade these bullish/bearish signals can be used as either an entry or exit signal.
Traders can also use the momentum of oscillator indicators to identify overbought or oversold conditions. An asset is considered overbought when the oscillator is above a certain threshold, such as 70. Conversely, an asset is considered oversold when an oscillator is below a certain threshold, such as 30. Traders can use these thresholds to identify potential reversal points. Highly overbought can be power areas to look for entry or exit signals.
2. Oscillator Divergences: Confirming Trend Reversals and Continuations
One of the most popular ways oscillators are used is by looking for divergences between the indicator and the price of the asset being analyzed.
For example, a bullish divergence could occur when the price of an asset is making lower lows, but the oscillator is making higher lows. This could be an indication that the trend is about to reverse from bearish to bullish.
Conversely, a bearish divergence could occur when the price of an asset is making higher highs, Oscillator is making lower highs. This could be an indication that the trend is about to reverse from bullish to bearish.
3. Using Oscillators in Combination with Other Technical Indicators
While oscillators can be an incredibly powerful tool on their own, traders can also use them in combination with other technical indicators. For example, traders can use moving averages to confirm oscillator signals. If the oscillator generates a bullish signal and the price of the asset is above its 50-day moving average, it could be a strong indication that the trend is shifting from bearish to bullish.
We see a similar use case in a bearish scenario to follow a trend!
Traders can also use momentum in combination with other oscillators, such as the relative strength index (RSI) or the Stochastic RSI. These indicators provide additional confirmation of momentum signals and can help traders avoid false signals. This is actually one of our favorites as the Stochastic RSI is a measure of the momentum of the RSI. So their respective signals can complement very well.
Putting It All Together
Traders can put this knowledge forward to use most oscillators correctly to adjust their trading strategies and adapt to changing market conditions. We also recommend looking at information the creator of an oscillator has put out in regard to how to properly use the indicator.
Traders can use these strategies to help modify or change their positions. For example, if the chosen oscillator used for an asset is weakening, it could be an indication that the trend is about to reverse. Traders can adjust their strategies accordingly by taking profit from their long positions or entering short positions.
Similarly, if the chosen oscillator for an asset is strengthening, it could be an indication that the trend is about to continue. Traders can adjust their strategies accordingly by adding to their long and short positions or entering new long or short positions.
In conclusion, oscillators are an extremely powerful technical analysis tool that can help traders identify potential trend reversals, trend continuations, and overbought or oversold conditions. By using oscillators in combination with other technical indicators and adjusting their trading strategies to adapt to changing market conditions, traders can improve their trading performance and achieve greater success in the markets.

Long Idea As we can see here HST has been moving in a huge symmetrical triangle as we can see here the stock consolidates for about 2 weeks and a half once touching down at support before breaking out to the upside to once again touch the resistance.
Things to NOTE:
1. Bullish Divergence on the RSI
2. Inverse H & S @HERE
3.Bullish PIN BAR on the WEEKLY time frame
These are very strong indicators that HST may see a move up on the upcoming weeks. Play it as you will, I'd love to hear your input on this or exchange ideas on other possible stock moves. Happy trading fellas :" }

GOLD MTF Wave stochastic example for trend reverseSometimes you don't need to count all of the Elliott Waves and pinpointing where the last Impulse started is enough to located the proper Time frame to look for that wave ending on the MTF. in this case the 1 month chart was the relative Time frame for the last impulse upwards (see where I wrote MTF stoch wave start) and you can see that from the Stoch being oversold on all time frames. then notice how the green (HTF) starts curving down at the end with a tap from blue and gray as a potential local top to exit at.. this is often all you need to trade a simple wave without too much complication. Please do not hesitate to ask any questions

ADA example of MTF Wave Stochastic reversal patternExplaining what the MTF Wave Stoch is all about, does not get any easier with this #Cardano chart $ADA / USDT pair. Feel free to ask if you don't understand!

$QQQ New Uptrend to watch$QQQ new uptrend formed
Stochastic divergence from recent low of
9.29.22, suggesting low may be a Swing pivot pt.
in Fibonacci .50-.618 objective zone.

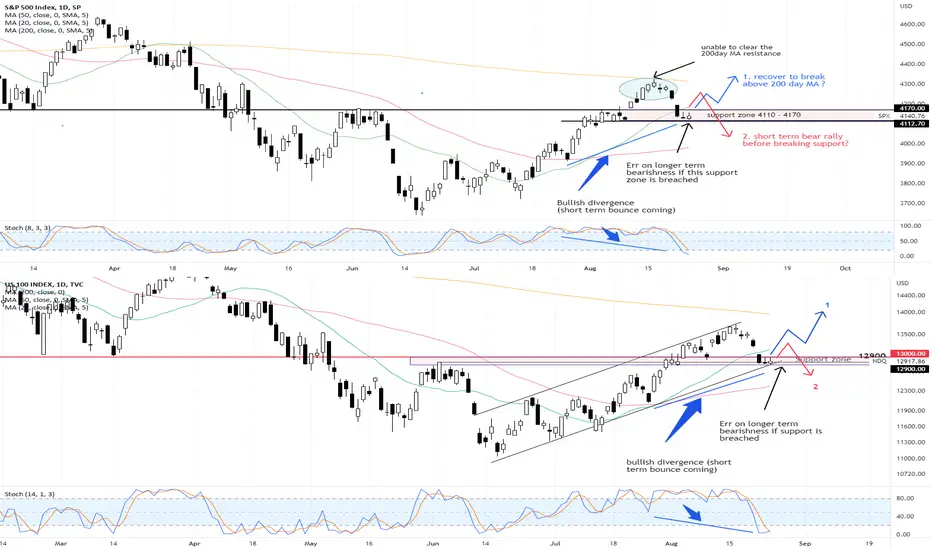
SPX and NQ - short term bounce nextBoth indices appear to be finding support at their respective near term support zones and with bullish divergence seen (between price and stochastics), a bounce is likely to happen soon.
Whether the worst is over or whether this next rebound is going to be a short-lived bear rally remains to be seen. Not time to turn longer term bearish yet despite the extremely volatility this period (not to mention all the calls out there screaming for market to crash). Just my opinion!
If we start to have a lower high (and especially followed by a lower low), then I would certainly stay very cautious.
Disclaimer: Just my 2 cents and not a trade advice. Kindly do your own due diligence and trade according to your own risk tolerance and don't forget that money management is important! Take care and Good Luck!
BTCIDK guys, this move cant even hit the 26,500 level. The 1 to 1. The SRSI has already nuked below the TL support that has kept BTC in this high high , higher low momentum since the June lows.
If BTC can bounce here on H4 would likely hit a lower high. But the SRSI looks like a bearish Div at first glance.

200MA BULLISH BOUNCEInteresting test of 200MA from a weekly perspective that also confluences with a positive divergence over stochastic indicator, look for longs from a D1 perspective in order to target upper resistance level at 100.


USDJPY waiting for bullish confirmation to go longUSDJPY waiting for bullish confirmation to go long. Thanks for watching.

GBPUSD bullish retracement might be overGBPUSD bullish retracement might be over. Thanks for watching.

EURUSD some room left for the bullish retracementEURUSD some room left for the bullish retracement. Thanks for watching

Bitcoin Weekly MACD will cross bullish ?Bitcoin Weekly MACD will cross bullish ? Thanks for watching.

ETHEREUM price above Kumo (daily),will tenak kijun follow?ETHEREUM price above Kumo (daily),will tenak kijun follow? Thanks for watching

Gap Leading to Channel BreakWith the MACD and Stoch flashing signals of bullish divergence and a gap that has not been filled, it seems likely that MCHP is getting ready to test its channel upper bound. To reach the channel upper bound it must clear another previously two unfilled gaps, the 21EMA and 63EMA.
We are also seeing a cross in the 21Mom, Stoch crossing over sold and the MACD preparing to cross its over sold.
If todays close is above yesterdays we will also see the candle pattern Three White Soliders. Though this pattern tends to warn that the majority of the bullish move is over and waiting for a throwback might be wise.

Is INTC getting ready to break its channel?As with most stocks, INTC has been in a bearish trend beginning this year. Recently it has entered into a neat downward channel. Following the last test of the channel upper bound (denoted by the blue flag), a substantial decline occurred. This decline ended with a volume spike against the lower bound.
The last test of the lower bound (denoted by the green flag) is strikingly different than the previous. It lacked a volume spike and did not push the Stoch or MACD to new lows. In fact, during the latest retracement up, both indicators flashed signals of a bullish divergence.
It seems likely that this retracement following the latest lower bound will take us at least to the upper bound, if not break the channel.

Bitcoin Future PredictionBINANCE:BTCUSD
Three Bearish Divergence will lead BTC to under 10K
2022 will be the bear market
2023 can see a uptrend
2024 pullback
2025 will be the Bull Run where BTC will cross ATH
2026 200K - 300K
