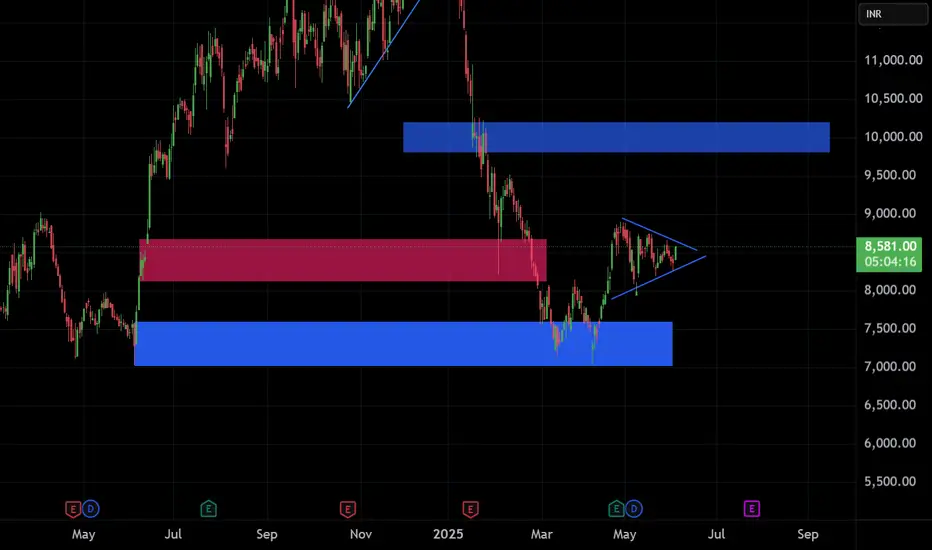
TCS - H1 - Triangle Breakout (19.10.2025)📊 Setup Overview:
TCS is showing a Triangle Breakout formation on the H1 chart. Price has been consolidating within converging trendlines, and a cloud crossover hints at a possible momentum shift. This setup could lead to a directional breakout opportunity for short-term traders.
📈 Trade Plan:
Bias: Bearish below the breakout zone
Sell Entry Zone: Below 2950 (after candle close confirmation)
1st Target: 2877 ✅
2nd Target: 2814 🎯
Resistance Zone: 3010 – 3030
🧩 Technical Confluence:
1.Price rejected from upper trendline multiple times
2.Ichimoku Cloud crossover signals short-term weakness
3.Lower highs formation confirms loss of bullish momentum
4.Volume profile shows high interest near 2900, indicating potential liquidity zone
#TCS #NSE #StockMarketIndia #TechnicalAnalysis #TriangleBreakout #Ichimoku #PriceAction #SwingTrading #StocksToWatch #IndianStocks #Nifty50 #TradingView #ChartsDontLie #Kabhi_Ta_Trading #BearishSetup
💡 Fundamental View:
TCS, India’s leading IT services giant, remains fundamentally strong with consistent revenue from global clients and robust digital transformation projects.
However, recent IT sector consolidation and global tech budget tightening could create short-term selling pressure. The stock’s medium-term outlook remains positive, but near-term corrections may occur before a fresh rally.
⚠️ Disclaimer:
This analysis is for educational and informational purposes only and should not be considered as financial advice. Always use proper risk management and confirm setups with your own analysis before trading or investing.
💬 Support the Analysis:
If this chart helped you — LIKE 👍, COMMENT 💬 your views, and FOLLOW ✅ for daily market insights, chart patterns, and trade setups!
Stocktowatch

What's the fate of MSTR? MSTR is showing a sign for a long opportunity. However, there hasn't been a confirmation yet.
The stock is in oversold region and price has respected both bullish trendline and support level. Once there's a breakout of the bearish trendline and green bar is formed on the awesome oscillator, then you can take a long position. This is a confirmation that the stock is ready to create a new higher price.

Birla Corporation looking North ward after weekly BOBirla Corp. Ltd. engages in the provision of manufacture of cement. It operates through the following segments: Cement, Jute, and Others.
Birla Corp. Ltd. Closing price is 1280.10. The positive aspects of the company are Companies with Zero Promoter Pledge, Companies with reducing Debt, Strong cash generating ability from core business - Improving Cash Flow from operation and FII / FPI or Institutions increasing their shareholding . The Negative aspects of the company are high Valuation (P.E. = 25.8), MFs decreased their shareholding last quarter.
Entry can be taken after closing above 1283 Historical Resistance in the stock will be 1350 and 1438. PEAK Historic Resistance in the stock will be 1532 and 1660. Stop loss in the stock should be maintained at Closing below 1170 or 900 depending upon your risk taking ability.
Disclaimer: The above information is provided for educational purpose, analysis and paper trading only. Please don't treat this as a buy or sell recommendation for the stock or index. The Techno-Funda analysis is based on data that is more than 3 months old. Supports and Resistances are determined by historic past peaks and Valley in the chart. Many other indicators and patterns like EMA, RSI, MACD, Volumes, Fibonacci, parallel channel etc. use historic data which is 3 months or older cyclical points. There is no guarantee they will work in future as markets are highly volatile and swings in prices are also due to macro and micro factors based on actions taken by the company as well as region and global events. Equity investment is subject to risks. I or my clients or family members might have positions in the stocks that we mention in our educational posts. We will not be responsible for any Profit or loss that may occur due to any financial decision taken based on any data provided in this message. Do consult your investment advisor before taking any financial decisions. Stop losses should be an important part of any investment in equity.

Intel in Trouble or Ready for Redemption?There is growing potential for QUALCOMM Incorporated to acquire Intel.
I now believe that this development has advanced enough to warrant a fresh look at the stock
Qualcomm recently approached Intel about a takeover. According to WSJ , Qualcomm has expressed interest in acquiring Intel, which, if realized, would mark one of the most significant deals in recent history
Initially, this seemed like a long shot, with limited details emerging from the report. However, QCOM has continued to pursue the idea. Also QCOM has been in contact with Chinese antitrust regulators over the past month about this potential deal and is waiting until after the US presidential election to decide on making a formal offer. Since the election is just less than a month away, I believe this acquisition is becoming more of a possibility that investors should factor into their assessment of INTC. If a deal goes through, it’s likely that the acquisition will come at a premium to the current stock price, creating an opportunity for significant short term gains for investors
There is always a chance that no deal will occur. In that case, potential investors should evaluate whether the stock is worth holding as a long-term investment. My outlook here is not optimistic, and I’ll delve into INTC's competitive position, as indicated by its latest inventory data, in the next section
Given these two potential scenarios, I am upgrading my rating from "Sell" to "Hold." In summary, the possibility of QCOM acquiring INTC introduces a major upside catalyst that I hadn’t accounted for in my previous analysis. This potential acquisition helps offset some of the concerns about INTC as a standalone company.
Unlike many financial metrics that can be interpreted in different ways, inventory levels are more straightforward. He also explained that inventory trends can provide early indicators of business cycles. For cyclical industries, rising inventories can signal overproduction as demand wanes, while shrinking inventories can indicate strong demand
As shown in INTC’s most recent balance sheet, its inventory levels have generally been on the rise. For instance, in December 2014, inventory was valued at $ 4.273 billion, while the most recent figures show an increase to $ 11.244 billion. In some cases, rising inventory can signal business growth with increasing demand and production capacity, which was true for Intel in the early part of the last decade.
When inventory growth exceeds the pace of business growth, it becomes a red flag. In this scenario, rising inventory suggests weakened competitiveness and declining market position—an issue that Intel currently faces, in my opinion. The following chart helps illustrate this point, showing a comparison of days of inventory outstanding (DIO) for Intel and NVIDIA over the last five years, from 2020 to 2024. DIO is a measure of how many days it takes a company to sell its inventory
Given Intel's inventory buildup and declining competitive edge, I find its current valuation multiples hard to justify. Specifically, the chart highlights a comparison of price-to-earnings (P/E) ratios between Intel, NVIDIA, and AMD. Focusing on non-GAAP earnings estimates for fiscal years FY1 through FY3, Intel is currently trading with the highest P/E ratio for FY1 at 87.7 almost twice the multiple of NVIDIA and AMD, which are at 46.29 and 46.25, respectively
That said, the outlook changes somewhat when considering the years further ahead. For instance, in FY2, NVIDIA’s expected P/E ratio rises to the highest at 32.77, compared to Intel's 20.02 and AMD's 29.02. However, I want to emphasize the substantial uncertainty in Intel's earnings forecasts. As shown in the next chart, the consensus estimates for Intel's earnings per share (EPS) in FY 2024 range from a low of $0.15 to a high of $0.31 (a more than twofold variation) and from a low of $0.65 to a high of $2.1 (an almost fourfold variation). Given such uncertainty, I believe investors should be cautious about relying too heavily on forward P/E ratios too far into the future.
Both Intel and NVIDIA have experienced significant fluctuations in DIO over the years. Notably, both companies saw a spike in 2023 due to the COVID pandemic, which disrupted global supply chains. As the disruption faded, both firms saw a recovery (ie, a reduction in DIO). the difference in recovery is striking. Intel's DIO peaked at over 150 days in 2023 and has since decreased to 125 days a modest reduction but still above its historical average of 114 days. In contrast, NVIDIA's DIO surged to over 200 days but has rapidly dropped to 76 days, which is not only below its four-year average of 97.9 days but also near its lowest level in four years.
I expect Intel to face increasing competitive pressure as rivals like NVIDIA and AMD roll out their next-generation chips, particularly NVIDIA’s Blackwell chips. I recommend potential investors keep a close eye on inventory data, as it can signal changes in competitive dynamics for the reasons discussed here.
In addition to inventory issues and valuation risks, Intel faces a few other specific challenges. A significant portion of Intel’s current product lineup is concentrated in certain segments, such as PCs, which I believe are nearing market saturation plus a large share of Intel’s revenue comes from China. Given the ongoing trade tensions between the US and China, this heavy reliance on China poses a considerable geopolitical risk. These factors may limit Intel’s ability to adapt to technological advancements and shifting geopolitical conditions
The potential for a QUALCOMM acquisition has emerged as a new major upside catalyst. While my outlook on Intel’s business remains pessimistic based on the latest inventory data, the acquisition possibility partially offsets these negatives, leading me to upgrade my rating from Sell to Hold or if you are risk taker like Me, load the dip

NSLTECH LONG IDEANSLTECH stock presents a long opportunity based on the market structure, support level and trendline. To take advantage of this long opportunity, there are different approaches. An aggressive approach is to buy at the current market price since price is in the discount level. Then, add more long positions when price gets to the support level around N0.60 and N0.57. While a conservative approach is to wait for price to get to the support level and give a candlestick confirmation before entering a long position. The stop can be at N0.45 (23.73%) while the final target is N1.33 (125.42%).
Confluences for the long idea:
1. Bullish market structure
2. Trendline
3. Support level
4. Discount level.
Disclaimer: This is not a financial advice. The outcome maybe different from the projection. Don't take the signal if you're not willing to accept the risk.

GUINEAINS LONG IDEA GUINEAINS stock presents a long opportunity based on trendline and support level. To take advantage of this opportunity, there's a need to wait for price to drop to the support level around N75 and N73. An aggressive approach is to enter a long position at that price while a conservative approach is to wait for a candlestick confirmation such as bullish engulfing or hammer. The last high around N1.23 (68.49%) can be the target while the stop can be around N0.57 (21.92%).
Confluences for the long idea:
1. Bullish trendline
2. Support level
3. Bullish market structure.
Disclaimer: this is not a financial advice. The outcome maybe different from the projection. Don't take the signal if you're not willing to accept the risk.

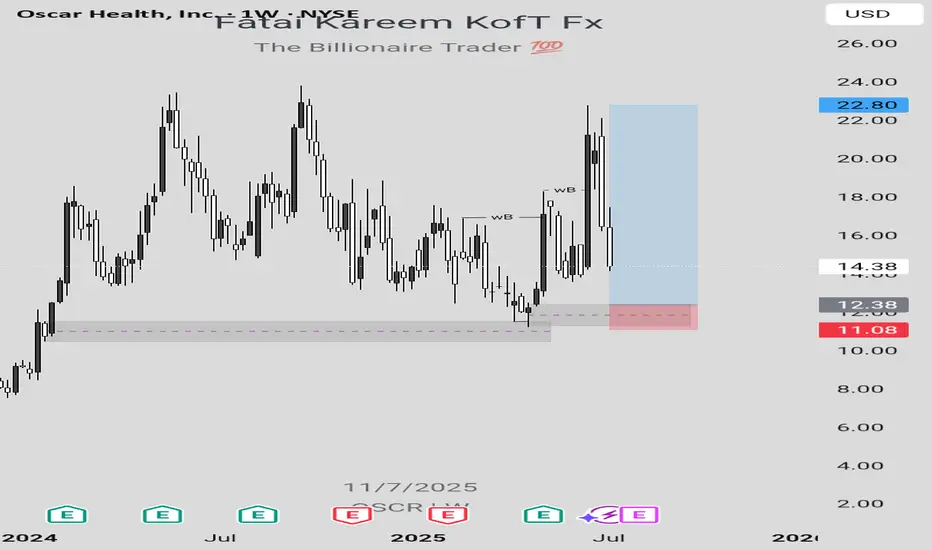
OSCR LONG IDEALooking at the weekly chart of OSCR stock, there's a long opportunity which can be taken advantage of to make some money provided that market follows the projection.
In order to take advantage of this long opportunity, a buy order limit can be placed at $12.38 while the exit can be at $11.09 and the final target can be at $22.80.
Confluences for this long idea are as follows:
1. Weekly break of structure
2. Valid Inducement (structural liquidity)
3. Orderflow
4. Sweep
5. Valid demand zone in the discount level
6. Imbalance
7. Pattern confirmation formed after mitigation of a demand zone indicating that there's a bullish change of trend.
Disclaimer: This is not a financial advice. The outcome maybe different from the projection. Don't take the signal if you're not willing to accept the risk.
WHAT'S THE FATE OF INTEL CORPORATION STOCK?From the perspective of technical analysis, INTC is approaching a key psychological level at $19. In addition, it's in a downtrend. If the key level should hold by pushing price higher, leading to a break out of the downtrend line and closing with a strong bullish candle above the down trend line and resistance level around $22, this will indicate a strong bullish signal. Likewise, this is supported by a bullish divergence signal from the awesome oscillator. Otherwise, a failure of the psychological level of $19 may lead to price dropping further.
Furthermore, we need to look beyond technical analysis. Fundamental analysis also has some insights for our decisions.
Fundamentals for INTC established a bearish bias. The summary is as follows:
Financial Health:
• Negative EPS (-$4.47): Intel is losing money.
• High Debt ($50B): This can limit growth and increase risk.
• Declining Revenue: Sales dropped from $80B (2021) to $51B (2024).
Valuation:
• Cheap P/S (1.66x), but no P/E (due to negative earnings).
• Dividend yield (2.56%) is at risk of being cut.
Sentiment:
Stock price fell from $56 to $19.55 (65% drop). Institutional investors may be wary.
Fundamentally, INTC is weak — best suited for speculative, long-term bets (if you believe in a turnaround).
Strategy for Traders:
1. Conservative Approach:
- Wait for:
- Break out of downtrend line and resistance around $22 and positive earnings/news.
- Rising volume to confirm momentum.
- Target: $27–$30
- Stop-loss: Below $17 (apply proper risk management).
2. Aggressive Approach:
- Buy near $18–$19 with tight stop-loss ($16).
- Target resistance level at $22.
3. Avoid If:
- You’re risk-averse or prefer stable companies.
- Intel’s debt/revenue trends worsen.
Note:
- Short-Term Trade: Only if breakout confirms ($22+). High risk, but possible 20% bounce.
- Long-Term Investment: Avoid unless Intel shows profit/debt improvement.
Always use stop-losses —Intel’s fundamentals make it volatile.
Disclaimer: This is not a financial advice. The outcome maybe different from the projection. Don't take the signal if you can't accept the risk.

WHAT'S THE FAITH OF INTEL CORPORATION STOCK? From the perspective of technical analysis, INTC is approaching a key psychological level at $19. In addition, it's in a downtrend. If the key level should hold by pushing price higher, leading to a break out of the downtrend line and closing with a strong bullish candle above the down trend line and resistance level around $22, this will indicate a strong bullish signal. Likewise, this is supported by a bullish divergence signal from the awesome oscillator. Otherwise, a failure of the psychological level of $19 may lead to price dropping further.
Furthermore, we need to look beyond technical analysis. Fundamental analysis also has some insights for our decisions.
Fundamentals for INTC established a bearish bias. The summary is as follows:
Financial Health :
• Negative EPS (-$4.47): Intel is losing money.
• High Debt ($50B): This can limit growth and increase risk.
• Declining Revenue: Sales dropped from $80B (2021) to $51B (2024).
Valuation:
• Cheap P/S (1.66x), but no P/E (due to negative earnings).
• Dividend yield (2.56%) is at risk of being cut.
Sentiment:
Stock price fell from $56 to $19.55 (65% drop). Institutional investors may be wary.
Fundamentally, INTC is weak — best suited for speculative, long-term bets (if you believe in a turnaround).
Strategy for Traders:
1. Conservative Approach:
- Wait for:
- Break out of downtrend line and resistance around $22 and positive earnings/news.
- Rising volume to confirm momentum.
- Target: $27–$30
- Stop-loss: Below $17 (apply proper risk management).
2. Aggressive Approach:
- Buy near $18–$19 with tight stop-loss ($16).
- Target resistance level at $22.
3. Avoid If:
- You’re risk-averse or prefer stable companies.
- Intel’s debt/revenue trends worsen.
Note:
- Short-Term Trade: Only if breakout confirms ($22+). High risk, but possible 20% bounce.
- Long-Term Investment: Avoid unless Intel shows profit/debt improvement.
Always use stop-losses —Intel’s fundamentals make it volatile.
Disclaimer: This is not a financial advice. The outcome maybe different from the projection. Don't take the signal if you can't accept the risk.

WATCH OUT FOR VERITASKAPFrom around 0.83, VERITASKAP created an all-time high of around 1.81. This happened between August 2024 and September 2024. Then, price dropped into the discount level where is currently. The current price action shows that price is in a discount level, at a demand zone and within a falling wedge.
From a chart pattern perspective, falling wedge can be seen on the chart and a break out of the downtrend and resistance level around 1.06 with a bullish candle closing above these levels will serve as a strong indication that the stock is ready to rally up as much as the all-time high.
From a technical indicator perspective, awesome oscillator is below 0, showing that the stock is oversold. In addition, there is a bullish indication on the awesome oscillator as shown by its colour and upward movement. This is pointing to the fact that the value of the awesome oscillator is moving towards 0 and can cross over it which can be a good indication for a rise in price as well.
From a smart money concept perspective, a break of the last high (around 1.27) that led to the last bearish internal break of structure will as serve as indication of a bullish trend. Hence, the target will the all-time high.
Either way, the stock has a good potential. An aggressive trader or investor may buy at the current market price. While a conservative trader or investor may wait for a breakout.
Watch out for the confluences indicating potential rise in price so as to not miss out on the benefit.

Reversal Trade - Godfrey PhilipGodfrey Philip
This stock is forming good Weekly Tighter Close. Let's wait & check out how it behaves this week.
17 Feb Week Rejection is alarming.
No follow through to that rejection in last week. This week is defending last weekly low so far.
Highly Risky Trade, Rs.600, I am targeting 10% i.e. 24 Feb 25 Weekly High.
This is not a Buy Reco, Do your own Diligence. This is purely for educational purpose.

The Fizz is Back: Coca-Cola's Stock on the Rebound● The price had encountered several resistance points around the $62 mark in the past.
● Once it broke through this barrier, the stock surged to reach a record high of $72.5.
● However, it then faced a significant pullback, dropping approximately 16% before finding support at the breakout area.
● Recently, the price has begun to climb once more, setting its sights on the previous all-time high, with expectations of surpassing it.

NVIDIA's Momentum A Breakout Story in Progress1. Trend and Structure
The chart showcases an upward momentum, breaking out of a prior resistance level, indicating bullish pressure. The breakout aligns with the upward-sloping trendline, which serves as a strong support structure.
2.Breakout Confirmation
The price has successfully broken through a resistance level, confirming a bullish breakout. This signals potential continuation toward the marked target zone.
3.Entry Point
The entry appears to have been taken near the breakout point, at approximately $141.60, aligning with the bullish momentum.
4. Target (Take Profit)
The take-profit level is marked at $152.94, representing a reasonable upward move from the breakout point. This target aligns with the continuation of the trend.
5. Stop Loss
The stop-loss level is placed at $133.46, below the recent support and trendline. This level ensures protection in case the breakout fails.
6.Risk-Reward Ratio
The setup demonstrates a healthy risk-to-reward ratio, with potential gains outweighing the risks. This indicates a well-calculated trade.
7. Technical Indicators
The momentum of the candles breaking the resistance shows strong bullish interest. No immediate signs of bearish divergence or reversal are visible in the chart.
The chart reflects a bullish breakout setup in NVIDIA's stock price. With strong momentum and a clear trendline breakout, the trade aligns well with the current upward movement. The target and stop-loss levels are well-placed, adhering to a disciplined trading strategy.

Linde plc | LIN Linde, Timeless Excellence
Linde is a timeless business with even better stability than other basic materials businesses. The company works in gases and has a near-unbroken EPS growth record of 8% annually
Linde is a market leader, and if you invest in the company, you're investing in the world's largest company for industrial gases. The company was originally a result of a takeover of British BOC in 2006, and again the 2018 merger of Linde and Praxair, a US company.
On the macro upside, there was a 1) supportive regulatory framework in the USA and in the EU on green opportunities and hydrogen, 2) the Ukraine invasion was also a key catalyst towards the energy transition, 3) the EU chip acts with €43 billion in supporting funds as well as the United States Chips and Science Act development for a value of approximately $52 billion, and 4) higher needs of specialty gas in EV car. Related to the micro upside, the company is more diversified on a GEO revenue basis and sells different product solutions starting from cylinders to bulk liquid. In addition with a follow-up note titled "Positive News Ahead", we reported Linde's lower cost structure with the Frankfort delisting. Aside from removing the dual listing expenses, we positively view this development because US companies' P/E multiple are usually higher compared to the EU one.
To support our MACRO buy case recap, in the second quarter, Linde announced two new projects with Evonik and Heidelberg Materials (both companies covered by our internal team). The company signed a long-term agreement to produce green hydrogen for Evonik in a 9-megawatt alkaline electrolyzer plant in Singapore. With Heidelberg, Linde will build a large-scale carbon capture close to the Lengfurt plant in Germany. As a reminder, cement production is estimated to be responsible for around 7% of global
in 2022, APD's earnings per share were at $8.38, and Linde's earnings per share were fairly similar at $8.23. For 2023, Air Products and Chemical EPS guide a midpoint at $11.40 while Linde's EPS is forecasted at $13.65. Looking at the ROCE, in Q4 2022, APD stood at 11.7% and Linde at 13.4%. In the last quarter, APD’s ROCE was flat on the two-year comparison, while Linde’s after-tax ROCE reached 24.0%.
While there are some business & regional nuances between the two leading companies (for instance, APD is lacking U.S. packaged gas business), here at the Lab, we believe are more inclined toward Linde, particularly when organic growth has been fairly similar. Cross-checking APD and Linde's last quarter results, we should recall that on a comparable basis, the German player volumes were flat with an average selling price up by 8%. On the other hand, APD increased its volume by 6% with an increase in the average selling price of 8% too. APD adj EBITDA grew by 13% while Linde achieved a plus 11%. However, Linde's EU exposure is greater than APD. Therefore, this is supportive of Linde's bottom line. In numbers, excluding the Engineering divisional performance, Linde's EMEA sales reached $2,177 million and represented 29.72% of the company's total sales. Compared to Q1 2022 number, turnover grew by 10% and was driven by a 13% of cost pass-through increase.

Asian Paints - don't waste time follow simple approach??NSE:ASIANPAINT
Too much talk about Asian Paints? Retail investors aren't all fundamental analysts and only sometimes have the time.
If you're screening and believe Asian Paints will withstand the competition, focus on that. Trust in the Indian growth story.
Note: I'm not buying or planning to – my focus is on growth. But for super long-term investors, this might be of interest.
Here's what I'm tracking – the 3-month candlestick chart from TradingView.
For heaven's sake, it's business – 3 months give us a fair timeline for price action to show some certainty.
Disc: No investment , no recommendation
#AsianPaints #Investing #TradingView #LongTermInvestment #pwinvest #trading

Kotak Mahindra looking positive again. Kotak Mahindra Bank Ltd. Engages in the provision of commercial banking services. It operates through the following segments: Treasury, Balance Sheet Management Unit (BMU) and Corporate Centre; Retail Banking; Corporate or Wholesale Banking; Vehicle Financing, Other Lending Activities; Broking; Advisory and Transactional Services; Asset Management; Insurance and Other Banking Business.
Kotak Mahindra Bank Ltd. CMP 1805.65 is The positive aspects of the company are Attractive Valuation (P.E. = 16.2), Company with Zero Promoter Pledge, RSI indicating price strength, Increasing Revenue every Quarter for the past 8 Quarters and Effectively using its capital to generate profit. The Negative aspects of the company are Stocks Underperforming their Industry Price Change in the Quarter, Increase in Provisions in Recent Results.
Entry can be taken after closing above 1806 Targets in the stock will be 1831, 1855 and 1883. The long-term target in the stock will be 1917 and 1947. Stop loss in the stock should be maintained at Closing below 1749 or 1682 depending on your risk taking ability.
Disclaimer: The above information is provided for educational purpose, analysis and paper trading only. Please don't treat this as a buy or sell recommendation for the stock. We do not guarantee any success in highly volatile market or otherwise. Stock market investment is subject to market risks which include global and regional risks. We will not be responsible for any Profit or loss that may occur due to any financial decision taken based on any data provided in this message.

SBI Life Insurance Co. Ltd (NSE: SBILIFE) - Technical Analysis Price Action and Fibonacci Analysis
SBI Life is currently trading at ₹1,628.85, which is near a crucial Fibonacci retracement level:
1. Fibonacci Levels:
The price previously peaked around ₹1,935.10, forming a possible double-top pattern.
It has since retraced, approaching the 50% retracement level at ₹1,624.75, a significant support zone. This level often acts as a key point for potential rebounds.
Below this, the 61.8% level at ₹1,551.50 is the next major support. If the price declines further, this level could provide strong support.
2. Volume Profile:
The Volume Profile on the right suggests a high volume node around ₹1,450, indicating strong accumulation in this zone. This level, if reached, could serve as a significant support area and potential bounce point.
3 . Moving Averages:
The stock is currently trading near the 200-day moving average (black line), which may act as a long-term support level.
The 50-day (blue) and 100-day (red) moving averages are above the current price, indicating that the stock has broken below its short- and medium-term trend lines.
Technical Indicators
1. Relative Strength Index (RSI):
The RSI is showing signs of being in the lower half of its range but hasn’t reached oversold territory, suggesting there may be further downside before a potential rebound.
2. Volume Trends:
There has been a significant increase in volume during the recent pullback, indicating strong selling pressure.
Conclusion and Potential Scenarios
Bullish Scenario: If the stock holds the 50% Fibonacci level at ₹1,624.75 and the 200-day moving average, we could see a recovery toward the 38.2% level at ₹1,698.00, with further resistance at ₹1,788.60.
Bearish Scenario: A break below ₹1,624.75 could lead the price toward the 61.8% level at ₹1,551.50. A further decline might see the price test the high-volume node around ₹1,450.
Trading Strategy
For Long Positions: Watch for a bounce near ₹1,624.75 or ₹1,551.50 with confirmation from volume and RSI improving from lower levels.
For Short Positions: A breakdown below ₹1,624.75, particularly with strong volume, could present a shorting opportunity down to ₹1,551.50 or potentially lower.
Note: Always consider market conditions and use proper risk management techniques.

HINDCOPPER : Riding the Liquidity Zone for a Strong Upswing1. Hindustan Copper Ltd. (HINDCOPPER)
Current Price: ₹283.45
Chart Observations:
The chart showcases a corrective wave labeled as A-B-C, where Wave (C) has approached a liquidity zone (₹252–₹268). This zone is supported by a deep retracement from the last swing low, aligning with Fibonacci 113%–127% levels, making it a potential demand zone.
A Break of Structure (BoS) at the earlier swing low indicates seller dominance; however, the liquidity zone offers a counter-trend opportunity.
A sharp upward projection anticipates price moving toward the target zone between ₹364 and ₹378.
Buying Levels:
First buying opportunity: ₹268–₹283 (inside the liquidity zone).
Secondary aggressive entry: On confirmation of a bullish breakout above ₹292.
Stop Loss:
Place the stop loss at ₹252 . Use a dynamic trailing stop-loss strategy by adjusting it above the next immediate swing low as the stock advances.
Target:
First Target: ₹364
Second Target: ₹378
Pro Tip to Avoid SL Hunting: Monitor for rejections (e.g., long wicks, higher lows) at ₹268 levels before entering. Wait for confirmation of demand in this zone on shorter time frames like 1-hour or 4-hour charts.
Disclaimer: This analysis is for educational purposes only . Investments in stocks and financial markets involve risks, including the loss of principal. Always conduct your own due diligence or consult with a certified financial advisor before making any investment decisions.

CROMPTON Daily timeframe analysis for long
NSE:CROMPTON taking bounce back from its 50% golden retrace zone.
Can add more till 380 with SL 360.
Major Targets Highlighted in Blue lines, sub targets in grey lines.

LICI Daily timeframe analysis for long
NSE:LICI has given strong breakout after bouncing from strong support zone.
Can add more till 925 only with SL 900.
Major Targets Highlighted in Blue lines, sub targets in grey lines.

ADVENZYMES: Catching the Wave of OpportunityADVENZYMES (Advanced Enzyme Tech Ltd.)
Key Levels:
Demand Zone: ₹333.85 - ₹384.90
Stop Loss: Below ₹333.85 (on daily closing basis)
Target Zone: ₹523 - ₹543 (Golden Retracement Zone of the correction swing)
Structure & Trend:
The stock is currently in an ABC correction wave with Wave C extended.
A strong demand zone is visible near ₹333.85 - ₹384.90.
Buyers are likely to step in at this zone, creating a potential reversal opportunity.
Trade Plan:
Entry: Around ₹366 - ₹385 within the demand zone.
Targets:
First target: ₹450 (midway to retracement)
Final target: ₹523 - ₹543
Stop Loss: ₹333.85 on a daily close basis.
Note: Sellers might use the ₹523-₹543 zone for profit booking.
General Guidelines:
Risk Management: Adhere to strict stop losses as per the plan.
Confirmation: Look for price action signals (bullish candles, volume spikes) near entry zones.
Patience: Allow the trades to develop towards targets gradually.
Educational Purpose only

HAL : Hindustan Aeronautics Ltd completing its correction#HAL (Hindustan Aeronautics Ltd) Daily Chart Analysis
🔍 Technical Overview:
1️⃣ The stock is forming an ABC corrective wave structure, nearing the Extended Correction Zone of Wave C around ₹3,697 - ₹3,405.
2️⃣ The 200 SMA (₹3,405) aligns with a strong support level, increasing the likelihood of a bounce.
3️⃣ Immediate resistance levels are at ₹4,209 and ₹4,509, with the target zone around ₹5,080 - ₹5,130 if bullish momentum continues.
🟢 Bullish Scenario:
Support Zone: ₹3,697 - ₹3,405.
A reversal here could trigger a rally toward ₹4,209, with an extended target of ₹5,130 - ₹5,165.
Confirmation: Look for bullish reversal patterns (e.g., hammer or bullish engulfing candle) supported by volume.
🎯 Long Plan:
Entry: ₹3,697 - ₹3,405 (upon bullish confirmation).
Targets:
TP1: ₹4,209.
TP2: ₹5,130 - ₹5,165.
Stop-Loss: Below ₹3,380.
🔴 Bearish Scenario:
If ₹3,405 fails to hold, the next downside targets are ₹3,000 and ₹2,600.
Breakdown Confirmation: A decisive break below ₹3,405 with increased selling pressure.
🎯 Short Plan:
Entry: Below ₹3,405.
Targets:
TP1: ₹3,000.
TP2: ₹2,600.
Stop-Loss: Above ₹3,500.
📈 Key Levels to Watch:
Support: ₹3,830, ₹3,697, ₹3,405.
Resistance: ₹4,209, ₹4,509, ₹5,130.
⚠️ Note: Monitor volume and price action carefully around the Extended Correction Zone. Any major defense sector updates or contracts could impact the stock’s movement.
#HindustanAeronautics #HAL #StockMarket #TradingView #ElliottWave #TechnicalAnalysis #SwingTrading #NSE #StockCharts #PriceAction #DefenseStocks #IndiaMarkets #StockTrading #MarketAnalysis
Comment below if you have questions or insights! 🚀
