#STRAXUSDT — Descending Triangle at Demand Zone!#STRAX
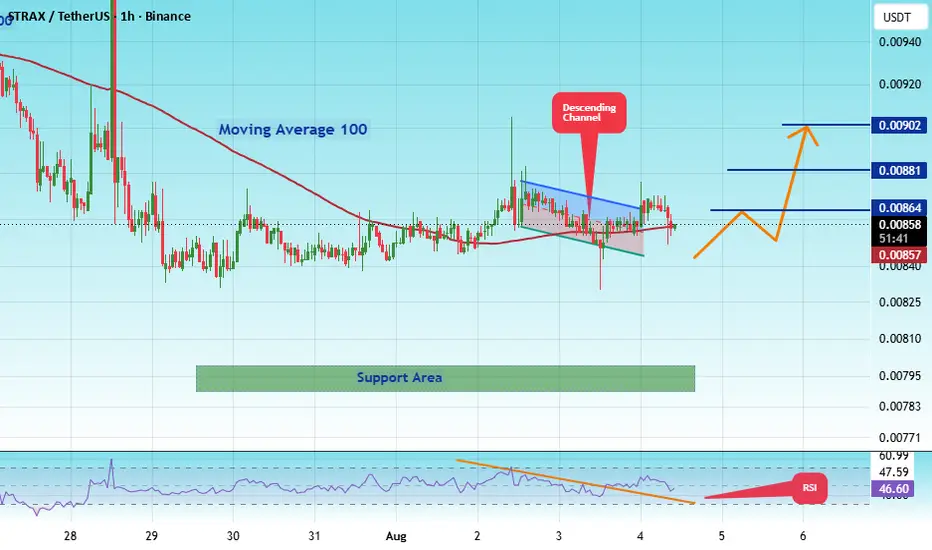
The price is moving within a descending channel on the 1-hour timeframe and has reached the lower boundary. It is now poised for a bounce and is expected to retest this boundary.
The Relative Strength Index (RSI) indicates a downward trend, which is likely to continue given the overbought conditions.
There is a key support zone in green at 0.00790. The price has bounced off this zone several times, making it a strong support level.
The price is trending towards the 100-period moving a
Straxlong
#STRAXUSDT — Descending Triangle at Demand Zone!#STRAX
The price is moving within a descending channel on the 1-hour timeframe and has reached the lower boundary. It is now poised for a bounce and is expected to retest this boundary.
The Relative Strength Index (RSI) indicates a downward trend, which is likely to continue due to overbought conditions.
A key support zone has been identified in green at 0.00785. The price has bounced off this zone several times, making it a strong support level.
The price is trending towards the 100-period
#STRAX/USDT — Descending Triangle at Demand Zone!#STRAX
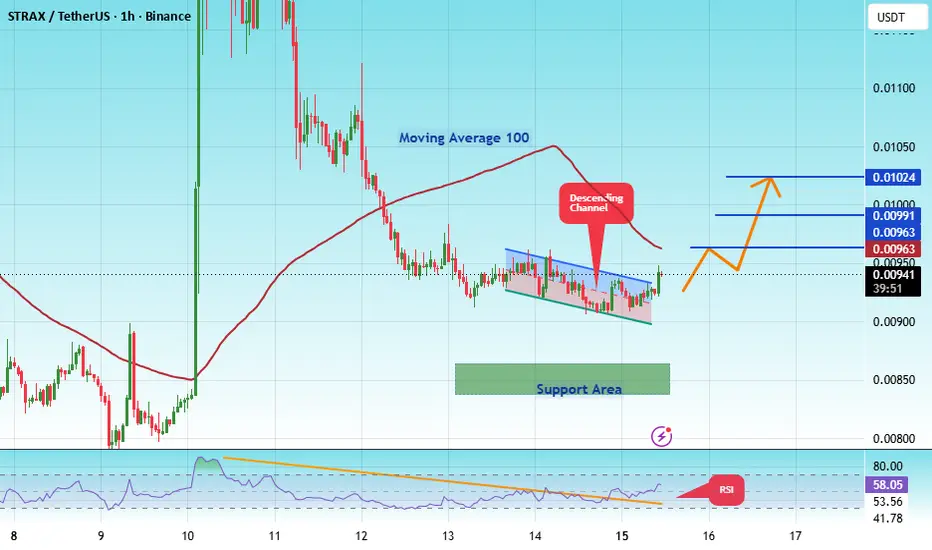
The price is moving within a descending channel on the 1-hour timeframe and has reached the lower boundary. It is now poised for a bounce and is expected to retest this boundary.
The Relative Strength Index (RSI) indicates a downward trend, which is likely to continue given the overbought conditions.
There is a key support zone in green at 0.00840. The price has bounced off this zone several times, making it a strong support level.
The price is trending towards the 100-period moving a
#STRAXUSDT — Descending Triangle at Demand Zone!#STRAX
The price is moving within a descending channel on the 1-hour timeframe and has reached the lower boundary. It is now poised for a bounce and is expected to retest this boundary.
The Relative Strength Index (RSI) indicates a downward trend, which is likely to continue given the overbought conditions.
There is a key support zone (in green) at 0.01150. The price has bounced off this zone several times, making it a strong support level.
The price is trending towards the 100-period moving
#STRAX/USDT — Descending Triangle at Demand Zone!#STRAX
The price is moving in a descending channel on the 1-hour timeframe. It has reached the lower boundary and is heading towards breaking above it, with a retest of the upper boundary expected.
We have a downtrend on the RSI indicator, which has reached near the lower boundary, and an upward rebound is expected.
There is a key support zone in green at 0.02060. The price has bounced from this zone multiple times and is expected to bounce again.
We have a trend towards consolidation above
STRAXUSDT Forming Descending WedgeSTRAXUSDT is showing strong technical potential as it forms a classic descending wedge pattern on the chart. This pattern is typically viewed as a bullish reversal signal, suggesting that the downtrend may be nearing exhaustion and a breakout to the upside is likely. With the price compressing within the wedge and volume remaining steady, STRAX appears to be coiling for a major move. The current market structure indicates a high-probability setup with an expected gain of 90% to 100%+ if a breako
#STRAX/USDT#STRAX
The price is moving within a descending channel on the 1-hour frame and is expected to break and continue upward.
We have a trend to stabilize above the 100 moving average once again.
We have a downtrend on the RSI indicator that supports the upward move with a breakout.
We have a support area at the lower limit of the channel at 0.04263, acting as strong support from which the price can rebound.
Entry price: 0.04262
First target: 0.04311
Second target: 0.04311
Third target: 0.04426
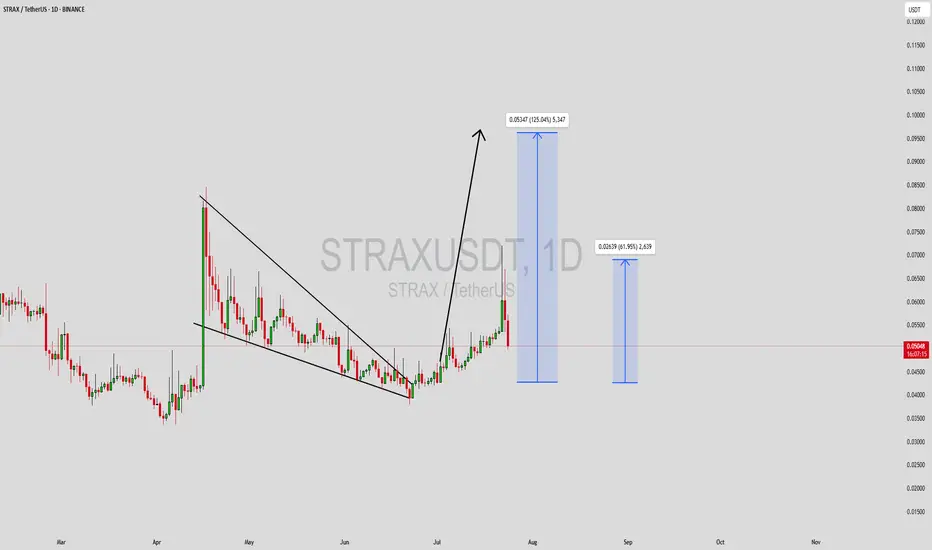
STRAXUSDT Forming Falling Wedge STRAXUSDT is displaying a textbook falling wedge pattern on the daily chart, a formation widely recognized for its bullish reversal potential. After an explosive move upward earlier this quarter, the price has been consolidating in a downward-sloping wedge, tightening near a crucial support level. This type of market structure typically precedes a breakout, and the chart currently projects a potential move of 90% to 100% or more to the upside. This setup is attracting growing interest from trade
#STRAX/USDT#STRAX
The price is moving within a descending channel pattern on the 4-hour frame, which is a retracement pattern
We have a bounce from a major support area in the color EUR at 0.0600
We have a tendency to stabilize above the Moving Average 100
We have an upward trend on the RSI indicator that supports the rise and gives greater momentum, upon which the price depends
Entry price is 0.0610
The first target is 0.0670
The second target is 0.0749
The third goal is 0.0832
#STRAX/USDT#STRAX
We have a bearish channel pattern on a 12-hour frame, the price moves within it and adheres to its limits well
We have a green support area at 0.0700 after the price touched it and bounced from it
We have a tendency to stabilize above moving average 100
We have an uptrend on the RSI indicator that supports the price higher
Entry price is 0.0800
The first target is 0.0886
The second goal is 0.0976
the third goal is 0.1068
#STRAX/USDT#STRAX
The price has been trading in a descending triangle since January 2022
And the descending triangle was broken strongly.
Powered by Moving Average fraction 100.
And overselling on MACD
We are now at the first goal 1.277.
Expects a correction to 1.06 before completing the growth.
For the second goal 1.645
#STRAX/USDT#STRAX
The price is moving in a downward channel on a 1-day frame
We have a trend of breaking moving average 100 to the upside
We have a major support area at the 0.800 level
We have a positive divergence on RSI
Entry area 0.917
The first goal is 0.974
The second goal is 1.087
Fourth goal 1.20
Stratis (STRAX) forming a bullish Gartley for the next pumpHi dear friends, hope you are well and welcome to the new trade setup of Stratis (STRAX) coin with US Dollar pair.
Recently we caught almost 190% pump of STRAX as below:
Now on a 4-hour time frame, STRAX has formed a bullish Gartley move for the next bullish reversal.
Note: Above idea is for educational purpose only. It is advised to diversify and strictly follow the stop loss, and don't get stuck with trade.
Stratis (STRAX) forming a bullish Gartley for upto 35.50% pumpHi dear friends, hope you are well and welcome to the new trade setup of Stratis ( STRAX ) coin with US Dollar pair.
Recently we caught a almost 72% pump of STRAX as below:
Now on a 2-hr time frame, STRAX is about to complete the final leg of a bullish Gartley move for another pump soon.
Note: Above idea is for educational purpose only. It is advised to diversify and strictly follow the stop loss, and don't get stuck with trade
Stratis (STRAX) formed a bullish Gartley for upto 12% pumpHi dear friends, hope you are well and welcome to the new trade setup of Stratis ( STRAX ) coin with US Dollar pair.
Previously we caught a nice pump of STRAX as below:
Now on a 2-hr time frame, STRAX has formed a bullish Gartley move.
Note: Above idea is for educational purpose only. It is advised to diversify and strictly follow the stop loss, and don't get stuck with trade
SLong
Stratis (STRAX) formed bullish Gartley for upto 22.5% pumpHi dear friends, hope you are well and welcome to the new trade setup of Stratis ( STRAX ) coin.
Previously I shared below long-term trade-setup for Strax , which is still in play.
Now on a 4-hr time frame, STRAX has formed a bullish Gartley pattern:
Note: Above idea is for educational purpose only. It is advised to diversify and strictly follow the stop loss, and don't get stuck with trade
Strax Usdt
If we evaluate the data obtained in the box measurement between the low area and the peak, the fact that the back test is from 0.382 suggests that this will draw a harmonic pattern.
I think the C leg will stay between the 0.618 and 0.786 I mentioned on the chart.
Because I considered level A to be excessive depolarization. If we consider the depolarization ratio as 1/2, I believe that the C leg cannot go higher than 0.786.
The SL area I marked with the red line looks clear. A breakdown of
Stratis (STRAX) formed bullish BAT for upto 15.5% moveHi dear friends, hope you are well and welcome to the new trade setup of Stratis ( STRAX ) coin with BTC pair.
On a 2-hr time frame, STRAX has formed bullish BAT pattern.
Note: Above idea is for educational purpose only. It is advised to diversify and strictly follow the stop loss, and don't get stuck with trade
SLong
STRAXUSDT Daily TimeframeSNIPER STRATEGY (new version)
It works ALMOST ON ANY CHART.
It produces Weak, Medium and Strong signals based on consisting elements.
NOT ALL TARGETS CAN BE ACHIEVED, let's make that clear.
TARGETS OR ENTRY PRICES ARE STRONG SUPPORT AND RESISTANCE LEVELS SO THEY CAN ACT LIKE PIVOT POINTS AND REVERSE THE WAVE (or act like a mirror that can reflects light) BASED ON STRENGTH OF THAT LEVEL.
ENTRY PRICE BLACK COLOR
MOST PROBABLE SCENARIOS TARGETS GREEN COLOR
LEAST PROBABLE SCENARIOS TARG
STRAXSTRAX on a clear breakout! look for these two price targets definitely gonna hit these. This is STRAT or stratis. They just changed their coins name today to STRAX. Still same coin and company though I do belive? Anyways. Broke the trend line I had drawn and closed above on the 15 and 30 min chart so be looking for it to head to 8$ within the day.