Gold 1D | Smart Money Liquidity & Price Action FrameworkGold 1D | Smart Money Liquidity & Price Action Framework
Gold (XAUUSD) on the 1D timeframe is currently moving through an important structural area where previous liquidity, imbalance and supply-demand reactions are interacting. The chart shows a complete sequence of bullish expansion, premium rejection, bearish displacement and a developing reaction from the discount region.
Initial Bullish Expansion
The earlier daily candles show a sustained bullish progression, with buyers repeatedly cre
Strojusdt
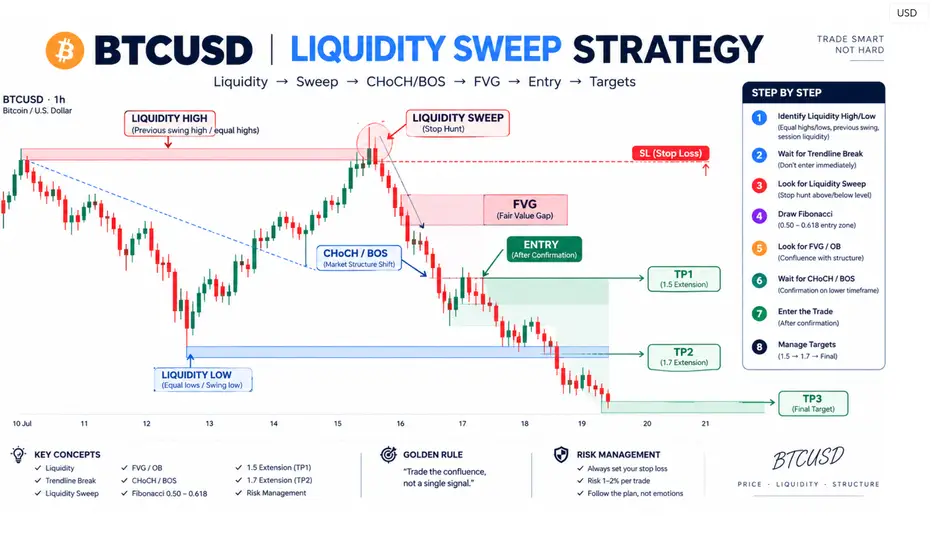
BTCUSD Liquidity & Fibonacci Expansion ModelBTCUSD Liquidity Sweep + Fibonacci SMC Strategy — Full Candle-by-Candle Explanation
This chart demonstrates how liquidity, candle behaviour, trendline structure, Fibonacci 0.50–0.618, CHoCH/BOS and FVG can be combined into one SMC execution model. The important point is that each candle gives information about the battle between buyers and sellers. One candle alone is not a trade signal; the sequence and location of candles create the setup.
1. Initial Bullish Candles — Building Buy-Side Press
GOLD Price Update – Clean & Clear ExplanationGold is showing a clear bearish reaction after failing to hold the 4,200–4,220 resistance zone. Price pushed higher, swept the upside liquidity near 4,220, and then faced strong selling pressure, creating a sharp rejection and downside move.
The market remains in bearish trend a strong dollar and rising oil prices weak fundamental backdrop and the fed hawkish stance are putting pressure on gold Weaker U.S. payroll data initially supported gold, but elevated yields, inflation concerns, and a le
GOLD - Formation of a new range in a bear market ICMARKETS:XAUUSD is forming a short squeeze of resistance following Friday’s NFP release and, in line with the previously published scenario, continues to decline from the identified triggers.
The market remains in a bearish trend. A strong dollar and rising oil prices, a weak fundamental backdrop, and the Fed’s hawkish stance are putting pressure on gold. However, following Friday’s report, the market is beginning to question the continuation of interest-rate hikes. The fundamental backdr
XAUUSD Bearish Market Structure Meets Sell-Side Liquidity.Gold continues to show a bearish market structure on the daily timeframe, with price forming lower highs and respecting the broader descending trendline. The recent rejection from the 4,700 buy-side liquidity zone has brought price back toward the 4,100–4,200 demand/support area, where buyers may attempt to defend the market.
The current structure suggests that price could first experience a corrective bullish retracement before the next potential bearish continuation. The highlighted 4,350–4,50
EURUSD Short: Faces Fresh Selling Pressure After the FakeoutHello traders! Here’s my technical outlook based on the current EURUSD (2H) chart structure. EURUSD previously traded inside a descending channel before breaking lower under the Trend Line. Price then tested the Supply Zone near 1.1290 with a fake breakout and was rejected.
Currently, EURUSD is trading below the 1.1290 Supply Zone while holding above the 1.1200 Demand Zone. The recent rejection and descending structure suggest a possible continuation lower toward demand.
As long as EURUSD rema
CLS Method 4/9 - Valid Candle in the Wrong Half Is Still a Pass.Hey what's up guys, part 3 gave you the candle. This is part 4 of 9. A valid candle in the wrong half of the range is still a pass.
The mistake is buying the nice continuation at the top, because it looks like strength. That print is usually where the stops get built. The trade, if there is one, is lower.
✂️ The Dealing Range
A dealing range is not every swing you can see. Price has to take a swing high and a swing low, then make a clear expansion. That expansion leg is the dealing range.
EURUSD EURUSD remains under short-term bearish pressure on the 1H timeframe, with price trading below the descending trendline and showing signs of rejection from the 1.1260–1.1280 resistance/supply zone. The recent structure continues to favor sellers, with lower highs forming after the previous downside break.
BEARISH SCENARIO — CONTINUATION
If EURUSD remains below 1.1260–1.1280 and sellers maintain control, another downside move could develop. A confirmed break below the recent 1.1220 support area
HYPEUSDT - The correction is over. Ready for the rally BINANCE:HYPEUSDT.P is consolidating near resistance formed within the trading range. The market is bullish, as is the altcoin’s trend, and I expect the rally to continue.
Bitcoin maintains its bullish structure and continues to consolidate with preconditions for further growth. A strong Bitcoin provides support to the entire altcoin market.
HYPEUSDT looks favorable for continuation of the main trend. The correction is over, and the focus is on the 91.800 trigger. A breakout of resistance c
XAUUSD Stays Under Pressure as 4,200 Continues to Reject BuyersHello traders! Here’s my technical outlook based on the current XAUUSD (1H) chart structure. XAUUSD previously started to decline under the Trend Line and formed a range near the Seller Zone. Price then tested the Resistance Level with a fake breakout and was rejected. Currently, XAUUSD is trading below the 4,200 Seller Zone while holding above the 4,060 Buyer Zone. The recent rejection and descending structure suggest a possible continuation lower toward support. As long as XAUUSD remains below
USDJPY is Nearing a Strong Support Line!Hey Traders, in tomorrow's trading session we are monitoring USDJPY for a buying opportunity around 157.000 zone, USDJPY is trading in an uptrend and currently is in a correction phase in which it is approaching the trend at 157.000 support and resistance area.
Trade safe, Joe.
XAUUSD 1D | SMC Market Structure Liquidity & Trendline EducationXAUUSD 1D — Professional Candle-by-Candle Education
This chart explains why each candle can create buying or selling pressure, using SMC concepts such as liquidity, market structure, BOS, CHoCH, FVG, Order Blocks and the descending trendline. A candle should never be judged alone; its location and the candles before it determine whether buyers or sellers have the advantage.
1. First Bullish Candle — BUY Reason
Buyers enter from the lower demand area. The candle closes stronger than it opens, s
Gold Consolidation Bearish Market Structure Downside PressureGold has also remained inside a broad trading range, but the latest rejection near the upper boundary followed by a move back below 4,150 keeps the short-term structure tilted to the downside.
Tecnically remains under pressure as U.S. dollar strength, elevated Treasury yields, and uncertainty over the Federal Reserve’s rate-cut path continue to weigh on the market. Persistent inflation concerns are also limiting bullish momentum, while repeated rejection from higher resistance levels is keeping
BTCUSDT: Holds the Channel Floor as 88,000$ Remains Within ReachHello everyone, here is my breakdown of the current BTCUSDT setup.
Market Analysis
BTCUSDT previously traded inside an upward channel with a fake breakout before breaking higher and shifting bullish. Price then formed a range and continued higher within a broader upward channel, testing the Resistance Zone near 88,000.
Currently, BTCUSDT is trading below the 88,000 Resistance Zone while holding above the 82,600 Support Zone and the upward channel. The recent rebound from support suggests buy
EURUSD: Turns Lower Again as the Trend Line Holds, Aim To 1.1190Hello everyone, here is my breakdown of the current EURUSD setup.
Market Analysis
EURUSD previously traded inside a range before breaking lower and shifting into a descending structure under the Trend Line. Price then tested the Resistance Zone with a fake breakout and was rejected, confirming the bearish bias.
Currently, EURUSD is trading below the 1.1310 Resistance Zone while holding above the 1.1190 Support Zone. The recent rejection and descending Trend Line suggest sellers may attempt a
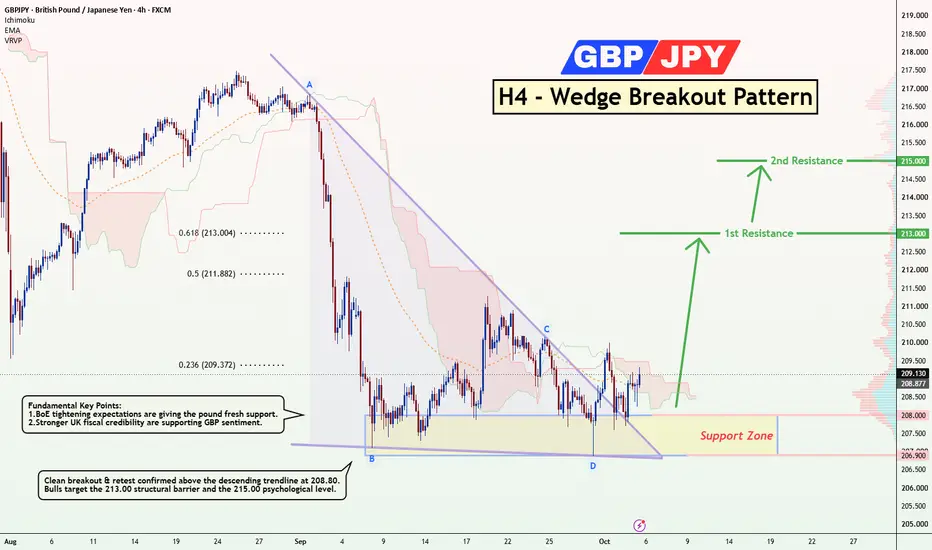
GBP/JPY H4 Support Rejection with Breakout (05.10.2026)GBPJPY 4H has confirmed a clean falling wedge breakout following sustained accumulation above the 206.90 to 208.00 support zone. The descending trendline broken with strong candle confirmation signals bearish momentum fading and exposes the 213.00 resistance.
A sustained close below the 206.90 support zone invalidates the immediate bullish outlook. The setup strictly favors continuation toward the 215.00 psychological barrier. Price has broken above the Ichimoku cloud base and this structural
BTCUSD 4H | Liquidity Sweep MSS & Bearish Rejection — Key LevelsBTCUSD 4H — Liquidity Sweep, Market Structure Shift & Potential Bearish Expansion
Market Overview
Bitcoin is currently trading around 85,122, following a strong bullish expansion from the 75,000–77,000 demand region toward the 87,300 liquidity area.
The chart highlights an important transition from bullish expansion into consolidation and potential distribution.
After reaching the previous high, price experienced rejection and began forming lower highs beneath descending resistance. However,
Gold XAUUSD Market Structure, Order Blocks & Liquidity AnalysisThis analysis focuses on the current market structure of Gold (XAUUSD), with emphasis on market structure, liquidity, order blocks, trend-line interaction, and key reaction zones.
Price has been moving within a broader bearish structure, with a sequence of lower highs and lower lows visible across the chart. However, after the strong bearish displacement, price has entered a consolidation/ranging phase near the 4,120–4,200 area. This range is currently an important area to monitor for a potenti
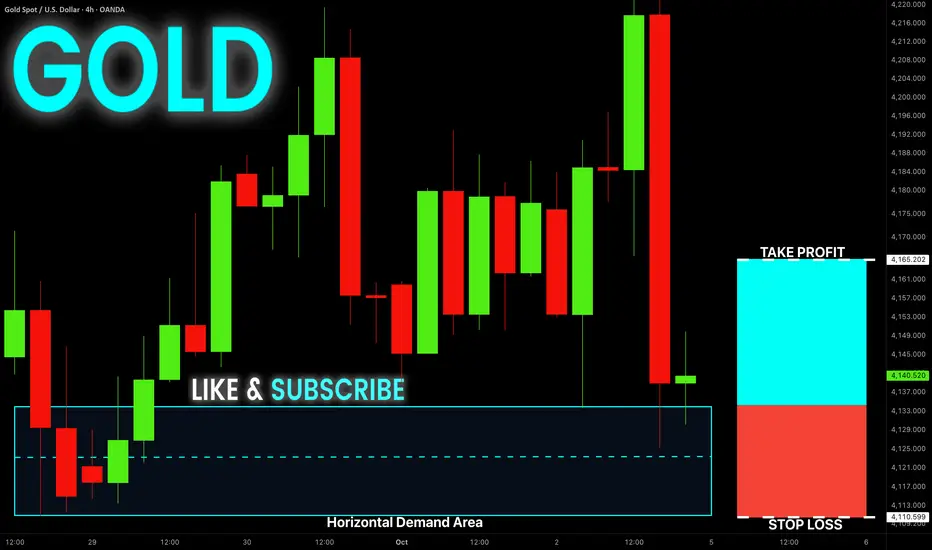
GOLD Free Signal! Buy!
Hello,Traders!
GOLD is rebounding from the horizontal demand area after a liquidity sweep, with renewed accumulation and buying pressure supporting continuation toward the marked take-profit level.
------------------
Stop Loss: 4110.60$
Take Profit: 4164.82$
Entry: 4134.27$
Time Frame: 4H
------------------
Buy!
Comment and subscribe to help us grow!
Check out other forecasts below too!
Market Structure, Liquidity & Trendline Analysis (SMC)Price does not move randomly. It moves from liquidity to liquidity, leaving footprints along the way: structural breaks, imbalances, and reactions at trendlines. This chart brings those footprints together on one canvas. Below, each concept is explained so you can apply it to any market and timeframe.
1. Market Structure: The Skeleton of Price
Market structure is the sequence of swing highs and swing lows that price leaves behind.
Bullish structure: Higher Highs (HH) and Higher Lows (HL)
Be
USDJPY: Bullish Outlook Explained 🇺🇸🇯🇵
USDJPY will likely continue rising after a retest of the recently broken resistance of a consolidation range on a 4H time frame.
The formation of a buying imbalance candle indicates strong bullish pressure.
Goal - 158.64
❤️Please, support my work with like, thank you!❤️
I am part of Trade Nation's Influencer program and receive a monthly fee for using their TradingView charts in my analysis.
GBPUSD: Bearish-Neutral! If Resistance Holds, Take The Sell!Welcome back to the Weekly Forex Forecast for the week of Oct 5-9th.
In this video, we will analyze the following FX market: GBPUSD
The GBP/USD pair currently carries a neutral-to-cautiously bearish bias near the 1.3220 level, testing key macro liquidity pools and structure points. On higher timeframes, the price action reveals a clear bearish market structure characterized by a sequence of lower highs and lower lows. If price action signals a sweep of sell-side liquidity at the 1.3140–1.3194
BTC Trendline Break | A Gann-Inspired PerspectiveBitcoin’s lower channel boundary supported the major lows in 2018, March 2020, and late 2022. In 2026, price slipped below it and is now testing that boundary again.
I think this trendline will fail, and this retest will lead to another leg lower. My expectation is that former support becomes resistance, confirming the breakdown.
Gann warned about a fourth test breaking through after previous tests held. His original rule referred to the same price level; I’m applying that concept here to a ri
S&P 500 Looks Very Bullish (3H)From the point where we placed the red arrow on the chart, a corrective structure has been developing on the .
Based on the current price action and the internal structure of the correction, this movement appears to be forming a Double Combination. The market has already completed a significant portion of this corrective phase, and price is now approaching what could be the final stages of the entire structure.
The key area to monitor from here is the green demand zone highlighted on the char