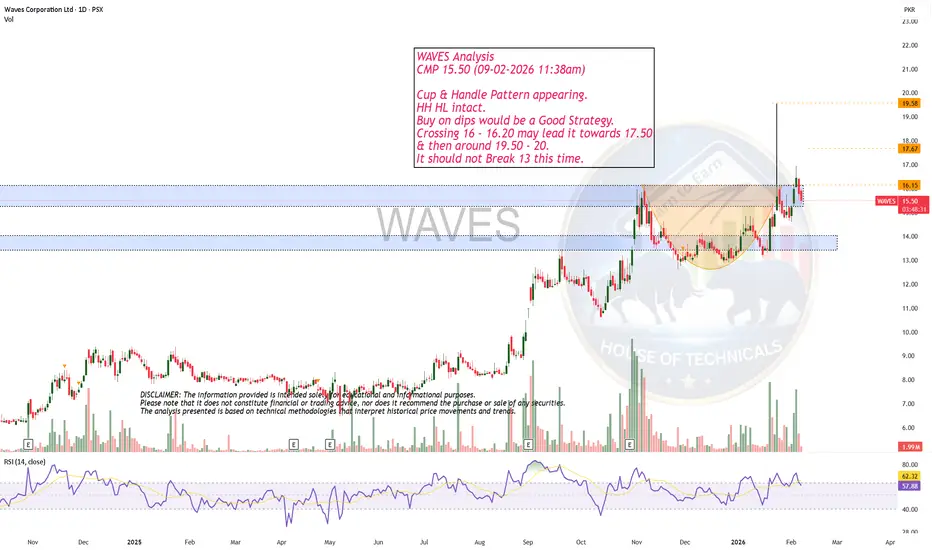
Strong Setup!WAVES Analysis
CMP 15.50 (09-02-2026 11:38am)
Cup & Handle Pattern appearing.
HH HL intact.
Buy on dips would be a Good Strategy.
Crossing 16 - 16.20 may lead it towards 17.50
& then around 19.50 - 20.
It should not Break 13 this time.
Strongbuy
Elite | BTCUSD | 1D – Macro Accumulation & Trend Holding PhaseBITSTAMP:BTCUSD
The previous impulsive leg confirms strong institutional participation. The current decline is corrective, not impulsive, with price respecting the daily trendline and holding above major demand. Prolonged consolidation at this level suggests energy building for a larger expansion move, as volatility compression typically precedes directional continuation in macro trends.
Key Scenarios
✅ Bullish Case 🚀
If BTC holds above the daily holding area and reclaims the correction zone:
🎯 Target 1: 95,000
🎯 Target 2: 105,000
🎯 Target 3: 118,000 – 120,000 (ATH liquidity zone)
❌ Bearish Case 📉
If price decisively breaks and closes below daily trend support:
🎯 Downside Target 1: 78,000
🎯 Downside Target 2: 72,000 (major HTF demand)
Current Levels to Watch
Resistance 🔴: 95,000 – 100,000
Support 🟢: 82,000 – 78,000
⚠️ Disclaimer: This analysis is for educational purposes only. Not financial advice.

TRUTH / USDT : Keep a close watch on breakoutTRUTH is approaching trend line resistance with strong potential. A confirmed breakout from this level could trigger a 15–20% bullish move in the short term.
Keep a close watch and always enter only after clear confirmation. Manage risk properly.

$BTCZ Might as well make lemonade out of the crash!CRYPTOCAP:BTC is moving downwards, and it's pretty evident now. On the flip side, you can take this lemon and make some lemonade. CBOE:BTCZ does a very nice job, since it's an inverse ETF, and it's a sweetheart price level at the moment. Never ever get emotional about stocks, etfs, crypto etc. You play to win and take advantage of the cards that are handed down. Technicals and UltraBuy seem to line-up nicely too...
Best of luck!

Interesting play MSTZMSTR has been under a cloud lately, and if we take a closer look at MSTZ we find that it's slowly creeping higher. Notice how SMA50 is crossing up SMA200. This will become a very interesting play when the price crosses below $300.

$VIX trending up nicely.....buckle your seatbeltVIX has been on the downside for the last few months, mostly because of much f$ckery in the market that is running super hot. I would not be surprised if it crosses 20 this week! You can use UVIX as the proxy. Best of luck! This could be magical

DON'T MISS a potential CRAZY RUN!!! Unfolding RIGHT NOW!!!When I m opening this chart I m always seeing hudge potential and upside.
This, right here, is a key moment in it's development: it either goes crazy or starts ranging some more.
Let's see!
Let me know if, and why, you agree or disagree with this!

SUDARSHANCHEMSUDARSHANCHEM showing very good strength and consolidating since a month near ATH. Result is expected tomorrow on 25-Aug. If it declares bumper result then we may see next leg of steep rally. In recent time accumulation has been observed. Provided that if it closes above 1380 level then one may get very good risk-reward trade from hereon. Keep a stock in watch list. Just a small volume may push it above resistance line.

is BTC going TOP again? Road To 138,000?~ In this trading idea, here is showed how well and nice this wave works.
In first example we got nice uptrend so I'm expecting that we will see something similar in a few days!
~ My prediction is to be ready strong uptrend again.
Like this idea if you see it's useful.
Make comment about your opinions too. <3
Nika. :)

Fresh Breeze in the Portfolio – VOLTAS Buy SignalHere are two charts of VOLTAS — one on the weekly timeframe and the other on the daily timeframe.
On the weekly timeframe: VOLTAS is taking strong support in the ₹1,050–₹1,100 range.
The EMA is also providing support near the ₹1180 level and 1030-1050 level .
On the daily timeframe, VOLTAS is taking support near the ₹1180-₹1200 level.
VOLTAS has two key support zones — in the short timeframe at ₹1,180–₹1,200, and in the long timeframe at ₹1,050–₹1,100.
If these levels are sustained, we may witness higher prices in VOLTAS.
Thank You !!

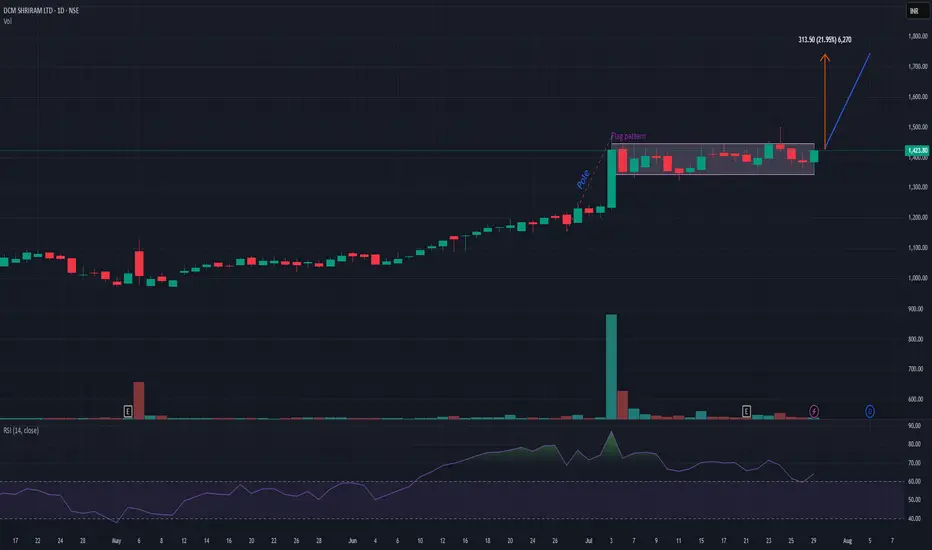
DCMSHRIRAMDCMSHRIRAM is on verge of flag pattern breakout provided that it closes above 1440 level. It has a potential to add up to 20-22% from this level. My view may change if it closes below 1350. Risk-reward is quite in favor. Keep it on radar.
BLACKBUCKBLACKBUCK showing strength and crossed previous resistance zone with decent volume. Support is near 425-8 levels. Resistance is near 510 and above that it may enter into uncharted zone. Keep it on radar.
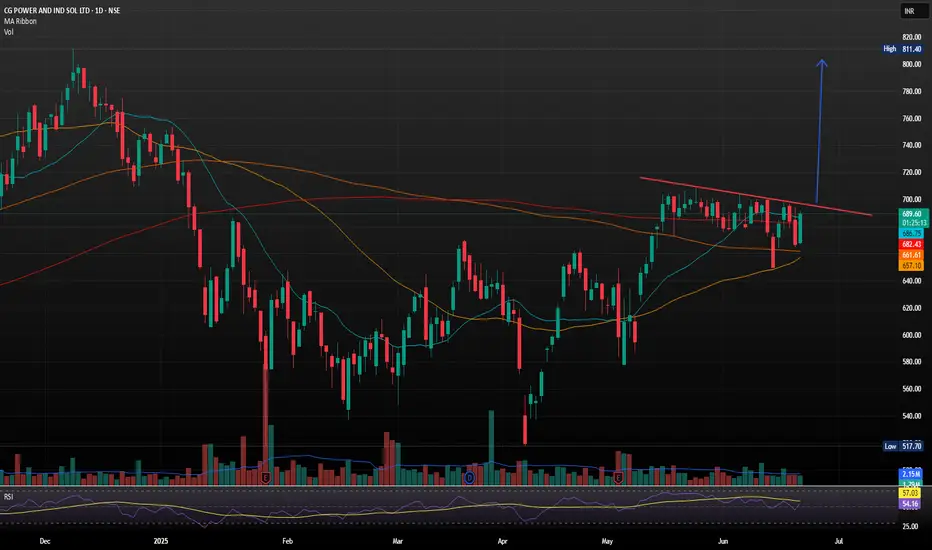
CG Power and Industrial Solutions with Strong Bullish Flag SetupCG Power and Industrial Solutions just landed its largest-ever single order a 641 crore contract from Power Grid Corporation of India Ltd (PGCIL) for high-voltage transformers and reactors
The company, now under the Murugappa Group, reported consolidated FY25 revenues of 9,909 crore. However, annual profit dipped to 972.98 crore from 1,427.61 crore in FY24, despite a strong Q4 showing with a 17% YoY rise in net profit to 274.26 crore.
- Inverse Head & Shoulders Breakout: The stock recently broke out of an inverse H&S pattern, a classic bullish reversal signal, with strong volume confirmation. Holding above 690 could push it toward 750 TO 800.
Support & Resistance Levels
- Support: 663–679 demand zone
- Resistance: 694, 704 and 712
Trend Summary
- Short-Term: Neutral to bullish
- Medium-Term: Bullish bias if it sustains above 690
- Volatility: Elevated, so expect sharp swings
Strong Bullish Divergence on Bigger tf.FECTC Closed at 76.81 (16-06-2025)
Strong Bullish Divergence on Bigger tf.
Hidden Bullish Divergence also appearing.
Taken Support from 0.618 fib level.
Cup & Handle Formation on Bigger tf.
Upside Resistance is around 126 - 133
Crossing & Sustaining this level may lead it
towards 220 - 240.
However, it should not break 55 now.

RITESRITES showing good strength in recent session. And currently trading near strong hurdle. It has a strong resistance near 310-15 levels and rejected many times earlier. So if now closing above 315 may start new momentum rally in the counter which may continue for next 20-22% upwards. On lower side 270 seems very good support But closing above 315 is very crucial. I would avoid before that but surely keep a closer watch on it.

HCCHCC is on the verge to give triangle breakout provided that it sustains and closes above 31.5. I observed increased market participation. It may face bit of resistance near 36 level and above that it has a potential to go up to 45 levels. But closes below 28.5 may change my view for the stock. Again I'm saying that sustaining above 31.5 is very crucial. Keep a closer watch on how it reacts near this levels.

Strong Bullish DivergenceStrong Bullish Divergence has appeared.
If today's low is not broken,we may witness 173 - 175 initially
& then around 180 - 185.

NIVABUPANIVABUPA showing resistance breakout with decent volume and can go up to the recent arc curve depth ie approx 18%. It is very strong on weekly chart as well. Closing below 85 may change the view. keep it in your watchlist

KIMSKIMS has given inverted H&S breakout with decent volume. The depth is around 28-30% from neckline to bottom of the head. So if we add it to breakout line then we may see the same move on upper side. If we look at weekly timeline then also it has given resistance breakout. Seems very promising.

... Pure Technical Tukka ... KHADIM INDIA LTD ... NSE:KHADIM
as per Studies Thought by Institutions ... we are assuming -6.6 % of SL and Going for the Target of +24.15% ...
That means ... we are Maintaining around 1:4 RR (Risk Reward Ratio)
This Trade is Pure Tukka ...
Fundamental Ratio's Are Not Satisfying ... Every Analyst Would Say that Stay Away From Khadim India Ltd ...
Then Why Our Page is Sharing This Stock As Buying Suggestion ?
Entering a Trade with a STOP LOSS ... SL of -6.6% .... is not a Bad Practice ....
if anyone is Afraid of SL then He/She should stop or quit Trading ...

AUDUSD Strong BuyStrong Buy AUDUSD!
Entry after a pullback in the area of 0.6720 and stop below 0.6665. The projection results in a target at 0.6900. (174 Pips)
Risk/Reward: 3.26
Reasons: Weekly Delta Positive and rising.
Lots of dormant liquidity in the area above 0.6900
Furthermore, the seasonal trend for the next 2 weeks shows strong support for the AUD!(5y)
Plus Lots of short traders trapped with stops in the 0.7150 area, which shows much higher potential for longer term positions in AUDUSD.
All of this would be confirmed if the AUD can establish itself above 0.6900

GameStop Odyssey: Retail Triumphs and Marvels through EFI/VolumeThe "GameStop Odyssey" timeline serves as a vivid testament to the sheer force of retail trading and the enduring appeal of GameStop in the financial markets. This chronology isn't just a recount of stock prices and trading volumes; it's a triumphant saga that captures the strategic pivots, significant milestones, and the unyielding spirit of individual investors who've rallied behind the stock. Despite recurrent skepticism and often negative media portrayals, GameStop continues to emerge as a symbol of what enthusiastic and coordinated retail investors can achieve. It underscores how, against all odds and negative forecasts, the community-driven force behind GameStop keeps the company relevant and dynamically engaged in the stock market's limelight.
By detailing each significant spike and drop in stock prices alongside corresponding EFI/volume fluctuations, this timeline does more than track financial metrics—it illustrates a narrative of resilience and retail investor empowerment. Each entry highlights how GameStop has not only survived but thrived, navigating through waves of market volatility and media doubt. This chronicle aims to inspire and educate, showing that the narrative of "dumb money" is a misnomer; instead, it's a story of strategic triumphs and collective investor savvy, proving time and again that the spirit of the market lies in the hands of its participants.
### GameStop Timeline with EFI and Stock Prices
**September 28, 2020:**
- EFI: 500 million
- News: GameStop was undergoing strategic shifts and significant interest from retail investors, focusing on transitioning its business model towards digital sales channels.
- Source: (news.gamestop.com)
**October 26, 2020:**
- EFI: 500 million
- News: GameStop continued to gain attention from retail investors, announcing plans to strengthen its online presence and enhance customer engagement through e-commerce initiatives.
- Source: (news.gamestop.com)
**December 21, 2020:**
- EFI: 500 million
- News: GameStop announced further strategic updates aimed at improving its financial performance and adapting to the evolving retail landscape.
- Source: (news.gamestop.com)
**December 28, 2020:**
- EFI: 500 million
- News: GameStop's stock surged due to increased interest from retail investors on forums like Reddit, marking the beginning of the stock's volatile period leading into 2021.
- Source: (news.gamestop.com)
**January 4, 2021:**
- EFI: 500 million
- News: GameStop maintained a higher EFI level as interest in the stock grew among retail investors, with discussions on WallStreetBets gaining momentum.
- Source: (news.gamestop.com)
**November 29, 2021:**
- EFI: 500 million
- News: GameStop continued to be a topic of interest post-meme stock phenomenon, with investors watching the company's performance and strategic decisions closely.
- Source: (news.gamestop.com)
**March 14, 2022:**
- EFI: 500 million
- News: GameStop's financial performance updates highlighted ongoing efforts to turn around the company's fortunes, focusing on digital transformation and operational efficiencies.
- Source: (news.gamestop.com)
**August 15, 2022:**
- EFI: 500 million
- News: GameStop emphasized enhancing its digital platform and customer experience, continuing strategic changes aimed at strengthening its market position.
- Source: (news.gamestop.com)
**March 20, 2023:**
- EFI: 500 million
- News: GameStop's ongoing performance updates focused on strategic initiatives and financial health, with investors assessing the impact on the stock's performance.
- Source: (news.gamestop.com)
**April 10, 2023:**
- EFI: 500 million
- News: Keith Gill, known as "Roaring Kitty," revealed he was holding $181.4 million worth of GME stock and call options, causing a significant surge in the stock's price.
- Source: (news.gamestop.com)
**May 13, 2024:**
- EFI: Spiked at around 510 million
- News: The EFI spiked at around 510 million, and it wouldn't again cross the 500 million EFI/week until this past Monday, indicating significant trading activity and interest in GameStop stock.
- Source: (news.gamestop.com)
**June 3, 2024 - June 5, 2024:**
- EFI: 510 million
- News: GameStop announced its preliminary financial results for Q1 2024. The results highlighted a net sales decline to approximately $0.872 billion-$0.892 billion compared to the previous year's $1.237 billion. The net loss is expected to range between $27 million and $37 million, an improvement from the $50.5 million loss in the prior year. The announcement indicates ongoing challenges but shows some progress in cost management and cash flow.
- Source: (news.gamestop.com)
[GameStop Analysis: From a Dad Who Dreams Big
Hello everyone,
I'm a single dad deeply into chart analysis, eager to share insights that might help others make informed trading decisions. Currently, I'm not in a position to invest myself, but I'm looking forward to joining you all soon. If you find value in my work and wish to support my journey into trading, any help would be deeply appreciated.
Here's my BTC address if you choose to contribute, would mean the world to us here at this little NYSE:GME hypestation!
bc1qxt4cwsm3py94ze8a2s3ucsaxzllehx5qj4g0qq.
(at the time of creating this article no one at this location including me, the author own a single fractional share or position in GameStop. We do however feel the hype for NYSE:GME Proud of you all!)
Thank you for considering my work, and happy trading!

Info Edge (India) Ltd Showing Strong Up-Side MomentumStrong operating businesses
Strong Operating Cash generation year with a run- rate of c1000 Cr plus (pre Tax) annually and growing.
Negative working capital due to advance subscription fees (Rs 925 cr as on 31/12/23)
Asset-light business models
"Zero" Debt.
Well Defined approach towards Financial Investments
AIF structure for eventual and self-sustained independent financial investment business.
Partnered with reputed Sovereign Fund (Temasek Holdings).
AIF contribution commitment is currently pegged at ~USD 212.5m
Funds created with a term of 12-14 years.
Established Dividend payout track record.
Formal dividend policy of paying 25%-40% of standalone cash PAT.
Track record of consistent dividend payout for last 16 years. Paid 28% of cash PAT as dividend till date.
Info Edge is India’s premier online classified company with a portfolio of brands. It owns various brands in different fields like naukri.com (online recruitment), 99acres.com (online real estate), jeevansathi.com (online matrimonial) as well as shiksha.com (online education information services). It also acts as an investor and has invested in many start-ups in the online space and is actively growing its investment portfolio.
Company is almost debt free.
Company has delivered good profit growth of 55.9% CAGR over last 5 years
B2B revenues (as on date) comprise ~90% of overall Naukri revenue and includes:
Resume database access (Naukri & iimjobs)
Job Posting (response management)
Employer branding (visibility)
Application tracking tools (Zwayam)
eHire - Resume short listing and Walk-ins
Assessment services (Do-select)
■ B2C includes revenue from
Job seeker services
Career enhancement services (AmbitionBox, Coding Ninjas, Naukri Learning)
