BTCUSDT Long: Uptrend Continues Toward 94,500 ResistanceHello traders! Here’s a clear technical breakdown of BTCUSDT (4H) based on the current chart structure. BTCUSDT initially traded within a well-defined descending channel, reflecting sustained bearish pressure during that phase. This move ended with a clear pivot point, followed by a strong breakout from the descending channel, signaling a shift in market control from sellers to buyers. After this breakout, price transitioned into a broad range, where BTC consolidated for an extended period, showing balance between supply and demand with multiple internal reactions.
Currently, BTC is approaching a key Supply Zone around the 94,500 level, where previous selling pressure is expected to re-emerge. This area aligns with the upper boundary of the ascending channel, increasing the likelihood of a reaction. Below current price, the Demand Zone near 86,800 remains a critical support level, marking the prior breakout area and the base of the bullish structure.
My scenario: as long as BTCUSDT holds above the Demand Zone and stays within the ascending channel, the bullish bias remains intact. I expect price to test the 94,500 Supply Zone, where a reaction or short-term pullback may occur. A clean breakout and acceptance above supply would signal further upside continuation. However, a strong rejection from supply followed by a breakdown below channel support would suggest a deeper corrective move. For now, structure favors buyers while price remains within the ascending channel. Manage your risk!
Supply and Demand

USDHCF I Weekly CLS Range I Model 1 Hi friends, new range created. As always we are looking for the manipulation in to the key level around the range. Don't forget confirmation switch from manipulation phase to the distribution phase to make the setup valid. Stay patient and enter only after change in order flow. If price reaches 50% of the range take partial or full close. 👊 Your ultimate goal as a trader is not to be a generalist who knows 100 patterns. But rather create one system with narrowed criteria of each element of the trade to remove subjective and emotional decisions as much as possible and stick to this system no matter what. Practice it everyday become a MASTER.
I promised myself I’d become the person I once needed the most as a beginner. Below are links to a powerful lessons I shared on Tradingview. Hope it can help you avoid years of trial and error I went thru.
📊 Sharpen your trading Strategy
⚙️ 100% Mechanical System - Complete Strategy
🔁 Daily Bias – Continuation
🔄 Daily Bias – Reversal
🧱 Key Level – Order Block
📉 How to Buy Lows and Sell Highs
🎯 Dealing Range – Enter on pullbacks
💧 Liquidity – Basics to understand
🕒 Timeframe Alignments
🚫 Market Narratives – Avoid traps
🐢 Turtle Soup Master – High reward method
🧘 How to stop overcomplicating trading
🕰️ Day Trading Cheat Code – Sessions
🇬🇧 London Session Trading
🔍 SMT Divergence – Secret Smart Money signal
📐 Standard Deviations – Predict future targets
🎣 Stop Hunt Trading
💧 Liquidity Sweep Mastery
🔪 Asia Session Setups
🧠 Level Up your Mindset
🛕 Monk Mode – Transition from 9–5 to full-time trading
⚠️ Trading Enemies – Habits that destroy success
🔄 Trader’s Routine – Build discipline daily
💪 Get Funded - $20 000 Monthly Plan
🧪 Winning Trading Plan
🛡️ Risk Management
🏦 Risk Management for Prop Trading
📏 Risk in % or Fixed Position Size
🔐 Risk Per Trade – Keep consistency
Adapt useful, Reject useless and add what is specifically yours.
David Perk

Bitcoin is completing a bullish triangle (12H)Since we marked the red arrow on the chart the price has entered a bearish phase
This phase appears to be a complex correction likely a double structure as we can observe an ABC plus X wave followed by a triangle formation
We are currently at the end of the second corrective wave with only one wave Wave E of this triangle remaining Once Wave E completes within the green zone the price may enter a bullish phase
In this scenario the recovery will only begin after the completion of Wave E This means that all movements from the current low until now have been part of corrective action and the bearish phase Therefore we can anticipate Bitcoins recovery target to reach around 106000 dollars
It is expected that the price will find support moving from the red zone toward the green zone after which stronger bullish movements could follow
Targets have been clearly marked on the chart for reference
Important A daily candle close below the invalidation level will negate this analysis and suggest a different market scenario
If you have a coin or altcoin you want analyzed, first hit the like button and then comment its name so I can review it for you.
This is not a trade setup, as it has no precise stop-loss, stop, or target. I do not publish my trade setups here.

THE KOG REPORT - UpdateEnd of day update from us here at KOG:
A good start to the year and week with the gap on open breaking our bias level and completing the red box targets. We also managed to achieve the red box defence where earlier we got the RIP for a bonus reverse trade.
Now we have resistance at the red box which needs to be monitored for a 4H close, otherwise, we'll stick with the idea and look for a possible retracement here into the 4430-20 region initially.
With this gap below and the stretch in play, we're too high and it's too risky to attempt going long, so there is no option but to wait for the pullback or, to attempt the short from resistance levels.
Key levels here:
4455 Resistance with 4460 in extension
4440 support with 4435 in extension
As always, trade safe.
KOG

EURUSD Short: Supply Holds Strong - Market Eyes 1.1680 DemandHello traders! Here’s a clear technical breakdown of EURUSD (3H) based on the current chart structure. EURUSD is trading within a broader bullish structure, supported by a well-defined ascending trend line that has guided price higher from the previous pivot low. Earlier, the market spent time consolidating inside a range, indicating accumulation before the upside expansion. A strong impulsive breakout from this range confirmed buyer control and triggered a bullish continuation move. As price advanced, EURUSD reached a key Supply Zone around 1.1750–1.1760, where selling pressure became visible. Multiple attempts to push above this area resulted in fake breakouts, clearly signaling buyer exhaustion and the presence of strong sellers at higher levels. The chart highlights several failed breakouts and rejections from the supply line, reinforcing this zone as a critical resistance.
Currently, after the rejection from the upper highs near the pivot point, price broke below the short-term structure and is now trading below the supply line, suggesting a loss of bullish momentum. The recent bounce appears corrective rather than impulsive, indicating that the market may be preparing for a deeper pullback rather than immediate continuation higher. Below current price, the Demand Zone around 1.1680 stands out as the next major downside target. This level previously acted as support and aligns with a key horizontal demand area where buyers may attempt to step back in. A move toward this zone would represent a healthy correction within the broader structure.
My scenario: as long as EURUSD remains below the 1.1750 Supply Zone and continues to respect the descending supply line, the short-term bias favors sellers. I expect downside continuation toward the 1.1680 Demand Zone. A strong bullish reaction from demand could lead to consolidation or a corrective bounce, but a clean breakdown below 1.1680 would signal a deeper bearish correction. For now, price is at a key decision area, with sellers in control below supply and demand acting as the main downside objective. Manage your risk!

XAUUSD 30M – Support Hold & Bullish Recovery SetupPrice is reacting from a well-defined support zone around 4,310–4,330, showing signs of a short-term bullish recovery
A break and close above 4,360–4,380 can confirm upside momentum toward the first TP near 4,395–4,400
Sustained strength above 4,415 opens the path toward the main target at 4,450–4,460, while a break below support would invalidate the bullish setup.

XAUUSD: 1 Hour Swing Trading Setup! 05/01/2026Trading Setup 1 Hour View On XAUUSD
🔺Last week, gold experienced a significant decline as market volumes normalized. Our initial assessment anticipated a further price drop to approximately $4100. However, evolving fundamental factors and recent U.S. actions concerning Venezuela prompted global investors to seek the metal as a safe-haven asset amidst heightened geopolitical tensions.
🔺Currently, gold is trading at $4462. At this price level, we project a substantial upward movement towards $4662, indicating a strong swing buy opportunity. We have identified three target levels: the first at $4522, the second at $4593, and the final target at $4662. A stop-loss order can be strategically placed below $4440.
🔺Should you find our analysis valuable, we encourage you to like and comment for additional insights and trading setups. We strongly recommend conducting your own thorough due diligence prior to executing any trades, as this information is provided solely for educational chart analysis purposes.
Sincerely,
Team SetupsFX_

XAUUSD 30M – Bullish Trend Continuation SetupPrice is in a strong bullish structure, respecting the ascending trendline and holding above the key support zone near 4,395–4,410.
A healthy pullback into 4,450–4,460 can offer continuation entries, with first target at 4,495–4,500.
A confirmed breakout above 4,500 opens the path toward the main target zone at 4,520–4,530, while a break below support would invalidate the bullish setup.

ETH New Analysis (4H)This analysis is an update to the previous one, which you can find in the related analyses section.
Since no significant capital flowed into Ethereum, the pattern changed in a way that shortened the target of the next wave. As we are in the final days of the year, market liquidity is low, which is why we are seeing increased volatility and erratic behavior across market assets.
Analysis is not very effective these days, and as we announced a week ago, you should reduce your trading volume due to the year-end conditions | for exactly these reasons.
Instead of the previous diametric analysis, the price structure appears to have shifted into a wider pattern. This expansion is due to the lack of capital inflow and overall low liquidity in the market during these year-end days.
Price is expected to be supported from the origin of the move, which we have highlighted in green on the chart.
Ethereum is still owed an upward move, but it is likely to make this move with difficulty. The targets are marked on the chart.
For risk management, please don't forget stop loss and capital management
When we reach the first target, save some profit and then change the stop to entry
Comment if you have any questions
Thank You

Selena | XAUUSD – 1H | Market Structure & Live AnalysisPEPPERSTONE:XAUUSD
Price previously rejected from the upper channel resistance, triggering a deep correction. That correction formed a range-out zone, where sellers failed to continue downside. The breakout from this range indicates re-accumulation, not distribution. Current price action is a pullback into a previous intraday demand / breakout retest zone, which aligns with the channel midline — a high-probability continuation area.
This is not a random buy. This is structure-based continuation.
Key Scenarios
✅ Bullish Case 🚀
If price holds above the highlighted demand zone and respects channel support, continuation toward HTF highs is expected.
🎯 Target 1: 4,500
🎯 Target 2: 4,540
🎯 Target 3: 4,580 (HTF resistance / liquidity)
❌ Bearish Case 📉
A strong 1H close below the demand zone and channel support would invalidate the bullish continuation and suggest deeper correction toward 4,300.
Current Levels to Watch
Resistance 🔴: 4,500 – 4,560
Support 🟢: 4,420 – 4,440
Invalidation ❌: Below 4,400 (1H close)
⚠️ Disclaimer: This analysis is for educational purposes only. Not financial advice.

BTC Breakout in Play Retest Zone Will Define ContinuationAs highlighted in our previous BTC update, price was approaching a structural decision point and the breakout has now been confirmed.
BTCUSDT has now broken above the upper trendline of the bearish structure , signaling a short-term shift in market behavior after prolonged downside pressure.
A sustained break and acceptance above the immediate resistance will confirm bullish stability, with a natural retest expected toward the breakout zone and the immediate support zone.
If this retest is successful and price holds above reclaimed structure, upside continuation remains favored toward the projected targets marked on the chart. Failure to maintain acceptance above this zone would invalidate the breakout scenario and shift focus back toward lower support.

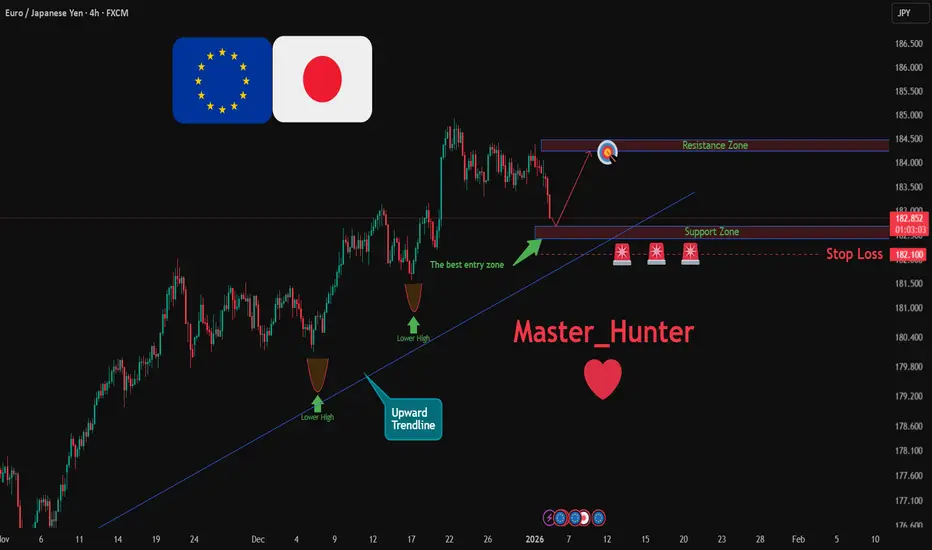
EURJPY: Bullish Push to 184.24?FX:EURJPY is eyeing a bullish continuation on the 4-hour chart , with price bouncing from an upward trendline near lower high, converging with a potential entry zone at support that could fuel upside momentum if buyers hold amid recent consolidation. This setup indicates a rally opportunity post-pullback, targeting higher resistance levels with risk-reward exceeding 1:2.5 .🔥
Entry between 182.43–182.69 for a long position (entry from current price with proper risk management is recommended). Target at 184.24 . Set a stop loss at a daily close below 182.1 , yielding a risk-reward ratio of more than 1:2.5 . Monitor for confirmation via a bullish candle close above entry with increasing volume, capitalizing on the pair's upward bias near key levels.🌟
Fundamentally , EURJPY is trading around 182.9 in early January 2026, with key events this week including Wednesday's Eurozone HICP Flash (Dec) for preliminary inflation data that could strengthen EUR if higher than expected, signaling ECB hawkishness; and Thursday's ECB SCE (Spring Consensus Expectations) for economic projections that may boost EUR on positive outlooks. For JPY, Monday's Japanese PMI Final (Dec) could weaken the yen if revised lower, indicating manufacturing contraction. Overall, stronger Euro data versus soft JPY readings could favor upside in EURJPY amid low holiday volume. 💡
📝 Trade Setup
🎯 Entry (Long):
182.43 – 182.69
(Entry from current price is valid with proper risk & position sizing.)
🎯 Target:
• 184.24
❌ Stop Loss:
• Daily close below 182.10
⚖️ Risk-to-Reward:
• > 1:2.5
💡 Your take?
Does EURJPY extend toward 184.24, or do you expect deeper consolidation before the next push higher? 👇
DOLLAR I Weekly CLS I Nested in Monthly - H4 Hi friends, new range created. As always we are looking for the manipulation in to the key level around the range. Don't forget confirmation switch from manipulation phase to the distribution phase to make the setup valid. Stay patient and enter only after change in order flow. If price reaches 50% of the range take partial or full close. 👊 Your ultimate goal as a trader is not to be a generalist who knows 10 000 patterns. But rather create one system with narrowed criteria of each element of the trade to remove subjective and emotional decisions as much as possible and stick to this system no matter what. Practice it 10 000 times become a MASTER.
I promised myself I’d become the person I once needed the most as a beginner. Below are links to a powerful lessons I shared on Tradingview. Hope it can help you avoid years of trial and error I went thru.
📊 Sharpen your trading Strategy
⚙️ 100% Mechanical System - Complete Strategy
🔁 Daily Bias – Continuation
🔄 Daily Bias – Reversal
🧱 Key Level – Order Block
📉 How to Buy Lows and Sell Highs
🎯 Dealing Range – Enter on pullbacks
💧 Liquidity – Basics to understand
🕒 Timeframe Alignments
🚫 Market Narratives – Avoid traps
🐢 Turtle Soup Master – High reward method
🧘 How to stop overcomplicating trading
🕰️ Day Trading Cheat Code – Sessions
🇬🇧 London Session Trading
🔍 SMT Divergence – Secret Smart Money signal
📐 Standard Deviations – Predict future targets
🎣 Stop Hunt Trading
💧 Liquidity Sweep Mastery
🔪 Asia Session Setups
🧠 Level Up your Mindset
🛕 Monk Mode – Transition from 9–5 to full-time trading
⚠️ Trading Enemies – Habits that destroy success
🔄 Trader’s Routine – Build discipline daily
💪 Get Funded - $20 000 Monthly Plan
🧪 Winning Trading Plan
🛡️ Risk Management
🏦 Risk Management for Prop Trading
📏 Risk in % or Fixed Position Size
🔐 Risk Per Trade – Keep consistency
Adapt useful, Reject useless and add what is specifically yours.
David Perk

THE KOG REPORTTHE KOG REPORT:
In last week’s KOG Report to end the year we said we would only be looking for short trades and gave the levels above that we wanted to short from. Price didn’t quite hit our red box level but we got close and upon activation on the indicators and Excalibur we managed to get the trade we wanted, and what a trade it was!
We then update traders with the potential low to look for and the retracement trade long up into the red box which was also pin-point successful. As you can see from the chart, it was from there we wanted the RIP, again, level to level, point to point on the indicators for the short to end the week!
Another successful week, month and year in Camelot not only on gold but across the numerous other pairs we analyse and trade.
So, what can we expect in the week ahead?
With NFP this week and a lot of news to start the week, we can expect volatility as usual. Now add the geopolitical news over the weekend and there are chances we open with gaps on the markets. For that reason, we will say we’ll stick with our levels as they work well no matter the market condition, however, expect some choppy movement and potential for the levels to be completed straight away!
Below we have immediate support at the 4330 level and below that the bias level of 4320. It’s the 4320 region that needs to be monitored for the break downside, as failure to do so can result in a RIP from there and potential move upside to break above 4335 taking us into the 4355-60 region and above that we should be looking at the 4390-95 region. It’s just above that we’ve highlighted potential for a RIP as these higher levels are lining up with the red boxes and unless we get a break above, we could get the reaction bears will want to see from above for another aggressive move.
Now, the caveat. We do have a higher Excalibur active but we want to see how the market opens and how it reacts to the open. Based on the structure at the moment there is a chance for an undercut low which make support lower but, defence is in the way so let’s see how the market opens and wait for the price to do it’s thing. Once we have opening confirmation, we will know how to play it. That’s just the way the game is played team.
RED BOXES AND TARGETS:
Break above 4340 for 4355, 4365 and 4368 in extension of the move
Break below 4320 for 4310, 4304, 4395 and 4390 in extension of the move
Please do support us by hitting the like button, leaving a comment, and giving us a follow. We’ve been doing this for a long time now providing traders with in-depth free analysis on Gold, so your likes and comments are very much appreciated.
As always, trade safe.
KOG

BTC with new top head 2026This an analysis for btc to have new top at 136 then 153 after crossing 96
Good lock to everyone

GOLD Strong Bullish Bias! Buy!
Hello,Traders!
GOLD price has reclaimed a key horizontal demand zone after a clean liquidity sweep below prior lows. Strong displacement to the upside signals smart money accumulation, with structure favoring continuation toward the next buy-side liquidity pool. Time Frame 12H.
Buy!
Comment and subscribe to help us grow!
Check out other forecasts below too!
Disclosure: I am part of Trade Nation's Influencer program and receive a monthly fee for using their TradingView charts in my analysis.

SILVER FREE SIGNAL|SHORT|
✅SILVER is reacting inside a higher-timeframe supply zone after a strong impulsive push. This move shows clear buy-side liquidity capture, with displacement losing momentum. Expect a bearish rotation toward the discounted imbalance below.
—————————
Entry: 76.50$
Stop Loss: 78.12$
Take Profit: 74.00$
Time Frame: 2H
—————————
SHORT🔥
✅Like and subscribe to never miss a new idea!✅

NZDJPY – Bullish Momentum Building Toward ABC TargetNZDJPY is showing strong bullish structure on the 1H timeframe, supported by multiple confluences pointing toward continuation — with the final C-leg target still in play.
🧠 Trade Setup & Logic:
Bullish Ascending Channel: Price is moving within a larger bullish channel, supporting the overall long bias.
Bullish ABC Sequence: A clean ABC correction is underway, with price currently progressing through the BC leg and heading toward the projected C target.
BC Reaction Zone: This zone aligns with a bullish institutional order block , offering strong support and an ideal entry zone.
Descending Channel Break: Price broke out of a short-term descending channel structure, confirming a shift in momentum and trend continuation.
Target Confluence: The C target of the ABC sequence has not yet been reached. Interestingly, it sits inside a bearish order block , which may serve as a draw on liquidity and a potential reversal or reaction area.
🎯 Key Levels:
Entry Zone: Near BC zone / order block support (~90.3)
Target: 91.00 (ABC projected C-leg completion inside bearish OB)
Stop-Loss: Below 90.00 (invalidates bullish structure)
📚 Confluences Summary:
✅ Bullish ascending channel
✅ ABC bullish correction
✅ BC support zone + institutional order block
✅ Descending channel breakout
✅ Target not yet hit — potential continuation toward liquidity in bearish OB
💬 Do you wait for confirmation at BC zones, or enter on structure breaks? Drop your thoughts or questions below!

USDCAD(USDCAD | 30m — Educational Analysis)
This profile is dedicated to educational market analysis through the lens of institutional price behavior, focusing on market structure, liquidity, and supply & demand dynamics.
The chart above illustrates a recent bearish break of structure (BOS) on USDCAD, followed by a corrective phase where price is currently interacting beneath a defined supply zone — an area that previously initiated strong bearish displacement.
From an institutional perspective, such zones are not treated as signals or trade instructions, but rather as areas of interest where order flow, acceptance, or rejection can provide valuable information about market intent.
At this stage, price action remains reactive and conditional:
•Acceptance below supply maintains bearish structural context
•Rejection or consolidation offers insight into positioning and liquidity
•Any outcome is evaluated only after confirmation by price
•No assumptions are made in advance.
🧠 What This Channel Represents
This is a public trading journal, not a signal service.
Here you’ll find:
•Clean chart structure
•Liquidity-aware context
Supply & demand mapped from displacement
•Probability-based scenarios, not predictions
There are:
❌ No buy/sell calls
❌ No entries, stops, or targets
❌ No profit claims or guarantees
All content is shared strictly for educational and discussion purposes only and does not constitute financial advice
📌 Channel Philosophy
Price is the final authority.
•Structure defines bias.
•Liquidity reveals intent.
•Patience protects capital.
If you value discipline over hype and process over emotion, you’re welcome to follow, engage, and exchange perspectives.
Let price confirm the narrative.
⚠️ Disclaimer
This analysis reflects personal chart interpretation and market study.
It is not financial advice.
Always conduct your own research and risk assessment.

XAUUSD | Jan 2th 2026 | 2nd Idea | Buy the Dip Price reacted perfectly from the 4,315–4,300 demand zone after filling the 1H FVG.
Liquidity below lows is swept → buyers stepping in.
Plan:
📍 Buy Zone: 4,315 – 4,300
🎯 Targets: 4,400 → 4,480 → 4,530
❌ Invalidation: H1 close below 4,280
Bias remains bullish above 4,300.
A clean break & hold above 4,400 confirms continuation.
⚠️ SMC-based idea. Risk management required.
⚠️Caution: This is purely for educational purposes , trade at your own risk

XAUUSD Long: Demand Holds at 4,400 - Push Toward 4,500 in FocusHello traders! Here’s a clear technical breakdown of XAUUSD (2H) based on the current chart structure. XAUUSD previously moved within a steady bullish structure, respecting a rising trend line that supported price during multiple pullbacks. After a strong impulsive rally, Gold transitioned into a consolidation phase, forming a well-defined range that highlighted temporary balance between buyers and sellers. This range eventually resolved to the upside with a breakout, confirming bullish continuation and renewed buyer control.
Currently, XAUUSD is trading between the 4,400 Demand Zone and the 4,500 Supply Zone, with price holding above the rising trend line. This shows that bullish structure is still intact, but price is once again approaching a key resistance area where a reaction is likely.
My scenario: as long as XAUUSD holds above the 4,400 Demand Zone and respects the rising trend line, the broader bullish bias remains valid. A clean breakout and acceptance above the 4,500 Supply Zone would confirm continuation toward higher levels. However, if price is rejected from supply and breaks back below demand, this could trigger a deeper corrective move toward the trend line. For now, price is compressing between demand and supply, and a decisive move is expected soon. Manage your risk!

BTC PUMP EXPLAINED!As we continue pumping from here, we need to be VERY cautious. BTC specifically has been pumping ever since TRUMP sent for Venezuela. However, things can change drastically. We need to be ready whatever the outcome, but it could get bloody first.
There are A LOT of liquidations resting below, people are beginning to long the market, however, could this be a relief rally? Where are we heading from here? What are my current positions.
Watch the video and find out! :)
⚠️ Disclaimer:
I am not a financial advisor. The content shared on this channel is for educational and informational purposes only and should not be considered financial advice.
Trading and investing in cryptocurrency involve high risk — you could lose some, or all, of your money. Always do your own research and make sure you understand the risks before making any financial decisions.

AUDUSD LOCAL SHORT|
✅AUDUSD rallies into a clear premium PD array after sharp bullish displacement. Price is expected to mitigate supply, with smart money likely distributing before a bearish continuation toward sell-side liquidity below. Time Frame 2H.
SHORT🔥
✅Like and subscribe to never miss a new idea!✅
