BTCUSDT: Buyers Regain Control — $96,000 in FocusHello everyone, here is my breakdown of the current BTCUSDT setup.
Market Analysis
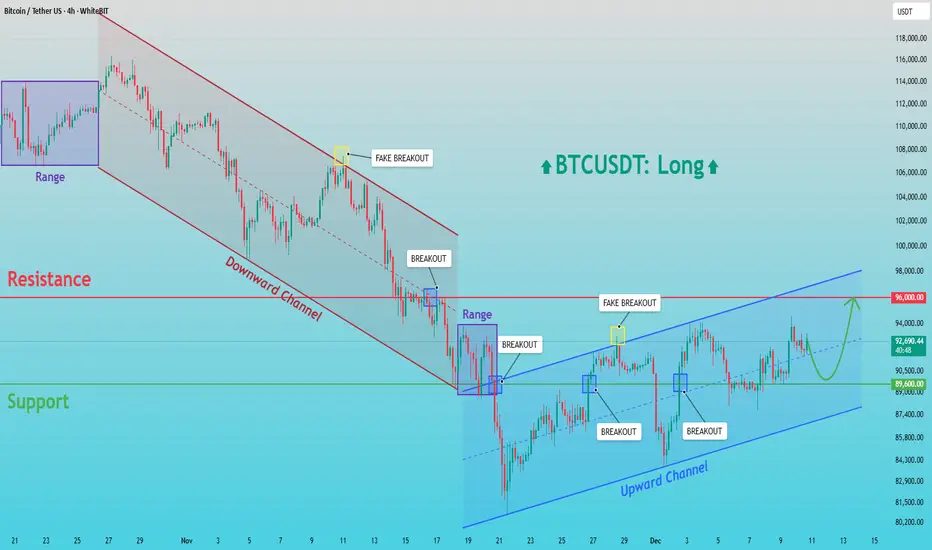
Bitcoin is transitioning from a broader bearish phase into a developing bullish structure. After a prolonged decline inside a well-defined downward channel, BTC formed a base near the $89,600 support zone, where strong buyer interest appeared. Multiple breakouts and fake breakouts around this level confirmed accumulation and growing bullish pressure. Following this reversal, price broke out of the bearish channel and entered a new ascending channel, forming higher highs and higher lows.
Currently, BTCUSDT is consolidating inside this upward structure and trading below the key $96,000 resistance, which remains the major obstacle for buyers. Several false breakouts near this resistance indicate that sellers are still active in this area. However, as long as price holds above the $89,600 support, the bullish structure remains valid and buyers stay in control.
My Scenario & Strategy
My scenario is bullish as long as BTCUSDT stays above the $89,600 support zone and continues to respect the ascending channel structure. I expect the price to gradually build momentum and attempt a retest of the $96,000 resistance. A clean and confident breakout above this level would confirm further upside continuation and open the way for higher targets.
However, if the price fails to break $96,000 and shows strong rejection, a short-term pullback toward the lower channel support may occur. For now, the market favors buyers, with $96,000 as the key upside objective.
That's the setup I'm tracking. Thank you for your attention, and always manage your risk.
Support and Resistance
SPX500 | Bulls Target 6957 as Breadth Improves Beyond AISPX500 – Technical Overview
The S&P 500 has reached a new record high, notably without support from AI-related stocks.
Despite underwhelming earnings from Oracle and Broadcom, the broader market continued to rally—an encouraging sign that sector leadership may be broadening rather than relying solely on AI momentum.
Technical Analysis
SPX500 maintains a bullish momentum while trading above 6873–6888, with upside targets at:
→ 6918
→ 6957
→ 6991
A continuation toward 6957 is favored as long as price holds above 6888.
However, a 1H close below 6873 will signal a bearish correction, opening the path toward:
→ 6852
→ 6815
Further downside pressure may extend the move into the 6771 support zone if risk sentiment weakens.
Pivot Line: 6888
Resistance: 6918 · 6957 · 6991
Support: 6852 · 6815 · 6771

SNDK: at macro resistance Price broke out through the resistance zone highlighted in the September update and continued to show strong upside momentum. However, the trend structure now appears substantially extended at current levels.
As long as the price remains below the 207–225 resistance zone, I expect selling pressure to start building, potentially leading to a pullback toward the 130–100 support area.
Chart:
Previously:
On resistance level (Sep 26):
Chart:
www.tradingview.com

AVGO: at the macro resistance zone Although the initial immediately bullish January setup failed to follow through (see idea from Jan'25) — with price breaking local support and sliding deeper into a complex corrective structure — the broader macro trend structure may have effectively fulfilled itself after reaching major macro resistance levels built since the May bull run.
Chart (Weekly):
There is still not enough confirmation that a macro top is in. The first signs would be price starting to close below the 21DEMA and 50DMA, forming a sequence of lower highs along with bearish EMA convergence (similar to the February ’25 structure).
For now the key question is whether the negative post-market reaction to strong earnings and positive guidance will sustain. If selling pressure persists and price begins to decisively close below the 21EMA, that would increase the odds of a developing reversal. Otherwise, continued dip-buying may push price toward the upper boundary of the macro resistance box near 445.
Previously:
On a bullish macro structure (Jan'25):
On macro resistance zone (Sep 5 and 24):
www.tradingview.com
and
www.tradingview.com
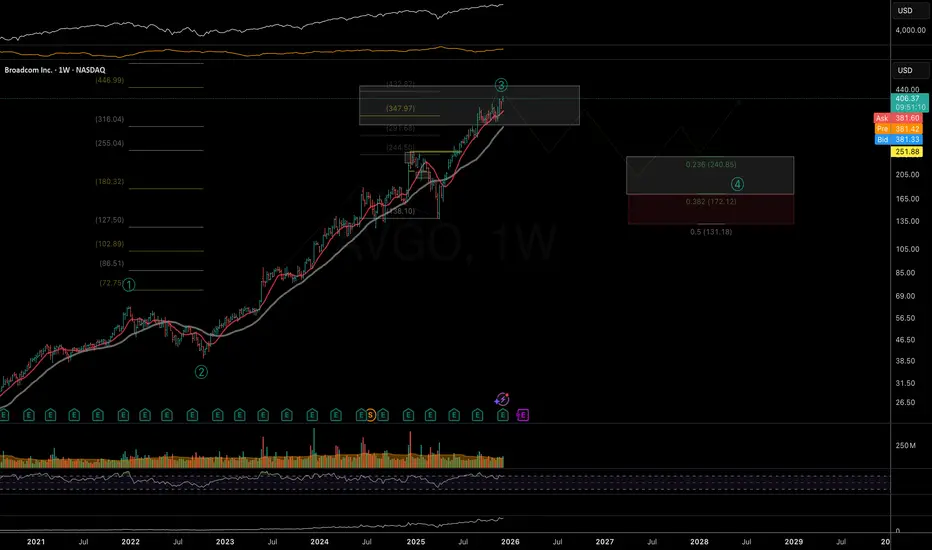
AVGO: mid-term trend structure If price is to hold above 209-198 area of support, next resistance zones are: 287-303 and 320-330-360.
Macro trend structure also assumes higher targets for the uptrend since 2022 bottom (Monthly):
Thank you for your attention!

Dow Jones: Potential Explosive Move!Hey Traders,
In today's trading session we are monitoring US30 (Dow Jones) for a buying opportunity around the 48,400 zone. The index is trading in a strong uptrend and is currently in a correction phase, approaching the trend area at 48,400 support and resistance.
Trade safe,
Joe.

30m XAUUSD Gold is at a strong buy zone $4,176-$4,184. Look for a bounce up to $4,213 first, then $4,233. Stop below $4,176.
Easy, clear, trade smart.
Caution : This is not a financial advice

XAUUSD 10Dec 2025 🔥 Gold (XAUUSD) Trade Plans | 30M Chart
- Pullback Short (Scalp):
Sell 4,212-4,219 | SL: 4,220 | TP: 4,190
- Main Long (Distribution): Buy 4,181-4,172 | SL: 4,163 | TP: 4,260
Smart Money Concepts: Targeting pullback into demand zone, then bullish distribution! 🚀
_Not financial advice._
#Gold #SMC #Trading"

Bullish BOS Breakout, Watching Reaction at OB & Sell-Side Liquid◆ Market Context (H2)
Price has just broken a bullish BOS and closed above the previous equilibrium zone, confirming buyers are in control. After the strong impulse, the market has entered a rebalancing phase, where a short-term pullback often appears before continuation or a liquidity sweep to the upside.
◆ SMC & Price Action
• Bullish structure confirmed by consecutive BOS following the prior CHoCH.
• The 4,274 OB is the nearest demand zone where buyers previously reacted.
• Above lies sell-side liquidity at 4,355, with a further extension toward 4,408 — a potential distribution or short-term reversal zone.
• Price is currently in premium, so patience is preferred over FOMO entries.
◆ Key Levels
• Resistance / Liquidity: 4,355 → 4,408
• Support OB: 4,274
• Deeper OB: 4,217
◆ Trading Scenarios
➤ Scenario A – Pullback BUY (Primary)
• Wait for a pullback into OB 4,274
• Conditions: structure holds (no break of recent lows), bullish reaction appears
• Targets:
▪ 4,319
▪ 4,355 (Liquidity Sell)
▪ Extension: 4,408
➤ Scenario B – Break & Continue
• If price holds above 4,319 with bullish closes
• Monitor reactions at 4,355 for partial profit-taking
• Avoid chasing price in premium zones
➤ Scenario C – Deeper Pullback
• If OB 4,274 is clearly broken
• Price may retrace to OB 4,217 for re-accumulation
• Only consider BUY after a fresh bullish CHoCH
◆ Summary
• Primary trend: Bullish (BOS confirmed)
• Priority: Buy pullbacks, avoid FOMO
• Key decision zone: OB 4,274
• Upside liquidity targets: 4,355 → 4,408

EURUSD EURUSD had a bounce up early morning and got rejected by Friday highs a little later.
EURUSD finding some resistance in the upper green zone.
Looking at how EURUSD reacts and will try to anticipate a move!
Let me know what you think!
Stay safe out there and do your own due diligence, this is not investment advise!

EURGBP | Move down Expecting a move down from this zone to continue the downtrend.
Price has been rejected from the red zone multiple times and wee see a reaction now.
Let me know what you think!
Stay safe out there and do your own due diligence, this is not investment advise!

ORDI Weekly AnalysisORDI is currently trading at a major higher timeframe support zone after a prolonged downtrend.
This level has acted as support multiple times in the past, making it an important area to monitor for potential price reactions.
Market structure remains bearish on the higher timeframe, but downside momentum is slowing down and price is starting to consolidate.
Key levels to watch:
Support at the current range low
Resistance at the previous breakdown level
Higher timeframe resistance above, as marked on the chart
If price holds support and manages to reclaim resistance, continuation toward the next resistance levels becomes possible.
If price fails to hold support, consolidation or further downside cannot be ruled out.
This analysis is based on market structure and support and resistance levels.
No predictions, only scenarios.
All levels and scenarios are clearly marked on the chart.
Questions or comments are welcome in the comments below.
MrC

GOLD | Short ideaGold tapped into the previous monthly high and since then been trending down.
Now it is at a key level where I expect Gold to reject and make a move down.
A reaction has been there already, it is very volatile so tread carefully.
Let me know what your analysis is!
Stay safe out there and do your own due diligence, this is not investment advise!

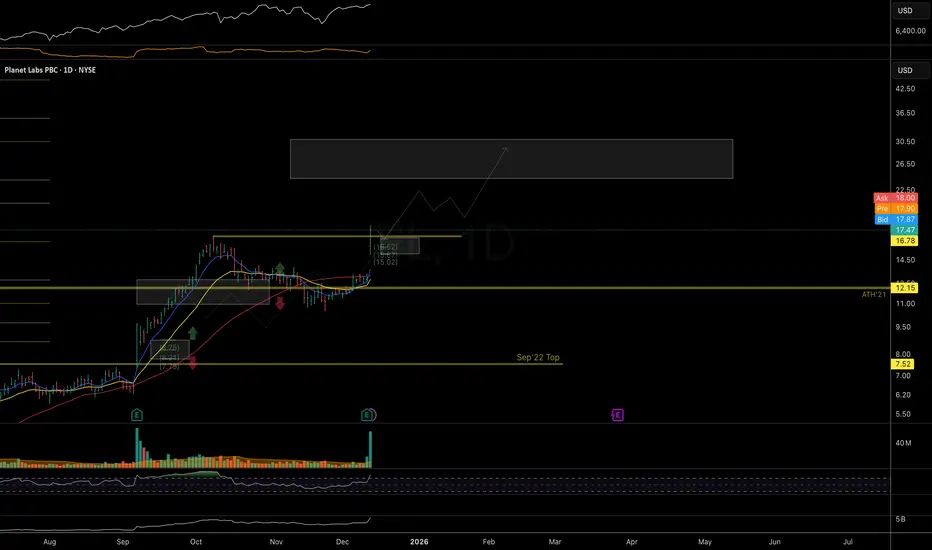
PL: room to follow-through Price continues to follow the macro bullish trend structure outlined in the September updates. Watching for further follow-through into the next 24–30 resistance zone.
The earnings gap may offer a delayed-reaction setup if we see a constructive, low-volume pullback in the coming days - ideally with price holding above the 15 local support.
Chart:
Macro view (Weekly):
Previously:
• On macro bullish-trend structure (Sep 14):
www.tradingview.com
• On resistance zone and pullback (Sep 26):
www.tradingview.com

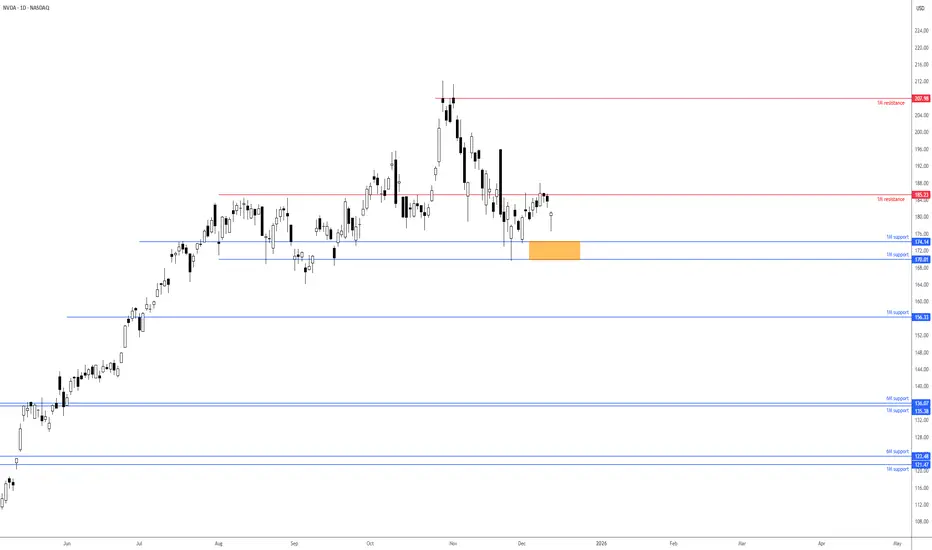
NVDA breakout will help determine near-term direction Shares of Nvidia took a hit during Thursday’s session, losing about 1.5%. Technically, the trend remains northbound, though near-term price action has shown a few lower lows and lower highs: early signs of a downtrend.
1M resistance recently made a show at US$185.23 and withstood a few upside attempts. 1M support is nearby between US$170.01 and US$174.14, with a break under here unbolting the door to another layer of 1M support from US$156.33. Alternatively, pushing above US$185.23 would help bolster the long-term trend, and potentially attract fresh buying to 1M resistance at US$207.98, closely shadowed by the all-time high of US$212.19.
Ultimately, the direction of travel for this Stock will depend on whether it breaks above resistance at US$185.23, encouraging buying, or below the support zone between US$170.01 and US$174.14, which could prompt further underperformance.
Written by the FP Markets Research Team
Bitcoin Price Update Clean Clear ExplanationBitcoin trading inside a wide consolidation zone, with price currently hovering around the mid-range near 90K Multiple supply and demand zones are highlighted, giving a clear picture of where strong buying or selling reactions may occur.
If Bitcoin holds above the current minor support and builds momentum, price may Push upward through the mid-range resistance retest higher supply zones between 93K / 94K then continue climbing toward the upper rejection zone shown in the chart this scenario represents a continuation of the bullish trend if buyers stay in control.
If the price fails to hold above the local support levels breakdown is expected toward the major support at 87K if this zone also fails, the chart projects a deeper drop into the heavy demand zone around 84K this represents a potential shift from consolidation to bearish retracement, where sellers regain strength.
If you found this analysis helpful free, free to leave a comments and share thanks.

GOLD (XAUUSD): To All-Time High
As I predicted earlier, Gold finally violated our current daily resistance
and set a new local higher high higher close with a confirmed bos.
We can expect a bullish continuation to a resistance based on
a current ATH now.
Goal - 4353
❤️Please, support my work with like, thank you!❤️
I am part of Trade Nation's Influencer program and receive a monthly fee for using their TradingView charts in my analysis.

Waiting for Premium Pullback Buy the Bullish Continuation1. Market Context & Structure (H1)
• After a prolonged consolidation phase, Gold has delivered a clear bullish BOS, breaking above the previous highs around 4,24x–4,25x.
• The current impulse originated from the EQL → OB 4,209 zone, confirming active buying flow and a shift into a short-term uptrend.
• Price is now trading above the Premium Zone at 4,265; any pullback into this area is considered a technical retracement within the bullish trend.
2. Key Technical Zones
• Main OB – Demand: around 4,209 → Origin of the current bullish leg; a strong BUY zone if price holds.
• Premium Pullback Buy Zone: 4,265 – 4,270 → First discount after BOS; priority area to look for BUY setups.
• Target 1 – Reaction Zone: 4,322 – 4,323 → Fibo 0.5–0.618 confluence; potential profit-taking / short-term sell reaction.
• Target 2 – Extension Zone: 4,366 – 4,367 (Fibo 1.272) → Bullish extension target and potential liquidity sweep zone.
3. Trading Scenarios
Main Scenario – Trend BUY at Premium Zone
• Wait for pullback to 4,265 – 4,270.
• Look for confirmation: long lower wicks, bullish engulfing, or bullish ChoCH on M15–H1.
• Execute BUY with trend continuation.
TP1: 4,322
TP2: 4,366
• Partial TP at TP1, move SL to BE, hold remainder to TP2.
• Invalidation: H1 close below 4,258 → pause BUY scenario.
Scenario 2 – Deep BUY at OB 4,209
• If price breaks Premium decisively and drops to OB 4,209, do not catch a falling knife.
• Wait for strong bullish reaction and reversal structure (new HL, bullish ChoCH).
TP: 4,265 → 4,322
4. Risk Management Notes
• Avoid FOMO BUY at highs after strong bullish candles.
• SELL setups are only short-term reactions, not the main bias.
• Bias remains BUY on dips as long as H1 holds above 4,209.

CHF-JPY Bullish Breakout! Buy!
Hello,Traders!
CHFJPY breaks above a well-defined supply zone with strong bullish displacement, confirming a shift in market structure. The breakout signals smart money strength, with upside liquidity now exposed. A brief pullback may occur, but continuation toward higher targets remains favoured. Time Frame 4H.
Buy!
Comment and subscribe to help us grow!
Check out other forecasts below too!
Disclosure: I am part of Trade Nation's Influencer program and receive a monthly fee for using their TradingView charts in my analysis.

Nifty levels - Dec 15, 2205Nifty support and resistance levels are valuable tools for making informed trading decisions, specifically when combined with the analysis of 5-minute timeframe candlesticks and VWAP. By closely monitoring these levels and observing the price movements within this timeframe, traders can enhance the accuracy of their entry and exit points. It is important to bear in mind that support and resistance levels are not fixed, and they can change over time as market conditions evolve.
The dashed lines on the chart indicate the reaction levels, serving as additional points of significance to consider. Furthermore, take note of the response at the levels of the High, Low, and Close values from the day prior.
We hope you find this information beneficial in your trading endeavors.
* If you found the idea appealing, kindly tap the Boost icon located below the chart. We encourage you to share your thoughts and comments regarding it.
Wishing you success in your trading activities!

GBPCHF LOCAL LONG|
✅GBPCHF is approaching a key ICT demand zone after a corrective pullback. Price is likely to retest demand to mitigate imbalance and fill inefficiency before bullish continuation. Expect renewed displacement toward buy-side liquidity once demand is respected. Time Frame 6H.
LONG🚀
✅Like and subscribe to never miss a new idea!✅

BankNifty levels - Dec 15, 2025Utilizing the support and resistance levels of BankNifty, along with the 5-minute timeframe candlesticks and VWAP, can enhance the precision of trade entries and exits on or near these levels. It is crucial to recognize that these levels are not static, and they undergo alterations as market dynamics evolve.
The dashed lines on the chart indicate the reaction levels, serving as additional points of significance. Furthermore, take note of the response at the levels of the High, Low, and Close values from the day prior.
We trust that this information proves valuable to you.
* If you found the idea appealing, kindly tap the Boost icon located below the chart. We encourage you to share your thoughts and comments regarding it.
Wishing you successful trading endeavors!
