SOLUSDT Looking BearishHi
SOLUSDT has the potential to pulse up and break the 129.83 level. The break of the 129.83 will need to be clear, a clean breakout, and the we have two potential target support areas for a bias of 122.49.
Happy Trading,
K.
This is not financial advice
Support and Resistance

Copper continues to grow!The two price targets I envision on the chart, which indicate continued upward swings, are the powerful candles of the last two weeks that have made it easier to reach these targets in the medium term, and other than time, which requires more patience, I don't see any reason why we won't reach the desired target!


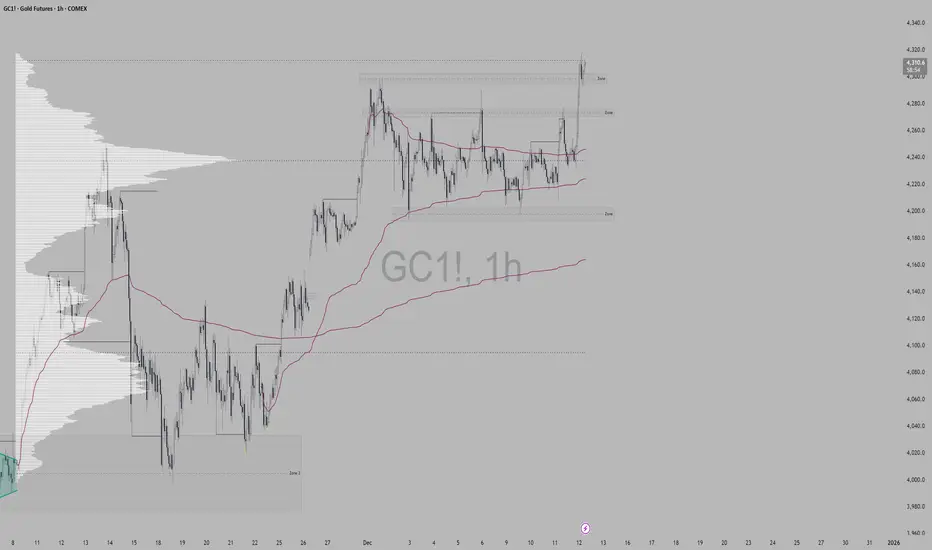
GOLD (XAU/USD): Strong Bullish Signal📈Gold has been in a significant consolidation phase since October, with the market remaining within a broad horizontal range on a daily chart.
Given the recent bullish movement, Gold now appears to be strongly bullish.
A breakout above the resistance level of this range suggests the completion of a bullish accumulation period.
This development opens up the potential for further growth.
The next resistance level to observe is 4,300.

GIFTNIFTY IntraSwing Levels For 12th Dec '25Choppy session as of Now as per OI data.
Trade Carefully.
[ Level Interpretation / description:
L#1: If the candle crossed & stays above the “Buy Gen”, it is treated / considered as Bullish bias.
L#2: Possibility / Probability of REVERSAL near RLB#1 & UBTgt
L#3: If the candle stays above “Sell Gen” but below “Buy Gen”, it is treated / considered as Sidewise. Aggressive Traders can take Long position near “Sell Gen” either retesting or crossed from Below & vice-versa i.e. can take Short position near “Buy Gen” either retesting or crossed downward from Above.
L#4: If the candle crossed & stays below the “Sell Gen”, it is treated / considered a Bearish bias.
L#5: Possibility / Probability of REVERSAL near RLS#1 & USTgt
HZB (Buy side) & HZS (Sell side) => Hurdle Zone,
*** Specialty of “HZB#1, HZB#2 HZS#1 & HZS#2” is Sidewise (behaviour in Nature)
Rest Plotted and Mentioned on Chart
Color code Used:
Green =. Positive bias.
Red =. Negative bias.
RED in Between Green means Trend Finder / Momentum Change
/ CYCLE Change and Vice Versa.
Notice One thing: HOW LEVELS are Working.
Use any Momentum Indicator / Oscillator or as you "USED to" to Take entry.
⚠️ DISCLAIMER:
The information, views, and ideas shared here are purely for educational and informational purposes only. They are not intended as investment advice or a recommendation to buy, sell, or hold any financial instruments. I am not a SEBI-registered financial adviser.
Trading and investing in the stock market involves risk, and you should do your own research and analysis. You are solely responsible for any decisions made based on this research.
"As HARD EARNED MONEY IS YOUR's, So DECISION SHOULD HAVE TO BE YOUR's".
Do comment if Helpful .
Do Comment for In depth Analysis.
Follow notification about periodical View

XAUUSD: Bulls Reach Full Targets; Start SellingToday the bullish momentum remained very strong. First, the market reached our initial target at 4228–4232, then moved up to 4250–4260, and eventually even surged to 4285, completing the final 4280 objective.
However, after reaching this area, the strength of the bulls clearly began to slow. On the one hand, we are approaching the market close, and trading activity is naturally fading. On the other hand, today’s rise has already been substantial, and gold is approaching the key 4300 level, where bullish pressure becomes significant.
Therefore, I plan to begin positioning a base short position. If prices continue to rise into the 4290–4310 zone, I will continue adding to the position to capture a pullback opportunity. The initial target is around 4260, followed by 4250. If the price extends above 4300, these targets will be adjusted upward accordingly, for example toward the 4270 area.

EUR/JPY: More Growth Ahead!The 📈EURJPY pair successfully breached a notable daily/intraday resistance cluster, confirming a bullish Break of Structure.
Today, we are observing a retest of the previously broken structure, accompanied by subsequent consolidation.
A bullish violation of its intraday resistance would provide further indication of upward momentum.
I anticipate that the pair will continue to ascend and reach the 183.20 level in the near future.

BTC CME GAP (4H)Bitcoin has a CME gap in the $89,805 – $89,425 range
These gaps are usually filled before the price makes its next move.
Let’s see what happens.
For risk management, please don't forget stop loss and capital management
Comment if you have any questions
Thank You

Market Accumulating Liquidity, Two Clear Scenarios for TodayGold continues to move within a bullish structure, but short-term order flow shows distribution inside the OBS Sell Zone 4,236. Price is currently trapped in the middle of the range, suggesting the market may need a liquidity sweep before choosing its next direction.
Fundamentally, expectations of a dovish Fed still support gold on deeper pullbacks — but intraday, the two MMF flow setups are extremely clear.
📊 Technical Outlook (MMF Flow – H1)
🔸 OBS SELL ZONE: 4,236
• Strong reaction on first touch → supply confirmed
• Downtrend line converges here → high probability of liquidity traps
🔸 OBS BUY ZONE: 4,197
• First key demand zone below
• Aligned with channel support → likely bullish reaction
🔸 Sell-side Liquidity: 4,181
• If price sweeps this area → ideal reversal point
🔸 Premium SELL Reaction Zone: 4,284
• If gold expands upward → priority area for distribution / short-term correction
🎯 Two Main MMF Scenarios
Scenario 1 – SELL reaction → BUY trend continuation
• Price retests 4,236
• Bearish reaction → pushes price toward 4,197 – 4,181
• Reversal signal appears
• Targets: 4,236 → 4,284
➡️ This is the cleanest play following today’s liquidity flow.
Scenario 2 – Direct bullish expansion
• Price breaks and closes above 4,236
• Retests this zone
• Expands toward 4,284
➡️ Requires strong bullish momentum — no confirmation, no trade.
🧭 MMF Intraday Bias
• Bullish as long as price holds above 4,197
• Neutral → Bearish only if price closes below 4,181 (failed liquidity sweep)
The market is preparing for a breakout — let liquidity do its job before choosing direction.

NZDUSD: Bullish Order Flow For Two weeks Now! Buy It!Welcome back to the Weekly Forex Forecast for the week of Dec. 8 - 15th.
In this video, we will analyze the following FX market: NZDUSD
NZDUSD is bearish on the HTFs, but has been bullish the last two weeks. Bullish enough to form a change in the state of delivery! The move indicates bullish order flow entering the market!
Wait for the market to confirm its bullish intent with the +FVG it is currently sitting in, and buy it.
Enjoy!
May profits be upon you.
Leave any questions or comments in the comment section.
I appreciate any feedback from my viewers!
Like and/or subscribe if you want more accurate analysis.
Thank you so much!
Disclaimer:
I do not provide personal investment advice and I am not a qualified licensed investment advisor.
All information found here, including any ideas, opinions, views, predictions, forecasts, commentaries, suggestions, expressed or implied herein, are for informational, entertainment or educational purposes only and should not be construed as personal investment advice. While the information provided is believed to be accurate, it may include errors or inaccuracies.
I will not and cannot be held liable for any actions you take as a result of anything you read here.
Conduct your own due diligence, or consult a licensed financial advisor or broker before making any and all investment decisions. Any investments, trades, speculations, or decisions made on the basis of any information found on this channel, expressed or implied herein, are committed at your own risk, financial or otherwise.

EURUSD: Bullish! Wait For The Pullback Before Buying!Welcome back to the Weekly Forex Forecast for the week of Dec 8 - 15th.
The EURUSD has been bullish for 2 weeks, and reached buy side liquidity. A pullback seems to be in order.
Wait for the pullback to sweep sell side LQ, then take safer buys.
Enjoy!
May profits be upon you.
Leave any questions or comments in the comment section.
I appreciate any feedback from my viewers!
Like and/or subscribe if you want more accurate analysis.
Thank you so much!
Disclaimer:
I do not provide personal investment advice and I am not a qualified licensed investment advisor.
All information found here, including any ideas, opinions, views, predictions, forecasts, commentaries, suggestions, expressed or implied herein, are for informational, entertainment or educational purposes only and should not be construed as personal investment advice. While the information provided is believed to be accurate, it may include errors or inaccuracies.
I will not and cannot be held liable for any actions you take as a result of anything you read here.
Conduct your own due diligence, or consult a licensed financial advisor or broker before making any and all investment decisions. Any investments, trades, speculations, or decisions made on the basis of any information found on this channel, expressed or implied herein, are committed at your own risk, financial or otherwise.

US Dollar: Bearish! Look To Sell it towards 98.56!Welcome back to the Weekly Forex Forecast for the week of Dec 8-15th.
In this video, we will analyze the following FX market: USD Dollar
The USD is currently bearish, sitting in a Daily -FVG. If the FVG holds, the sell off will continue from last week. Should the -FVG fail, then hold off on sells! A close above the -FVG will be a bullish indication.
Wed's FOMC will likely weaken the currency further, as institutions have seemingly baked in their bearish bets.
Enjoy!
May profits be upon you.
Leave any questions or comments in the comment section.
I appreciate any feedback from my viewers!
Disclaimer:
I do not provide personal investment advice and I am not a qualified licensed investment advisor.
All information found here, including any ideas, opinions, views, predictions, forecasts, commentaries, suggestions, expressed or implied herein, are for informational, entertainment or educational purposes only and should not be construed as personal investment advice. While the information provided is believed to be accurate, it may include errors or inaccuracies.
I will not and cannot be held liable for any actions you take as a result of anything you read here.
Conduct your own due diligence, or consult a licensed financial advisor or broker before making any and all investment decisions. Any investments, trades, speculations, or decisions made on the basis of any information found on this channel, expressed or implied herein, are committed at your own risk, financial or otherwise.

BTC accumulate shorts (WXY done)For the past weeks all BTC did was go down from 126k, from here we can hypothesize that we are on a wave to the downside and all move the upside are all corrective moves for another low to come.
We can see the W wave as an easy 5 subwave with X as 3 subwaves.
From here on there are 2 scenarios.
1. We are on the verge of the making of the huge wave 3 for a reversal of the trend
OR
2. Our Y wave ends with a truncated and we are ready for the next major wave to the downside.
Right now evidence show we are going for option 2. Why?
a.) Going into the orderflow, we have 25million longs TRAPPED on the high
b.) We have made a liquidity hunt on the last week's high.
c.) We tapped on the VAH of the last week of November
d.) All move to the high were made in a matter of minutes (a clear rejection)
The option 2 scenario will give more conviction if we lose
i.) 91,950 - pwVAH
ii.) 91,350 - pmPOC (MAJOR CONVICTION) if we lose this
All these idea will be defeated if we suddenly show strength here at the top
The only thing that I am to expect for my validation is a series of 4H closes above 93,600, it shows acceptance above value of the range
This idea is not made for a trade but as a guide to what to expect for the following days.

GOLD (XAUUSD): bullish-Neutral! Prepare To Buy!In this Weekly Market Forecast, we will analyze the Gold (XAUUSD) for the week of Dec. 8 - 15th.
Gold closed last week indecisive. It has been moving sideways inside a bullish FVG, that continues to act as support.
Prepare for a short term pullback.... and buy it.
Mindful that FOMC is Wednesday, and the USD is weakened with the expectation of a .25 rate cut.
Enjoy!
May profits be upon you.
Leave any questions or comments in the comment section.
I appreciate any feedback from my viewers!
Like and/or subscribe if you want more accurate analysis.
Thank you so much!
Disclaimer:
I do not provide personal investment advice and I am not a qualified licensed investment advisor.
All information found here, including any ideas, opinions, views, predictions, forecasts, commentaries, suggestions, expressed or implied herein, are for informational, entertainment or educational purposes only and should not be construed as personal investment advice. While the information provided is believed to be accurate, it may include errors or inaccuracies.
I will not and cannot be held liable for any actions you take as a result of anything you read here.
Conduct your own due diligence, or consult a licensed financial advisor or broker before making any and all investment decisions. Any investments, trades, speculations, or decisions made on the basis of any information found on this channel, expressed or implied herein, are committed at your own risk, financial or otherwise.

PENGU/USDT Breakout LongWhy: The 5m chart shows the price consolidating around 0.0112. The daily analysis suggests a "long target" higher up, but you are currently stuck in a choppy range. You need to wait for momentum to return.
Direction: LONG
The Trigger: Wait for a 5-minute candle to close ABOVE 0.0120. (This clears the local resistance).
Entry: ~0.0121.
Stop Loss: 0.0110 (Below current support).
Target: 0.0127 (Approx 5-6% move).

A SELLa sell at 4272-67, sl at 4282, tp1 at 4240 but it will be a good idea to hold it a bit, still bullish momentum is low, so we are likely to push down more.

Dax to the upside!Hi
on the 4h TF. Dax bounced strongly from the bottom to break a critical resistance level then went to the next resistance then broke through it to the upside and even bounced up from after it settled on with a pin bar 4H candle and that is the big view of the DAX based on the 4H TF.
3 TPs are there, however, if you accept and tolerate the bearish pullbacks on the journey to TP3, as long the last support level or (the above line) will not be broken by a 4H candle (closing price not by a wick) then TP3 will be your main and real target on DAX.
Fundamentally the next week will offer the Fed interest rate decision which has strong expectations of another rate cut! and may we see currently the preparation on the chart for that move!
Note:
Please do not share or copy my own work! It reflects my own vision and view to that index and it is advertised to not be taken as a legal advice for traders to follow, however, it is not more than an own opinion and analysis to be shared with you!
Good luck ;)

CRM watch $262-265: Major Fib zone Break should _POP_ off BOTTOMCRM trying to paint a bottom after getting destroyed.
Testing a well proven dual fib zone at $262.54-265.36
Zone includes Golden Genesis and a semi-major Covid.
.
See "Related Publications" for previous plots such as this EXACT BOTTOM CALL:
Hit BOOST and FOLLOW for more such PRECISE and TIMELY charts.
========================================================
.

GBP-USD Free Signal! Buy!
Hello,Traders!
GBPUSD taps deeply into a refined demand pocket, sweeping sell-side liquidity before shifting structure, signalling bullish displacement toward the next inefficiency above.
--------------------
Stop Loss: 1.3352
Take Profit: 1.3438
Entry: 1.3395
Time Frame: 2H
--------------------
Buy!
Comment and subscribe to help us grow!
Check out other forecasts below too!
Disclosure: I am part of Trade Nation's Influencer program and receive a monthly fee for using their TradingView charts in my analysis.

NATGAS BULLISH CORRECTION AHEAD|LONG|
✅NATGAS draws back into a discounted pocket after purging sell-side liquidity, with price now poised to rebalance toward the inefficiency left above the last impulsive leg. Time Frame 1D.
LONG🚀
✅Like and subscribe to never miss a new idea!✅

SNGP - Daily Demand Zone SNGP is trading right on its multi-month demand zone (114–116), where buyers have consistently stepped in. Price is compressing tightly near support while RSI forms higher lows → early sign of accumulation and a possible bullish reversal.
📌 Levels to Watch:
• Key Support: 114–116
• Breakout Level: 119.50–120
• Trend Support: 200 SMA
• Short-Term Barrier: 50 EMA
🎯 Targets: 125 → 130 → 135 → 140
SL: 113.50
📈 Outlook:
As long as the demand zone remains intact, SNGP has the potential to move towards 130+ after a clean break above 120. Setup remains valid unless price closes below 113.50.

Gold trending or mean revertingTrading near the upper zone may indicate a potential reversal or pullback toward efficiency levels.
ETH Broke Parallel Daily Channel - Retracement Complete?BINANCE:ETHUSDT has finally broken out of a bearish parallel channel after trading in it for over 2 months! ETH found support at the 0.618 fib level from the April low, which saw price surging from $1400 to $4900.
It will be interesting to see how long the current bullish rally continues for, since this could very well be the low before we start testing the all time highs of $5000!
