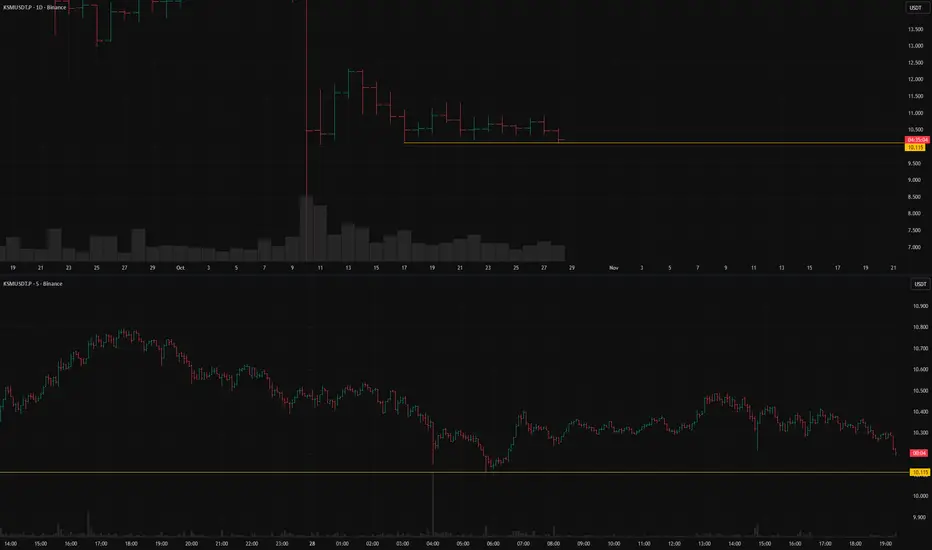
KSMUSDT.P: short setup from daily support at 10.115BINANCE:KSMUSDT.P remains in consolidation, clearly confirming the level — no false breakouts or sweeps, just consistent touches and short pullbacks. The asset has held this structure for nearly two weeks and will eventually break out. In my view, the likely scenario is a short below 10.115.
Today, the asset has already tested the level once and is gradually approaching it again. Maintaining low volatility during this approach will be important.
Key factors for this scenario:
Global & local trend alignment
Volatility contraction on approach
Prolonged consolidation
Was this analysis helpful? Leave your thoughts in the comments and follow to see more.
Support and Resistance
1:2 Risk Reward Buying USD CAD in bull channelSimple trade, buying USDCAD in bull channel at bottom of bull channel with RR of 2

Bitcoin Buy signal now near 111K lowWe are approaching a significant fundamental event—the release of key news—which introduces a high degree of short-term volatility risk. This event could trigger a sharp, downward price spike that may hit our stop-loss levels.
However, our technical analysis is currently generating a high-probability buy signal, independent of the upcoming news. The chart structure suggests substantial upside potential is developing.
Therefore, we are executing a calculated contrarian trade based on the technical setup. We are entering a long position here with a tightly defined stop-loss to strictly manage the elevated event-driven risk. The trade is structured to capitalize on the significant technical upside potential, offering a favorable risk-to-reward ratio should the bullish technical outcome materialize after the initial volatility subsides.
DISCLAIMER: ((trade based on your own decision))
<<press like👍 if you enjoy💚

SLP LAST CALLS for that +800% pump After a prolonged and exhaustive bear market characterized by deep, consistent monthly declines, NASDAQ:SLP is now trading at a level we identify as a historical price floor. Such severe and sustained downtrends often culminate in a state of maximum investor capitulation, which typically precedes a major trend reversal.
The asset is now fundamentally positioned for a significant mean reversion. From a technical perspective, the risk-to-reward profile at this juncture is exceptionally compelling. A recovery of +800% from these levels is not merely speculative; it aligns with a classical measured move target derived from the scale of the prior downtrend and would represent a natural recalibration toward the asset's historical mean.
All technical indicators suggest that the conditions are ripe for a powerful bullish reversal. A breakout above the nearest significant resistance level would be the confirming signal that this new upward impulse has commenced.
DISCLAIMER: ((trade based on your own decision))
<<press like👍 if you enjoy💚

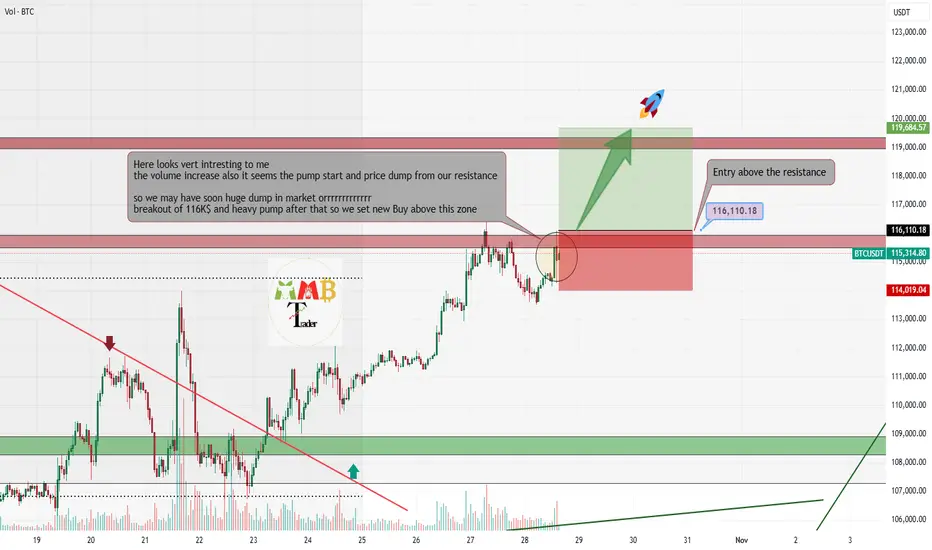
Bitcoin next hours can bring massive dump or Pump!!!The upcoming trading session is critical for Bitcoin as price approaches the significant $116,000 resistance zone. We are observing a notable increase in trading volume, which often serves as a precursor to a decisive price movement.
This volume surge ahead of a key level increases the probability of a bullish resolution. Our primary scenario anticipates a potential breakout. A confirmed daily close above $116,000, supported by sustained high volume, would validate this breakout and could initiate a strong bullish impulse.
In alignment with this thesis, we have strategically placed a buy-stop order above the $116,000 resistance. This order will only activate upon a valid and confirmed breakout, ensuring we are positioned for a potential continuation upward.
Conversely, as part of robust risk management, we must acknowledge the alternative scenario. Should the $116,000 resistance hold and provoke a bearish rejection, a breakdown below the $113,000 support level would become the expected outcome. This would signal a failure of the bullish attempt and likely trigger a short-term corrective move.
DISCLAIMER: ((trade based on your own decision))
<<press like👍 if you enjoy💚
SHIB the dead coin soon again will pump hardSHIB has been undergoing a prolonged period of consolidation, characterized by low volatility and a notable absence of significant bullish momentum over recent months. Such phases of compression and quiet price action often occur after a prior trending period and typically precede a new directional move.
Technical analysis suggests this accumulation phase may be nearing its conclusion. We are now monitoring for a potential catalyst that could trigger a robust bullish impulse. The anticipated outcome of such a move would be a decisive breakout, likely manifested as a series of strong bullish candles, propelling the asset toward the predefined technical targets established on the chart.
DISCLAIMER: ((trade based on your own decision))
<<press like👍 if you enjoy💚

Opendoor Technologies (OPEN) – Bulls Still Holding the Door OpenWhat a ride it’s been for OPEN!
Back in early July 2025, the stock finally broke above its 50-day MA, and that was the spark that started an incredible rally — all the way to a major resistance zone from June 2022.
Then, as always, the market had to test everyone’s patience — a shooting star reversal formed, price pulled back into the 0.382–0.5 Fibonacci zone, and built a solid double bottom.
Once that double bottom broke out around 13–14 August, it was rocket fuel — a massive +247% run until 11 September 2025! 🚀
Since that peak, OPEN has been cooling off — retracing with low volume and shaping a falling wedge, which usually hints at bullish continuation. The price even bounced at EMA-50 and printed a hammer candle, showing that buyers are still defending the trend.
As long as the price holds above $6.23 (hammer support), bulls are still in charge.
Break that level? Then the bears might finally get a turn.
Until then — the door’s still open for another breakout! 😉
Trade Idea 💡
Bullish scenario: Wait for a breakout above the falling wedge with volume — that’s your green light.
Support to watch: $6.23 (hammer low).
Stop loss: Just below that support.
Take profit: Trail as long as price stays above the MA-50 or aim for the $13.70 zone .

DraftKings Wave Analysis – 29 October 2025- DraftKings reversed from support area
- Likely to rise to resistance level 32.45
DraftKings recently reversed up from the support area between the long-term round support level 30.00 (which has been reversing the price from August of 2024) and the lower daily Bollinger Band.
The upward reversal from this support area created the daily Japanese candlesticks reversal pattern Hammer.
Given the strength of the support level 30.00, DraftKings can be expected to rise to the next resistance level 32.45 (former support from the start of October).

NVDA Wave Analysis – 29 October 2025- NVDA opened with the upward gap
- Likely to rise to resistance level 215.00
NVDA stock opened today with the sharp upward gap, which follows the earlier breakout of the resistance zone between the resistance levels 193.75 and 200.00.
The breakout of the these resistance levels accelerated the active impulse wave iii of the extended intermediate impulse sequence 5 from April
Given the overriding daily uptrend, NVDA can be expected to rise to the next resistance level 215.00 (target price for the completion of the active impulse wave iii).

COAI Buy/Long Setup (2H)First of all, you should know that this is a highly volatile and risky asset, so you need to enter the position in a way that if it hits the stop loss, you only lose about 1–2% of your capital, or even less | so manage your risk carefully.
The marked entry zones are considered strong supports for this coin, which could potentially lead to good profits. You should enter in spot, as this coin has wide zones.
Targets are shown on the chart.
For risk management, please don't forget stop loss and capital management
When we reach the first target, save some profit and then change the stop to entry
Comment if you have any questions
Thank You


Nifty Analysis EOD – October 29, 2025 – Wednesday🟢 Nifty Analysis EOD – October 29, 2025 – Wednesday 🔴
Bulls fight back, but 26,100 still guards the gate to new highs
🗞 Nifty Summary
Nifty opened 22 points higher at 25,982 and immediately tested the 26010 ~ 26020 resistance zone within the first 5 minutes. This zone once again acted as a strong supply area, forcing an early rejection and filling the opening gap.
Despite multiple attempts, Nifty couldn’t break through in the first hour. During this phase, a symmetrical triangle pattern took shape, and its breakout finally triggered a sharp move upward, pushing the index beyond both the 26010 ~ 26020 zone and the PDH level.
However, the bulls failed to hold above PDH, slipping back below where the same zone flipped into support. From there, with persistent effort, Nifty managed to reclaim the PDH and mark a new intraday high near 26085 ~ 26100, the next key resistance zone.
Around 1:10–1:15 PM, heavy volume spikes were noted — particularly on ITM option strikes — signaling a fierce tug-of-war between buyers and sellers. Price consolidated in this area and created a false breakout, eventually sliding back to retest PDH and the 26010 ~ 26020 zone.
By the closing bell, Nifty settled at 26,068.30, posting a 102.90-point gain — a healthy positive finish despite intraday turbulence.
Yesterday’s note had warned about false breakouts, which proved useful today. Up to 13:40, Nifty moved cleanly along a trendline, but once it broke, bias turned unclear — signaling traders to step back. Those who detached after the early profit phase likely preserved gains and avoided the afternoon whipsaws.
Going ahead, 26010 ~ 26020 must hold as support to keep bullish momentum intact. A breakout above 26,100 could open the door toward 26,220, 26,280, and possibly a new all-time high (ATH) soon.
🛡 5 Min Intraday Chart with Levels
🛡 Intraday Walk
Gap-up open of 22 pts → early rejection at 26010 ~ 26020.
Gap filled → forms symmetrical triangle.
Breakout triggers sharp rally → crosses PDH, hits 26085 ~ 26100.
Fakeout at highs → slides back below PDH to support.
Afternoon session volatile, strong volumes between 1:00–1:15 PM.
Index rebounds again, closes strong near 26068.
📉 Daily Time Frame Chart with Intraday Levels
🕯 Daily Candle Breakdown
Open: 25,982.00
High: 26,097.85
Low: 25,960.30
Close: 26,053.90
Change: +117.70 (+0.45%)
🏗️ Structure Breakdown
Type: Bullish candle with small lower shadow and moderate upper wick.
Range (High–Low): 137.55 pts → steady intraday movement.
Body: ≈ 71.9 pts → consistent buying strength.
Upper Wick: ≈ 43.95 pts
Lower Wick: ≈ 21.70 pts
📚 Interpretation
The session opened flat, briefly dipped below 25,960, and then trended higher. Buyers maintained firm control through the day, though some supply was visible near 26,100. The close near the upper end of the range confirms bullish continuation.
🕯Candle Type
Bullish Continuation Candle (Rising Marubozu variant)
Indicates renewed buying interest following a brief pause in momentum (after previous spinning top).
🛡 5 Min Intraday Chart
⚔️ Gladiator Strategy Update
ATR: 202.26
IB Range: 64.75 → Medium
Market Structure: Balanced
Trade Highlights:
10:10 – Long Trade → Target Achieved (R:R 1:2.45)
12:10 – Long Trade → Target Achieved (R:R 1:1.36)
13:30 – Long Trade → SL Hit
📌 What’s Next? / Bias Direction
Bias: Bullish continuation with cautious optimism.
Holding 26,010–26,020 keeps the trend intact;
break above 26,100 can extend the rally toward 26,220+.
📌 Support & Resistance Levels
Resistance Zones:
25996
26010 ~ 26020
26085 ~ 26100
Support Zones:
25865
25828
25790
25725 ~ 25715
💡 Final Thoughts
“Momentum rewards patience — not prediction.”
Nifty is showing healthy consolidation beneath resistance, and the strength of the last two sessions indicates buyers are still in charge. One decisive breakout above 26,100 could set the tone for the next leg higher.
✏️ Disclaimer
This is just my personal viewpoint. Always consult your financial advisor before taking any action.

Nifty Analysis EOD – October 28, 2025 – Tuesday🟢 Nifty Analysis EOD – October 28, 2025 – Tuesday 🔴
Volatility takes the driver’s seat — indecision candle hints at short-term pause
🗞 Nifty Summary
Nifty opened 44 points gap down at 25,930 and immediately formed OL (Open = Low), sparking an upward run that filled the gap and even crossed the previous day’s high, breaching the critical resistance zone of 26,010 ~ 26,020.
However, the breakout turned false, as Nifty failed to hold above and slipped sharply below the open, creating a fake PDH breakout scenario. Post-IB breakdown, the index found footing around S1 and the 25,865 support zone, but the bounce stalled near 25,900, which flipped into resistance and pushed Nifty down toward the PDL.
At the PDL, a double-bottom pattern emerged, triggering a strong rally toward 25,944–25,955. Yet, this zone, previously a support area, turned into resistance (polarity flip), and multiple failed breakout attempts forced bulls to retreat once more.
The last hour turned chaotic — a volatile battle around PDL with several fakeouts kept traders guessing. Around 2:50 PM, sudden expiry adjustments or short covering lifted Nifty sharply back above the day’s consolidation zone, closing near the PDC.
It was a wild roller-coaster session full of opportunities, but the volatility tested traders’ discipline. The long shadows on the 5-min candles perfectly captured the tug-of-war between buyers and sellers.
Despite the action, the day ended marginally negative, forming an indecisive structure where both sides remain active. The next session will be decisive — a breakout and sustainability on either side will dictate direction; otherwise, expect range-bound consolidation.
Today’s candle engulfed the previous day’s range, often a prelude to fake breakouts, so caution is key for breakout traders.
🛡 5 Min Intraday Chart with Levels
🛡 Intraday Walk
Gap-down open (44 pts) at 25,930 → forms OL and surges upward.
Fills the gap and crosses PDH → false breakout above 26,020.
Sharp reversal → IB and open-level breakdown.
Finds support near 25,865 (S1) → bounces to 25,900, flips to resistance.
Tests PDL, forms double bottom → rally to 25,944–25,955.
Multiple fake breakouts → bulls fade.
Wild expiry adjustment lifts price near PDC into the close.
📉 Daily Time Frame Chart with Intraday Levels
🕯 Daily Candle Breakdown
Open: 25,939.95
High: 26,041.70
Low: 25,810.05
Close: 25,936.20
Change: −29.85 (−0.11%)
🏗️ Structure Breakdown
Type: Small red candle with long wicks on both sides.
Range (High–Low): 231.65 pts → wide volatility.
Body: 3.75 pts → nearly neutral body.
Upper Wick: ~105.50 pts
Lower Wick: ~126.15 pts
📚 Interpretation
Market opened below Monday’s close → tested 26,041 (fresh high) but failed to hold.
Sharp selloff followed by a rebound → indecision throughout the day.
Closing near open = tug-of-war between bulls & bears → neutral sentiment.
🕯Candle Type
Spinning Top / Neutral Doji-like
Appears after a strong bullish run → hints at short-term exhaustion or consolidation phase.
🛡 5 Min Intraday Chart
⚔️ Gladiator Strategy Update
ATR: 206.77
IB Range: 112.05 → Medium
Market Structure: Balanced
Trade Highlights:
09:45 – Short Trade → Target Achieved (R:R 1:2.17)
10:05 – Short Trade → Target Achieved (R:R 1:1.49)
12:15 – Long Trade → Target Achieved (R:R 1:2.67)
📌 What’s Next? / Bias Direction
Bias: Neutral → Awaiting breakout
Expect volatility to persist within 25,800–26,050.
Break and sustain above 26,050 = bullish continuation;
Drop below 25,800 = short-term pullback likely.
📌 Support & Resistance Levels
Resistance Zones:
25996
26010 ~ 26020
26085 ~ 26100
Support Zones:
25865
25828
25790
25725 ~ 25715
💡 Final Thoughts
“Indecision is not weakness — it’s the market’s way of asking who’s more patient.”
After a strong run, Nifty pauses for breath. The next session will reveal whether this was just a pit stop or the start of a new short-term consolidation phase.
✏️ Disclaimer
This is just my personal viewpoint. Always consult your financial advisor before taking any action.

Trump Coin Wave Analysis – 29 October 2025
- Trump Coin broke resistance area
- Likely to rise to resistance level 9.55
Trump Coin recently broke the resistance area between the round resistance level 8.0000 (which stopped the previous wave iv, former strong support from August) and the 61.8% Fibonacci correction of the downward impulse from July.
The breakout of this resistance zone follows the earlier breakout of the two resistance trendlines from July and May.
Given the strongly bullish sentiment seen today, Trump Coin can be expected to rise to the next resistance level 9.55 (which has been reversing the price from August).

Nasdaq-100 Wave Analysis – 29 October 2025
- Nasdaq-100 broke resistance area
- Likely to rise to resistance level 27000.00
Nasdaq-100 index recently broke the resistance area between the resistance level 26000.00 and the resistance trendline of the extended daily up channel from May.
The breakout of this resistance area accelerated the active short-term impulse wave iii of the impulse wave 5 from the start of Septembers.
Given the strong daily uptrend and rising daily Momentum, Nasdaq-100 index can be expected to rise to the next resistance level 27000.00 (target price for the completion of the active impulse wave iii).

MYROUSDT.P - swing opportunities formingBINANCE:MYROUSDT.P Nice swing opportunities forming up. This might take weeks to play out but profits are hefty even with SPOT.
Notice: In case markets turn very bullish we don't get that low so pay attention to Easy Algo's TDI X indicator (oscillator) to make pivot reversal 50% level and Stoch RSI reset.

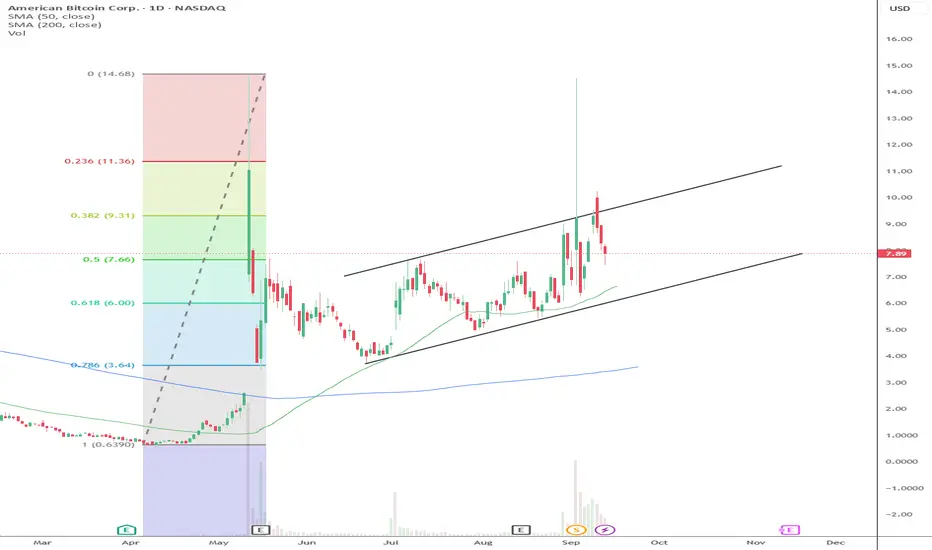
Too soon... Pump and Dump... Long Term Hold...ABTC has fluctuated highs and lows, where is the floor, how high can this go with time. I did buy under $7 and am going to hold for a while. My overall concensus is bullish simply due to my belief that Bitcoin will continually move higher and higher.
I have no timeframe on selling, this is more of a Buffet style, buy and hold forever.
I am not a trader and have no professional experience.
Solana – Saucer Pattern & Key Resistance in FocusSolana is starting to stand out with notable relative strength versus both Bitcoin and Ethereum, and it's catching my attention this week.
✅ Key Support Holding:
Price recently held firm at the $185–$190 support zone, bouncing with strength and attempting to establish a higher low. If this level holds, it would further confirm the uptrend in place since April.
📉 Corrective Phase Since September:
Despite the pullback, the larger trend structure remains bullish. A break above the September high is still needed to confirm trend continuation.
🔵 Multi-Month Saucer Formation:
A rounded base is developing on the daily chart—a classic saucer bottom. If confirmed, this pattern points to major upside potential, with a projected move possibly targeting $500 over time.
⚠️ Watch This Zone Closely:
The $250–$260 resistance area is the key overhead level to clear. A decisive breakout here could trigger a strong rally and confirm the saucer breakout.
📌 Summary:
Solana is showing resilience, building a bullish structure, and forming a significant base. If momentum builds above $260, bulls may take control in a big way.

CAT watch $586-591: Dual Fib resistance that may give a DIP buyCAT got a nice boost from latest earnings report.
It spiked into a Dual Fib zone at $586.82-591.90
Look for a Break-n-Retest or Dip-to-Fib to buy.

DowJones (DJI) IntraSwing Levels for 29th OCT 2025🚀 "Future Levels ( Ticker:MYM1! -CBOT )" mentioned in BOX format.
🌡️Plot Levels Using 3 Min, 5 Min Time frame in your Chart for Better Analysis
L#1: If the candle crossed & stays above the “Buy Gen”, it is treated / considered as Bullish bias.
L#2: Possibility / Probability of REVERSAL near RLB#1 & UBTgt
L#3: If the candle stays above “Sell Gen” but below “Buy Gen”, it is treated / considered as Sidewise. Aggressive Traders can take Long position near “Sell Gen” either retesting or crossed from Below & vice-versa i.e. can take Short position near “Buy Gen” either retesting or crossed downward from Above.
L#4: If the candle crossed & stays below the “Sell Gen”, it is treated / considered a Bearish bias.
L#5: Possibility / Probability of REVERSAL near RLS#1 & USTgt
HZB (Buy side) & HZS (Sell side) => Hurdle Zone,
*** Specialty of “HZB#1, HZB#2 HZS#1 & HZS#2” is Sidewise (behaviour in Nature)
Rest Plotted and Mentioned on Chart
Color code Used:
Green =. Positive bias.
Red =. Negative bias.
RED in Between Green means Trend Finder / Momentum Change
/ CYCLE Change and Vice Versa.
Notice One thing: HOW LEVELS are Working.
Use any Momentum Indicator / Oscillator or as you "USED to" to Take entry.
⚠️ DISCLAIMER:
The information, views, and ideas shared here are purely for educational and informational purposes only. They are not intended as investment advice or a recommendation to buy, sell, or hold any financial instruments. I am not a SEBI-registered financial adviser.
Trading and investing in the stock market involves risk, and you should do your own research and analysis. You are solely responsible for any decisions made based on this research.
"As HARD EARNED MONEY IS YOUR's, So DECISION SHOULD HAVE TO BE YOUR's".
Do comment if Helpful .
In depth Analysis will be added later (If time Permits)

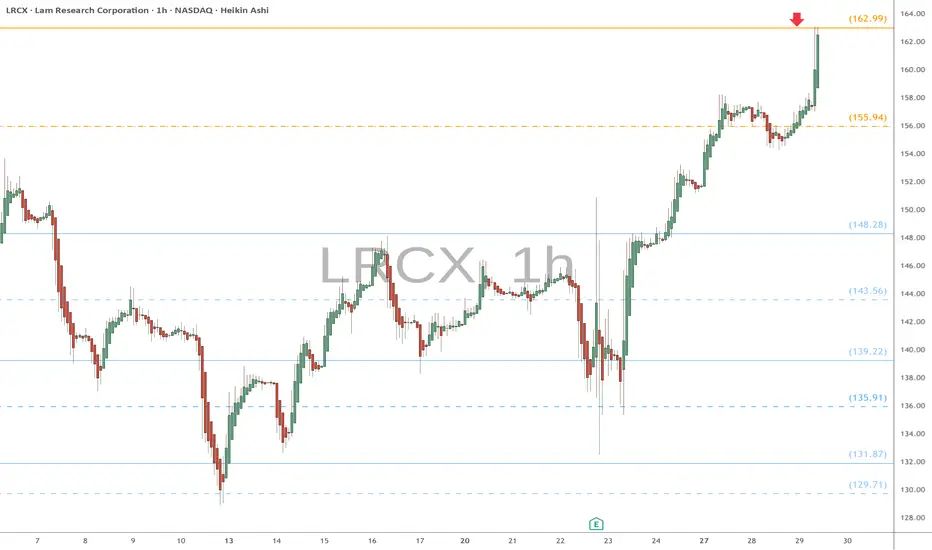
LRCX heads up at $162.99: Golden Genesis fib should give a DIP This is a followup to my previous long call below.
LRCX got a boost from the last Earnings report.
It has just hit a Golden Genesis fib at $162.99
Look for a Break-n-Retest or a Dip-to-Fib to buy.
.
Last Plot that gave a PERFECT LONG:
Hit BOOST and FOLLOW for more such PRECISE and TIMELY charts.
=========================================================
.
GOLD (XAUUSD): Short Trade Before the FED
I see an intraday pullback trade on Gold ahead of
FOMC & FED Interest Rate Decision today.
The price will likely retrace from the underlined resistance,
following a confirmed bearish imbalance and a formation
of a double top pattern.
Expect a bearish movement at least to 3988 level.
❤️Please, support my work with like, thank you!❤️
I am part of Trade Nation's Influencer program and receive a monthly fee for using their TradingView charts in my analysis.

BANKNIFTYBanknifty levels are based on imbalances
1. gapup 58800 l;ong
2. 58800-58500 trade reversal
3. gapdown 58500 shoprt
