DeGRAM | ETHUSD will rebound from the $2800 level📊 Technical Analysis
● ETH/USD has broken above the long-term descending resistance line and is now retesting it while holding the higher-low structure near the 2,600–2,700 zone. This confirms a potential reversal from the extended corrective phase.
● Price is also rebounding from the lower boundary of the falling channel, with consolidation clusters suggesting accumulation before a move toward 3,300–3,400.
💡 Fundamental Analysis
● ETH sentiment strengthens as staking inflows rise and developers finalize key upgrades for 2026, while improved risk appetite supports large-cap crypto recovery.
✨ Summary
● Bullish bias above 2,650. Targets: 3,300 → 3,400. Support: 2,600. Resistance: 3,350.
-------------------
Share your opinion in the comments and support the idea with a like. Thanks for your support!
Support and Resistance

DeGRAM | DOGEUSD aims to return to $0.15📊 Technical Analysis
● DOGE rebounded cleanly from the 0.1359 support line, forming a higher low and recovering back inside short-term structure.
● Price is aiming toward 0.1420 and the descending resistance near 0.1465, where the channel top may cap the move.
💡 Fundamental Analysis
● Sentiment improved as meme-assets reacted positively to broader crypto strength and rising risk appetite.
✨ Summary
● Long bias; targeting 0.1420 → 0.1465 as price lifts from support.
-------------------
Share your opinion in the comments and support the idea with a like. Thanks for your support!

DeGRAM | USDJPY has the potential to rise by more than 65 pips📊 Technical Analysis
● USD/JPY broke out of the descending channel and is now climbing within a rising structure, repeatedly holding support near 155.74 and forming higher lows.
● The bullish channel points toward a continuation toward 156.56 and potentially 156.98, with pullbacks showing shallow corrections consistent with trend strength.
💡 Fundamental Analysis
● FXStreet notes renewed USD demand as U.S. yields stabilize and BoJ tightening expectations ease, supporting short-term upside.
✨ Summary
● Long bias: targets 156.56 → 156.98 while above 155.74.
-------------------
Share your opinion in the comments and support the idea with a like. Thanks for your support!

BankNfity levels - Dec 11, 2025Utilizing the support and resistance levels of BankNifty, along with the 5-minute timeframe candlesticks and VWAP, can enhance the precision of trade entries and exits on or near these levels. It is crucial to recognize that these levels are not static, and they undergo alterations as market dynamics evolve.
The dashed lines on the chart indicate the reaction levels, serving as additional points of significance. Furthermore, take note of the response at the levels of the High, Low, and Close values from the day prior.
We trust that this information proves valuable to you.
* If you found the idea appealing, kindly tap the Boost icon located below the chart. We encourage you to share your thoughts and comments regarding it.
Wishing you successful trading endeavors!

Nifty levels - Dec 11, 2025Nifty support and resistance levels are valuable tools for making informed trading decisions, specifically when combined with the analysis of 5-minute timeframe candlesticks and VWAP. By closely monitoring these levels and observing the price movements within this timeframe, traders can enhance the accuracy of their entry and exit points. It is important to bear in mind that support and resistance levels are not fixed, and they can change over time as market conditions evolve.
The dashed lines on the chart indicate the reaction levels, serving as additional points of significance to consider. Furthermore, take note of the response at the levels of the High, Low, and Close values from the day prior.
We hope you find this information beneficial in your trading endeavors.
* If you found the idea appealing, kindly tap the Boost icon located below the chart. We encourage you to share your thoughts and comments regarding it.
Wishing you success in your trading activities!

DeGRAM | XRPUSDT held the support area📊 Technical Analysis
● XRP/USD is rebounding from the green support zone, forming higher lows and breaking into a short-term ascending structure aimed toward 2.0990.
● The price is approaching the descending resistance line; a push from the rising trendline suggests momentum building for a test of 2.0990 and potentially the upper trendline next.
💡 Fundamental Analysis
● FXStreet notes improving sentiment around altcoins as liquidity returns and regulatory pressure eases, supporting short-term upside for XRP.
✨ Summary
● Long bias: targets 2.0990 while support holds near 2.02.
-------------------
Share your opinion in the comments and support the idea with a like. Thanks for your support!

Gold: Next Big Move🌟 Gold: Preparing for the Next Big Move
Gold has been consolidating between $4,260 and $4,170 since November 28, building pressure for its next major breakout. This tight range suggests accumulation, similar to previous setups before strong impulsive rallies. These weeks require patience, discipline, and solid risk management.
Today is crucial:
📉 If the Fed cuts rates, gold could enter its final bullish rally of the year.
📊 Current market surveys show ~90% probability of a 25 bps cut, which historically boosts gold as real yields drop and safe-haven demand increases.
Additional context:
🔥 Geopolitical tensions (Venezuela–USA, Middle East) continue to support a risk-off environment.
💵 The US Dollar Index (DXY) has been weakening ahead of the decision — another bullish factor for gold.
📈 CFTC data also shows increasing net long positioning in gold futures, signaling strong institutional interest.
Gold is coiling.
The breakout — when it comes — will be massive.
OANDA:XAUUSD

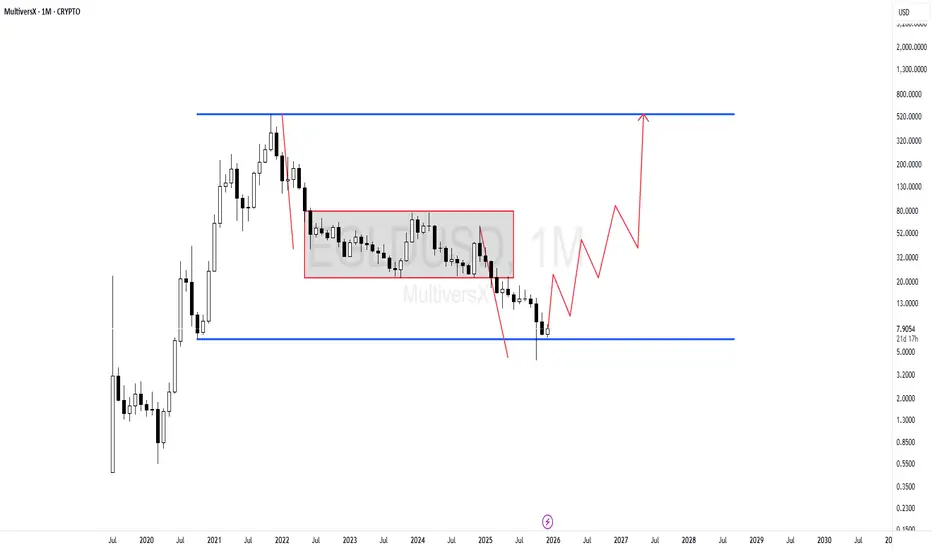
EGLD The target has given two legs of the same size and we shoulThe target has given two legs of the same size and we should wait for a micro double bottom at the bottom of the trading range.
I am waiting for a move down up down up on a monthly or weekly time frame.
GC daily trade plan for Dec 10, 2025Gold is in the consolidation range. Market is awaiting FOMC meeting. I do not expect any big moves ahead of that meeting however I will watch for trade signals at the extremes of that consolidation

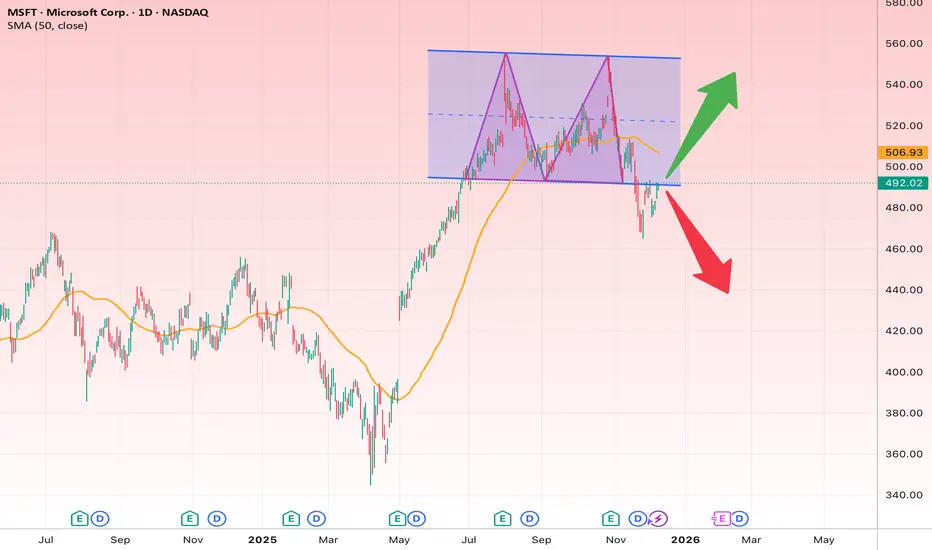
Microsoft at a Breaking Point: Is This Pullback a Trap?Microsoft has broken down from a distribution range / double top zone and is now forming a critical pullback retesting the broken support. This area will determine the medium-term direction.
Bearish Scenario (More Likely)
Rejection from 505–510:
• Target 1: 480
• Target 2: 455
• Target 3: 430
• Stop-loss: Daily close above 515
Bullish Scenario
If price closes above 515:
• Target 1: 525
• Target 2: 545
• Stop-loss: Close below 500
Short Fundamental View
• Strong position in AI, cloud, and enterprise software.
• Copilot and Azure growth remain strong.
• But valuation is stretched at highs, increasing correction risk.
Bitcoin to $100kBitcoin is ready to push one more time to reach a very important resistance area at $100k

USDJPY DUBBLE BOTTOM (READ CAPTION)Hi trader's what do you think about USDJPY
The market is currently forming a Double Bottom structure, showing early signs of a potential bullish reversal. Price is moving inside a falling channel, and buyers are starting to react strongly from the lower support zone.
🔹 Key Levels
Support (FVG Support Zone): Strong reaction area around 153.90–154.10 where buyers stepped in.
Double Bottom: Price has formed two equal lows, indicating seller exhaustion and buyer interest.
Resistance: 155.78 — This is the major intraday resistance level.
🔹 Breakout Confirmation
If price breaks and closes above 155.78, this will confirm the reversal and open the path toward the 156.30 demand zone.
🔹 Demand Zone – 156.30
This is the upside target where price is expected to move if the breakout is successful.
This zone previously acted as a supply area and now serves as a potential bullish target.
📉 Scenario if No Breakout
If the market fails to break 155.78, price can make another retest toward the FVG support before another attempt to move upward.
📈 Market Outlook
Breakout above 155.78 → Bullish continuation
Target → 156.30 Demand Zone
Double Bottom + Channel Break = Strong reversal structure
FVG support holding → Buyer strength confirmed
please don't forget to like comment thank you

XAUUSD LONG VIEWWe might see a reaction from that demand zone. Gold is still bullish and this area has a strong bullish pressure

BRCUUSD BULLISH OR TRAP (READ CAPTION)Hi trader's what do you think about BTCUSD
BTCUSD is currently developing a bullish setup, as the market is holding above key support levels and showing signs of buyer strength. Price is respecting the lower zones, indicating a possible continuation toward higher levels.
🔹 Support: 89,600
This is the primary support level where buyers have reacted previously.
As long as BTC stays above 89,600, bullish sentiment remains intact.
🔹 Strong Support: 89,000
This zone represents strong structural support.
If the market dips into 89,000, it is considered a high-probability demand area for buyers to re-enter.
🔹 Resistance: 92,200
This is the first bullish target, where short-term profit-taking may occur.
A breakout above 92,200 will strengthen bullish momentum.
🔹 Supply Zone: 94,000
This is the major supply zone where sellers may become active.
If BTC breaks above 94,000, the market could shift into a stronger bullish trend.
📈 Market Outlook
Holding above 89,600 / 89,000 → Bullish continuation expected
Break above 92,200 → Opens the way toward 94,000 supply zone
Supply at 94,000 will decide the next major directional move
please like comment and follow thank you

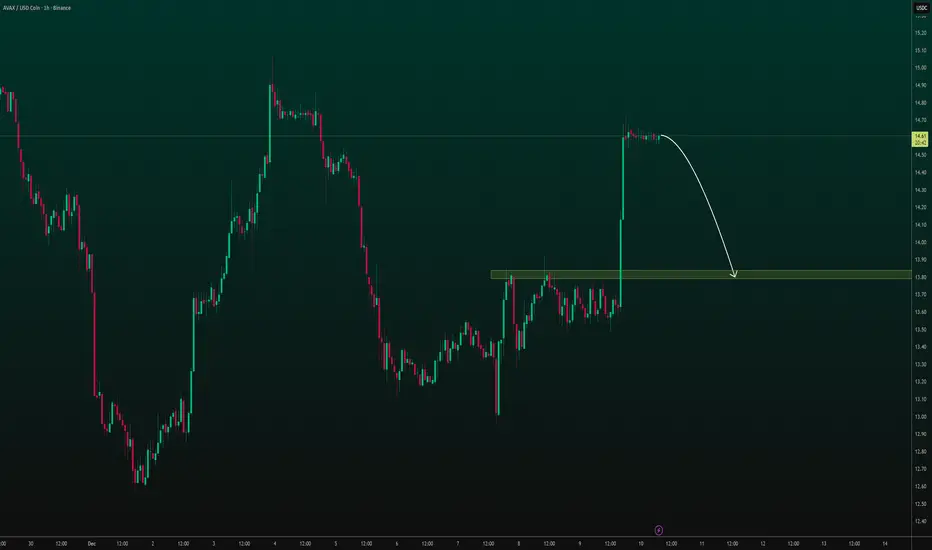
AVAX/USDC - Sudden Spike, Potential Pullback to SupportAVAX just saw a sharp spike to a new high, but is now showing signs of a potential pullback. The white arrow indicates a possible retracement towards the highlighted support zone.

All you need to know: WHEN and WHERE (short giude)Most traders lose money not because they’re wrong about direction… but because they’re wrong about WHEN and WHERE direction actually matters.
This is the missing piece in 99% of trading strategies.
Let’s break it down simply and clearly.
1. WHERE Matters First: Price Location Defines the Entire Trade
The market is not equally important at all prices.
There are only a few places where decisions actually have consequences:
🔹 1. Major Higher-Timeframe Levels
- Daily, Weekly and even monthly support, resistance, supply, demand.
- This is where big players care.
- Most BIG moves begin here.
🔹 2. Volatility Compression Zones
- Tight ranges, triangles, squeezes, etc
- When volatility compresses, potential energy builds.
- Breakouts here actually matter.
🔹 3. Break-and-Retest Structures
- The retest is where confirmation happens.
- It’s where weak hands exit and smart money enters.
🔹 4. Trend Extremes / Overextensions
- Parabolic rallies, vertical drops, stretched momentum.
- These locations create the most powerful reversals.
🔹 5. Liquidity Pools
- Above swing highs, below swing lows, around obvious trendlines.
- Institutions hunt these levels before moving the market.
If you’re not trading at one of these five locations, you are trading noise.
2. WHEN Matters Even More: Timing Is the Difference Between Chop and Trend
Even the best location is useless if the moment isn’t right.
Here are the only timing conditions that give your trade real probability:
🔸 1. Volatility Expansion After Compression
- Wait for candles to elongate, volume to increase, and the range to open up.
- Before expansion: fakeouts.
- After expansion: real moves.
🔸 2. Liquidity Sweeps
- The market clears stops → fills institutional orders → reveals true direction.
- You don’t act before the sweep; you act after it confirms.
🔸 3. Structural Confirmation
- Higher low in an uptrend.
- Lower high in a downtrend.
- Break → Retest → Continuation.
- Without structure, timing is random.
🔸 4. Active Market Sessions
- London open, NY open, session overlaps, major news events.
- The same setup at 03:00 means nothing — the same setup at NY open is a trade.
🔸 5. Multi-Timeframe Momentum Alignment
- HTF gives the bias
- MTF gives the setup
- LTF gives the entry
- When timeframes align, timing becomes obvious.
3. WHERE + WHEN = Non-Random Trades
This is what professional trading really is:
- WHERE = the place price must react
- WHEN = the moment price has conviction
Combine both and you no longer predict — you simply respond to high-probability situations.
- This is how you avoid chop.
- This is how you avoid forcing trades.
- This is how you become consistent.
4. The Psychological Shift
Retail traders think:
“I must forecast the next move.”
Professionals think:
“I only act at key locations, when timing conditions align.”
This removes:
- FOMO
- guessing
- impulsive entries
- emotional trading
You no longer chase the market.
You wait for the market to come to your WHERE and your WHEN.
That’s the edge.
5. Final Thoughts
You don’t need to predict the market.
You don’t even need to know what happens next.
You only need to know:
- WHERE the market becomes important
- WHEN a move becomes meaningful
Master these two, and everything else falls into place.
P.S.
I know this is easier said than done. Even after many years in the market, with a solid sense of direction and plenty of sniper-level entries, my WHEN is not always perfect either. That’s the part none of us ever truly “master” — we only learn to manage it better.
So take all of this as a blueprint, not a declaration that I execute flawlessly. I’m a professional, yes — but I’m also in a continuous process of adapting, refining, and learning from every new shift the market throws at us.
Experience helps, but the market keeps evolving, and so do I. Just like anyone else should.

FOMC WILL DEFINITELY CLEAR LIQUIDITY BOTH WAYS a buy at 4199-95, sl at 4185 and tp at 4140 but that will be holding till FOMC and we could see a sell again to clear liquidity below to 4165 area after a push up to clear liquidity first

FireHoseReel | Uniswap Is Approaching a Market Decision Zone🔥 Welcome To FireHoseReel !
Let’s jump into Uni Swap (UNI) market analysis.
👀 UNI 4H Overview
UNI is currently trading inside a range box, with resistance at $5.858 and support at $5.445.
A breakout from either side can lead to a major move. Looking at the chart history, every strong upside move has been followed by a deep correction, yet the impulses themselves have been very sharp and aggressive.
📊 Volume Analysis
UNI volume on Binance is currently not very strong, so clear confirmation is still missing.
However, when UNI starts printing high volume on Binance as well, it signals increased trader attention.
A rise in volume would be a logical confirmation for the next price move.
✍️ UNI Trading Scenarios
🟢 Long Scenario:
A breakout above $5.858 can activate our long trigger, but this setup requires a clear increase in buying volume for confirmation.
🔴 Short Scenario:
A breakdown below the $5.44 support can push price toward the next demand zone.
This move should be confirmed with a strong rise in selling volume, making it a valid short opportunity.
🧠 Protect your capital first. No setup is worth blowing your account. If risk isn’t controlled, profit means nothing. Trade with rules, not emotions.

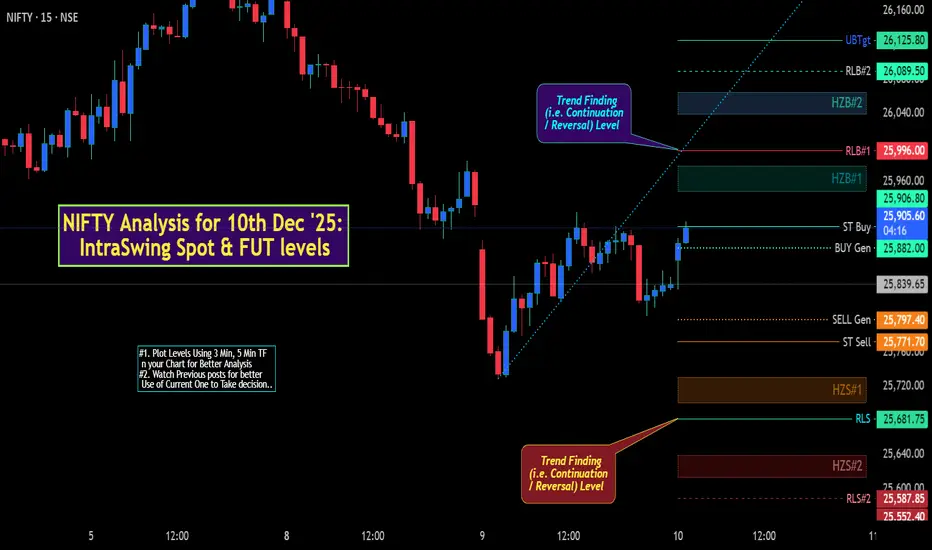
NIFTY Analysis for 10th Dec '25: IntraSwing Spot & FUT levels. FUT levels
Future LEVELS Future LEVELS
LONG > 26004 SHORT < 25914
TGT#1 26031 TGT#1 25887
TGT#2 26054 TGT#2 25864
TGT#3 26076 TGT#3 25842
TGT#4 26108 TGT#4 25810
TGT#5 26127 TGT#5 25791
TGT#6 26173 TGT#6 25746
TGT#7 26200 TGT#7 25718
TGT#8 26227 TGT#8 25691
TGT9 26265 TGT#9 25653
[ Level Interpretation / description:
L#1: If the candle crossed & stays above the “Buy Gen”, it is treated / considered as Bullish bias.
L#2: Possibility / Probability of REVERSAL near RLB#1 & UBTgt
L#3: If the candle stays above “Sell Gen” but below “Buy Gen”, it is treated / considered as Sidewise. Aggressive Traders can take Long position near “Sell Gen” either retesting or crossed from Below & vice-versa i.e. can take Short position near “Buy Gen” either retesting or crossed downward from Above.
L#4: If the candle crossed & stays below the “Sell Gen”, it is treated / considered a Bearish bias.
L#5: Possibility / Probability of REVERSAL near RLS#1 & USTgt
HZB (Buy side) & HZS (Sell side) => Hurdle Zone,
*** Specialty of “HZB#1, HZB#2 HZS#1 & HZS#2” is Sidewise (behaviour in Nature)
Rest Plotted and Mentioned on Chart
Color code Used:
Green =. Positive bias.
Red =. Negative bias.
RED in Between Green means Trend Finder / Momentum Change
/ CYCLE Change and Vice Versa.
Notice One thing: HOW LEVELS are Working.
Use any Momentum Indicator / Oscillator or as you "USED to" to Take entry.
⚠️ DISCLAIMER:
The information, views, and ideas shared here are purely for educational and informational purposes only. They are not intended as investment advice or a recommendation to buy, sell, or hold any financial instruments. I am not a SEBI-registered financial adviser.
Trading and investing in the stock market involves risk, and you should do your own research and analysis. You are solely responsible for any decisions made based on this research.
"As HARD EARNED MONEY IS YOUR's, So DECISION SHOULD HAVE TO BE YOUR's".
Do comment if Helpful .
Do Comment for In depth Analysis.
Follow notification about periodical View
FireHoseReel | BNB Daily Analysis #19🔥 Welcome To FireHoseReel !
Let’s dive into BinanceCoin (BNB) analysis.
👀 BNB 4H Overview
BNB is currently trading inside a large 4H range box. A breakout from this box could trigger a major move.
The $922 level stands as both the top of the range and the 38% Fibonacci retracement of the previous bearish leg.
On the downside, $881 is acting as a freshly formed support zone.
📊 Volume Analysis
Volume slightly increased during the attempt to break $922, but buyers lacked enough strength and selling pressure followed.
A strong and sustained increase in volume will significantly raise the probability of a valid breakout.
✍️ BNB Trading Scenarios
🟢 Long Scenario 1:
A confirmed breakout above $922 creates a solid long opportunity.
Entry confirmation should come from a stable increase in buying volume.
🟢 Long Scenario 2:
You may enter on the 4th test using a stop-buy order with a wider stop, targeting around RR = 2.
⚠️ This type of entry should be executed with maximum 0.5% risk per trade to avoid heavy losses.
🔴 Short Scenario:
Since the broader structure behind price is strongly bearish, and the market previously experienced an aggressive drop from a distribution zone,
a break below the newly formed $881 support can activate a short position, confirmed by rising sell volume.
🧠 Protect your capital first. No setup is worth blowing your account. If risk isn’t controlled, profit means nothing. Trade with rules, not emotions.

GBPUSDGU made and aggressive rally to the upside taking out previous highs.
We can look for continuations once price reaches an area or interest or the discounted price.

GRANULES INDIAGranules India Ltd., incorporated in the year 1991, is a Mid Cap company (having a market cap of Rs 13,600.37 Crore) operating in Pharmaceuticals sector.
Granules India Ltd. key Products/Revenue Segments include Pharmaceuticals and Other Operating Revenue for the year ending 31-Mar-2025.
For the quarter ended 30-09-2025, the company has reported a Consolidated Total Income of Rs 1,295.84 Crore, up 5.66 % from last quarter Total Income of Rs 1,226.45 Crore and up 33.61 % from last year same quarter Total Income of Rs 969.87 Crore. Company has reported net profit after tax of Rs 130.61 Crore in latest quarter.
The company’s top management includes Dr.Krishna Prasad Chigurupati, Dr.K V S Ram Rao, Mr.Kolli Basava Sankar Rao, Mr.Harsha Chigurupati, Mrs.Priyanka Chigurupati, Mrs.Uma Devi Chigurupati, Mr.Arun Sawhney, Mr.Kapil Kumar Mehan, Mr.Rajiv Pritidas Kakodkar, Dr.Saumen Chakraborty, Dr.Sethurathnam Ravi, Mrs.Sucharita Rao Palepu, Mr.Mukesh Surana, Ms.Chaitanya Tummala. Company has S R Batliboi & Associates LLP as its auditors. As on 30-09-2025, the company has a total of 24.27 Crore shares outstanding.
