$TAO 1hGETTEX:TAO 1H
Beautiful falling channel breakout forming right at key support with clear upside targets (T1–T3).
If CRYPTOCAP:BTC stays stable and continues to perform well, this setup could easily push higher toward resistance. 📈
Support and Resistance

NASDAQ 100 (NQ1!): Bullish! Buy This Dip!Welcome back to the Weekly Forex Forecast for the week of Nov. 3 - 7th.
In this video, we will analyze the following FX market: NASDAQ (NQ1!) NAS100
The NASDAQ reached all time highs last week, then started a pullback, landing in a +FVG.
As the +FVG continues to hold, look for valid buy setups to form.
Sells are not valid, my friends. Go with the trend!
Enjoy!
May profits be upon you.
Leave any questions or comments in the comment section.
I appreciate any feedback from my viewers!
Like and/or subscribe if you want more accurate analysis.
Thank you so much!
Disclaimer:
I do not provide personal investment advice and I am not a qualified licensed investment advisor.
All information found here, including any ideas, opinions, views, predictions, forecasts, commentaries, suggestions, expressed or implied herein, are for informational, entertainment or educational purposes only and should not be construed as personal investment advice. While the information provided is believed to be accurate, it may include errors or inaccuracies.
I will not and cannot be held liable for any actions you take as a result of anything you read here.
Conduct your own due diligence, or consult a licensed financial advisor or broker before making any and all investment decisions. Any investments, trades, speculations, or decisions made on the basis of any information found on this channel, expressed or implied herein, are committed at your own risk, financial or otherwise.

S&P 500 (ES1!): Bullish! Buy This Dip!Welcome back to the Weekly Forex Forecast for the week of Nov. 3 - 7th.
In this video, we will analyze the following FX market: S&P 500 (ES1!)
The S&P500 is bullish, and buys are valid.
Price is currently in a +FVG, so looking for sells is prohibited!
If the +FVG fails, only then will buys become invalid.
Enjoy!
May profits be upon you.
Leave any questions or comments in the comment section.
I appreciate any feedback from my viewers!
Like and/or subscribe if you want more accurate analysis.
Thank you so much!
Disclaimer:
I do not provide personal investment advice and I am not a qualified licensed investment advisor.
All information found here, including any ideas, opinions, views, predictions, forecasts, commentaries, suggestions, expressed or implied herein, are for informational, entertainment or educational purposes only and should not be construed as personal investment advice. While the information provided is believed to be accurate, it may include errors or inaccuracies.
I will not and cannot be held liable for any actions you take as a result of anything you read here.
Conduct your own due diligence, or consult a licensed financial advisor or broker before making any and all investment decisions. Any investments, trades, speculations, or decisions made on the basis of any information found on this channel, expressed or implied herein, are committed at your own risk, financial or otherwise.

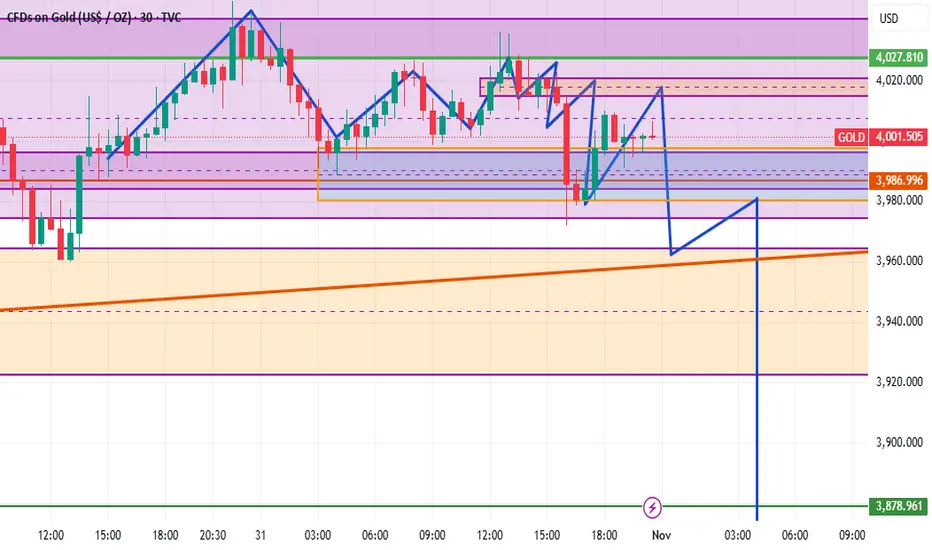
Mapping the Next Possible Move | Key Breakout and Demand ZonesGold (XAUUSD) is currently consolidating between key structural zones, showing a balanced tug-of-war between buyers and sellers. The 4025 area remains the short-term resistance to watch — a clean break and close above this level could confirm bullish continuation toward 4075 and the major supply zone around 4150.
On the other hand, failure to sustain above 4025 may trigger a short-term pullback. The 3925–3960 zone has acted as a strong demand area where buyers have consistently stepped in, making it a crucial support for potential bullish rejections and trend continuation.
At this stage, the next possible move will likely depend on how price reacts around these two major zones:
Bullish scenario: Break and retest above 4025 → potential rally toward 4150.
Bearish scenario: Rejection at 4025 → possible correction toward 3925 demand.
Overall sentiment remains neutral-to-bullish as long as price holds above the demand area. Watching for a confirmed breakout or clear rejection structure before taking directional trades is key.

GOLD: Bullish! Continue To Buy! The +FVG Is Holding!In this Weekly Market Forecast, we will analyze the Gold (XAUUSD) for the week of Nov. 3 - 7th.
Gold has completed the pullback into the Weekly +FVG. It has moved sideways since, but inching higher.
Buys are valid. They have the highest probability.
Sells become valid only after a bearish break of market structure!
Enjoy!
May profits be upon you.
Leave any questions or comments in the comment section.
I appreciate any feedback from my viewers!
Like and/or subscribe if you want more accurate analysis.
Thank you so much!
Disclaimer:
I do not provide personal investment advice and I am not a qualified licensed investment advisor.
All information found here, including any ideas, opinions, views, predictions, forecasts, commentaries, suggestions, expressed or implied herein, are for informational, entertainment or educational purposes only and should not be construed as personal investment advice. While the information provided is believed to be accurate, it may include errors or inaccuracies.
I will not and cannot be held liable for any actions you take as a result of anything you read here.
Conduct your own due diligence, or consult a licensed financial advisor or broker before making any and all investment decisions. Any investments, trades, speculations, or decisions made on the basis of any information found on this channel, expressed or implied herein, are committed at your own risk, financial or otherwise.

EXPECTATION FOR THE WEEK/WEEKS AHEADGold is in-between two major zones, buy zone at 3998-3980 and a sell zone at 4020-4037 and price can respect any of the two major zones and start moving in either direction but based on last week price action i will still go for sells, although Gold is fundamentally expected to buy again long term because of reduced rate and higher inflation,
but it would probably sell again this week ahead to create the monthly low and also to test a higher time frame buy zone below before it starts with another massive buys to end the year,
so let target a sell at 4014-4020 when market opens, with sl around 4035/37 and tp not less than 500pips or far below , because this sell is expected to reach somewhere 3870-50, before the long term buy start , i will update you along the way and if it decides to buy midway i will signal or update you but if it reaches 3870-50 and it decides to move below it to sell more too i will update and that will signal a very long term sells so let be on alert mood as i always be .
A lot discovered so always be around, forex is not scary to us anymore it's rather interesting because everything is based on time and price, that's why you see prices plotted against time, very interesting indeed.
Top Markets For The Week 2/11-25 --> 7/11-25OANDA:AUDJPY
COUNTER TREND TRADE HIGH RISK DEGEN TRADE!!!!
Weekly Bullish
Daily Bullish
4H bullish
Price has climbed up to a daily AOI where price has been used as resistance 5+ times previously.
Like said this is a high risk trade since we're trading against the trend. I believe price is going to push down again since this climb was impacted by red folder news last week. I want to see an engulfing candle engulfging and closing under the 50 EMA (confluence in direction) in the 1H chart. Other than that this looks like a high probability trade even though its a trade against the trend.

GBPUSD: Bearish! Sell The Pullback To The Daily -FVG!Welcome back to the Weekly Forex Forecast for the week of Nov. 3 - 7th.
The GBPUSD is weak and just swept sell side LQ at relative equal lows. I expect a retracement higher from there... to the Daily -FVG. There, I will look for the formation of a -BOS, and short this market.
Enjoy!
May profits be upon you.
Leave any questions or comments in the comment section.
I appreciate any feedback from my viewers!
Like and/or subscribe if you want more accurate analysis.
Thank you so much!
Disclaimer:
I do not provide personal investment advice and I am not a qualified licensed investment advisor.
All information found here, including any ideas, opinions, views, predictions, forecasts, commentaries, suggestions, expressed or implied herein, are for informational, entertainment or educational purposes only and should not be construed as personal investment advice. While the information provided is believed to be accurate, it may include errors or inaccuracies.
I will not and cannot be held liable for any actions you take as a result of anything you read here.
Conduct your own due diligence, or consult a licensed financial advisor or broker before making any and all investment decisions. Any investments, trades, speculations, or decisions made on the basis of any information found on this channel, expressed or implied herein, are committed at your own risk, financial or otherwise.

Top Markets For The Week 2/11-25 --> 7/11-25OANDA:GBPNZD
Weekly BEARISH
Daily BEARISH
4H BULLISH
Price has pushed down to a daily AOI. This AOI has been used as resistance 4 previous times only this year.
I expect price to retrace back to the AOI since it never retested the AOI after price broke. What I want to see is the AOI and (50 EMA for confluence in direction not a factor) to be retested. If I see rejections like an engulfing candle from the AOI or rejection wicks or even consolidation inside the zone and potentially form a reverseal pattern like a H&S I would enter.

EURUSD: Bearish! Wait For Sells After The Pullback!Welcome back to the Weekly Forex Forecast for the week of Nov. 3 - 7th.
The EURUSD has been bearish, and just swept the liquidity lows. There may be a short term retracement up as a result. Waiting for sells at the -OB is best, as that is the larger trend.
Enjoy!
May profits be upon you.
Leave any questions or comments in the comment section.
I appreciate any feedback from my viewers!
Like and/or subscribe if you want more accurate analysis.
Thank you so much!
Disclaimer:
I do not provide personal investment advice and I am not a qualified licensed investment advisor.
All information found here, including any ideas, opinions, views, predictions, forecasts, commentaries, suggestions, expressed or implied herein, are for informational, entertainment or educational purposes only and should not be construed as personal investment advice. While the information provided is believed to be accurate, it may include errors or inaccuracies.
I will not and cannot be held liable for any actions you take as a result of anything you read here.
Conduct your own due diligence, or consult a licensed financial advisor or broker before making any and all investment decisions. Any investments, trades, speculations, or decisions made on the basis of any information found on this channel, expressed or implied herein, are committed at your own risk, financial or otherwise.

Top Markets For The Week 2/11-25 --> 7/11-25OANDA:USDJPY
Weekly Bullish
Daily Bullish
4H Bullish
Price is in a daily AOI that is being used as resistance. Since all the charts are screaming long for the moment, I'm gonna wait for price to break above the daily AOI and see if the resistance beomes support. Once price breaks above the AOI you are going to wait for a retest of the AOI and then enter on lower timeframe (30m or 1H ideally). Your entry signal would be an engulfing candle or a inverted H&S.

Top Markets For The Week 2/11-25 --> 7/11-25Weekly Bearish
Daily Bearish
4H Bearish
Price Has Broken and Retested a WEEKLY AOI and rejected.
I'm expecting price to retrace back to the aoi and potentially retest the zone and 50 EMA.
If that doesen't happen I'm gonna wait for a pullback to enter. OANDA:NZDUSD

Top Markets For The Week 2/11-25 --> 7/11-25Weekly Bearish
Daily Bearish
4H Bearish
Price Has Broken and Retested a WEEKLY AOI twice and rejected.
What I'm expecting is for a small retracment or a new LH
to enter this position. CMCMARKETS:EURCAD

US Dollar: Still Bullish! Wait For The Pullback, Then Buy It!Welcome back to the Weekly Forex Forecast for the week of Nov. 3 - 7th.
In this video, we will analyze the following FX market: USD Dollar
The USD is still bullish, and buys are still valid until there is a definitive bearish BOS.
There is a LQ-Low and a +OB below current prices, drawing prices to it. There, I will look for an HP trade to the upside.
So short term bearishness before the continuation higher.
Should the market break the low of the +OB, then buys are invalidated.
Enjoy!
May profits be upon you.
Leave any questions or comments in the comment section.
I appreciate any feedback from my viewers!
Disclaimer:
I do not provide personal investment advice and I am not a qualified licensed investment advisor.
All information found here, including any ideas, opinions, views, predictions, forecasts, commentaries, suggestions, expressed or implied herein, are for informational, entertainment or educational purposes only and should not be construed as personal investment advice. While the information provided is believed to be accurate, it may include errors or inaccuracies.
I will not and cannot be held liable for any actions you take as a result of anything you read here.
Conduct your own due diligence, or consult a licensed financial advisor or broker before making any and all investment decisions. Any investments, trades, speculations, or decisions made on the basis of any information found on this channel, expressed or implied herein, are committed at your own risk, financial or otherwise.

USDJPY FREE SIGNAL|SHORT|
✅USDJPY Price formed a double-top near the premium zone, showing exhaustion and signs of distribution. Expect a bearish reaction toward the demand level where liquidity rests.
—————————
Entry: 154.000
Stop Loss: 154.420
Take Profit: 153.320
Time Frame: 2H
—————————
SHORT🔥
✅Like and subscribe to never miss a new idea!✅

Parallel Channel Observation H1XAUUSD GOLD Update H1 Timeframe 🙌
- This Analysis is based on educational purposes using Technical aspect Parallel Channel 🔋
- Parallel Channel indications for a good bullish opportunities point from 📈
Targets would be at 4026 - 4047 - 4082.00 ✅️
Note : if Channel breaks this idea will be in Invalid ❗️
All you need to stick with one Mentor with Discipline Consistency and Focus Mindset 💯
#XAUUSD

Adobe $ADBE - LONG | Orbis InvestmentAdobe NASDAQ:ADBE - LONG | Orbis Investment
Entry: 335.42
TP: 465.56
SL: 274.70
RR: 2.14
#Adobe #ADBE #NASDAQ #Stocks #Equities #TradingView #TechnicalAnalisis #Bolsa #Inversiones #Trading #OrbisInvestment

AUD-CAD Free Signal! Buy!
Hello,Traders!
AUDCAD is reacting from a horizontal demand area, showing signs of accumulation before a potential bullish move. Liquidity below recent lows has been swept, favoring buyers.
-------------------
Stop Loss: 0.9145
Take Profit: 0.9195
Entry Level: 0.9169
Time Frame: 5H
-------------------
Buy!
Comment and subscribe to help us grow!
Check out other forecasts below too!
Disclosure: I am part of Trade Nation's Influencer program and receive a monthly fee for using their TradingView charts in my analysis.

DXY WILL KEEP GROWING|LONG|
✅DXY After a clean breakout above the key level, the index is showing strength and structure shift in favor of buyers. A potential retest of the zone may trigger continuation toward the target area. Time Frame 4H.
LONG🚀
✅Like and subscribe to never miss a new idea!✅

DXY Bullish Breakout! Buy!
Hello,Traders!
DXY broke above a key demand area, confirming bullish intent. A successful retest of the breakout zone may attract further buy orders toward the target level. Time Frame 5H.
Buy!
Comment and subscribe to help us grow!
Check out other forecasts below too!
Disclosure: I am part of Trade Nation's Influencer program and receive a monthly fee for using their TradingView charts in my analysis.

XRP Monthly ChartClosed October as a bearish candle with a wick all the way to $1.50.
See how the years ends at this point, first 1/3 of the last quarter is already bearish.

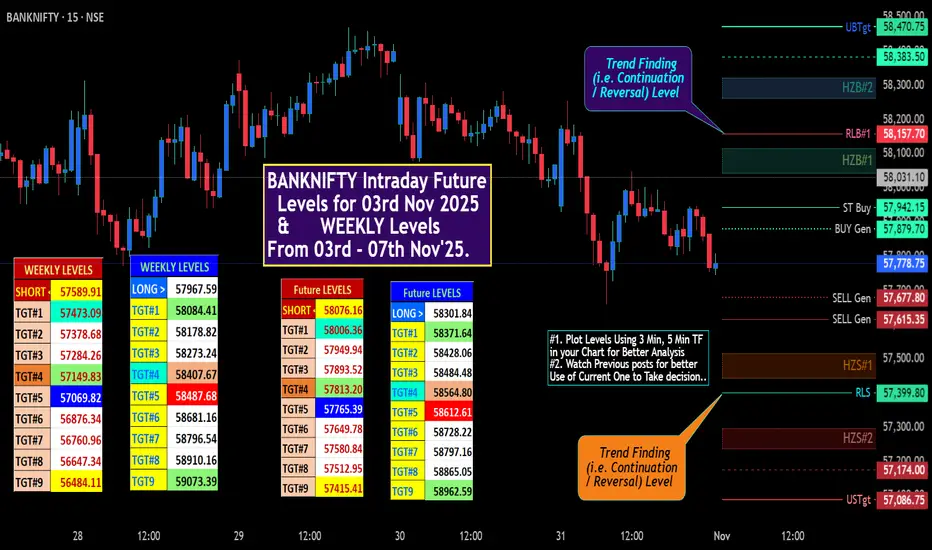
BANKNIFTY IntraSwqing Future Levels for 03ed Nov 2025✍🏼️ "Future IntraSwing Levels" mentioned in BOX format.
✍🏼️ "WEEKLY Levels" mentioned in BOX format.
🌡️Plot Levels Using 3 Min, 5 Min Time frame in your Chart for Better Analysis
L#1: If the candle crossed & stays above the “Buy Gen”, it is treated / considered as Bullish bias.
L#2: Possibility / Probability of REVERSAL near RLB#1 & UBTgt
L#3: If the candle stays above “Sell Gen” but below “Buy Gen”, it is treated / considered as Sidewise. Aggressive Traders can take Long position near “Sell Gen” either retesting or crossed from Below & vice-versa i.e. can take Short position near “Buy Gen” either retesting or crossed downward from Above.
L#4: If the candle crossed & stays below the “Sell Gen”, it is treated / considered a Bearish bias.
L#5: Possibility / Probability of REVERSAL near RLS#1 & USTgt
HZB (Buy side) & HZS (Sell side) => Hurdle Zone,
*** Specialty of “HZB#1, HZB#2 HZS#1 & HZS#2” is Sidewise (behaviour in Nature)
Rest Plotted and Mentioned on Chart
Color code Used:
Green =. Positive bias.
Red =. Negative bias.
RED in Between Green means Trend Finder / Momentum Change
/ CYCLE Change and Vice Versa.
Notice One thing: HOW LEVELS are Working.
Use any Momentum Indicator / Oscillator or as you "USED to" to Take entry.
⚠️ DISCLAIMER:
The information, views, and ideas shared here are purely for educational and informational purposes only. They are not intended as investment advice or a recommendation to buy, sell, or hold any financial instruments. I am not a SEBI-registered financial adviser.
Trading and investing in the stock market involves risk, and you should do your own research and analysis. You are solely responsible for any decisions made based on this research.
"As HARD EARNED MONEY IS YOUR's, So DECISION SHOULD HAVE TO BE YOUR's".
Do comment if Helpful .
In depth Analysis will be added later (If time Permits)
GBPUSD is testing a major support levelGBPUSD is testing a major support level currently and previous tests as indicated on the chart pushed the price high indicating a possible long trade targeting 1.3335
