Trading A Divergence Trade (Breakdown) with Pivots and LiquidityTrading divergences was always a problem for me in the past. I did the same thing you did and got it wrong every time. I was trading divergences when i saw them instead of realizing a divergence is a flip of support and resistance levels. I just needed to know where they are.
In this video:
Internal vs External Pivot divergence confirmation:
You can have two types of pivots on your chart. One for long term and one for short term.
Using them to confirm short and long term price action is intuitive as youll be able to see the market squeezing on the short term while knowing where your long term price structure exists.
Price action to Divergence Confirmation:
A divergence on a short term pivot is an indication of short term loss of trend or reversal.
If the short term has no divergence but the long term does, you are about to end up with some pretty large price moves.
Youll be confirming the divergence by looking for highs, lows, and closes moving the wrong way from current price action.
This video will give you a method you can use to draw out your support zone / resistance zone / divergence zone and use them to your advantage.
The "Divergence Zone" that you draw out is the very reason why so many people fail at divergences.
Bare in mind that when you have a divergence, support and resistance are on the WRONG sides as their normally are so you'll learn here how to find those zones as well.
Then in the end of the video ill show you how to use lower timeframes to confirm the new move of the market.
Thanks, everyone. For coming through to the CoffeeShop.
Support and Resistance
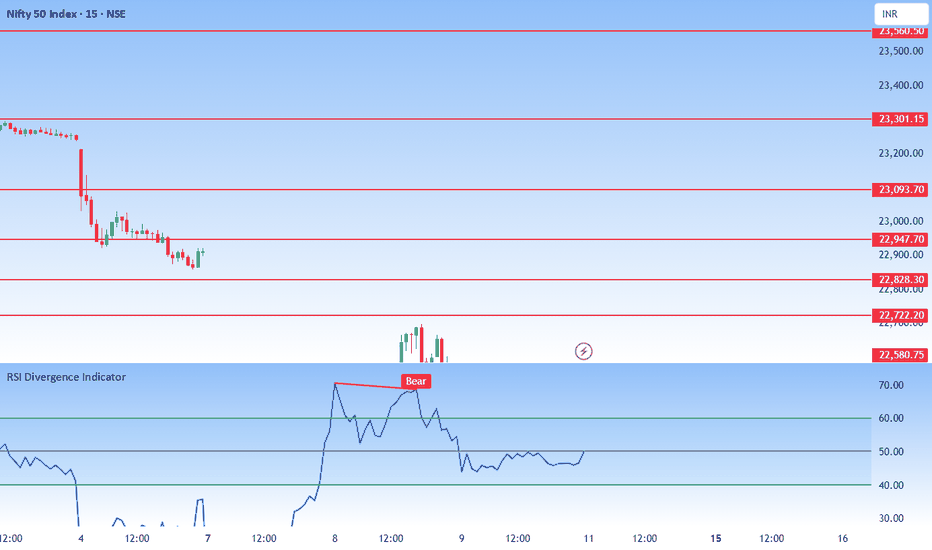
Review and plan for 11th April 2024Nifty future and banknifty future analysis and intraday plan in kannada.
This video is for information/education purpose only. you are 100% responsible for any actions you take by reading/viewing this post.
please consult your financial advisor before taking any action.
----Vinaykumar hiremath, CMT
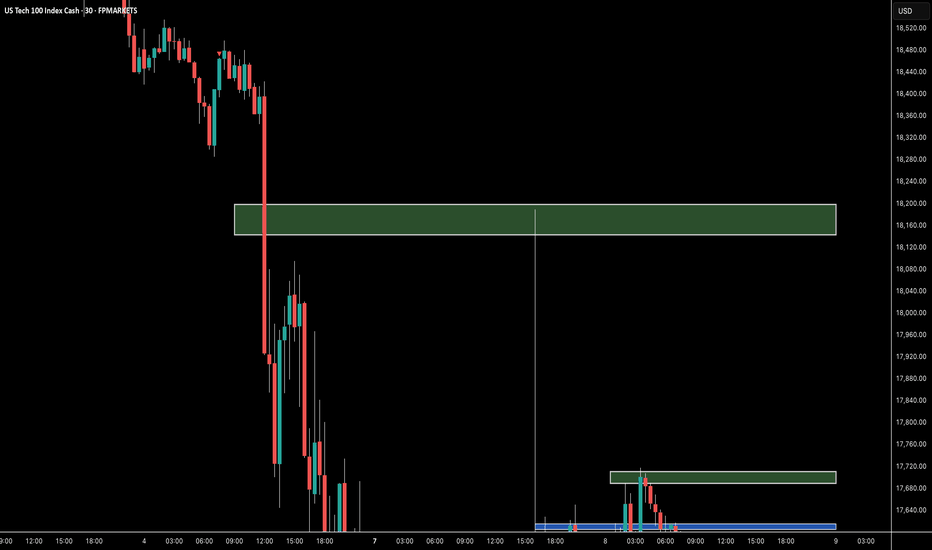
NVIDIA Update 3 Rangebound with new Low for longsIn this video I bring to your attention what we could possibly expect if we lose the current level and if we do then where is the next crucial zone to look for Longs.
If you have read this then pls do Boost my work and any questions then leave them below
Trade the range until it breaks Nvidia updateThis video is a quick recap on the previous video after the levels I gave produced 30% move to the upside after patiently waiting for the move down to 90$.
So what now is the big question after the unprecedented move we had yesterday .
I outline the next best Short/Long setup and define why I think we stay inside of the range until Earnings Data .
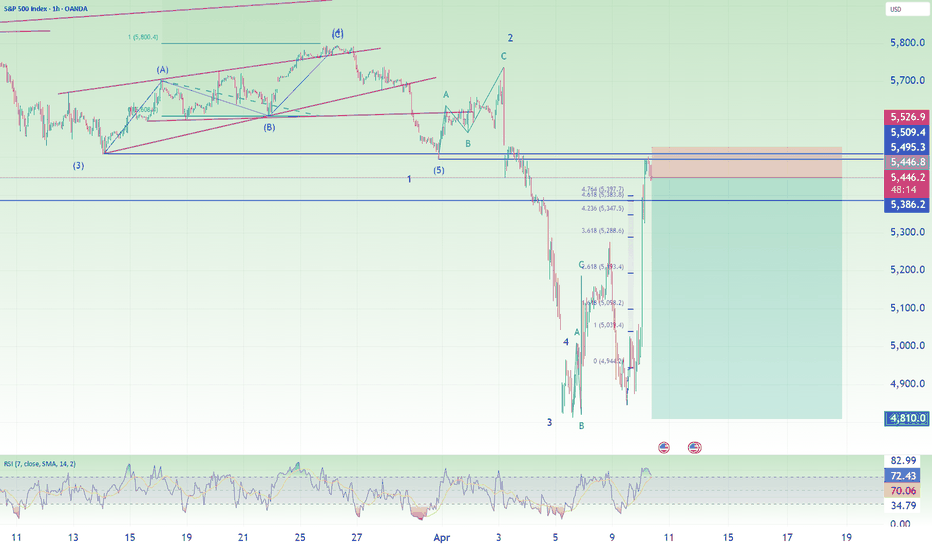
Nasdaq and S&p500 short: Completion of B waveI mentioned in my previous analysis that we are waiting for a short (the previous one was a long-then-short linked with this idea). I did not post any short idea yesterday after that NOT because I am good and recognize a double combination. It's really because I was too busy with work and I am glad my last was a long-then-short.
Back to this, remember that the huge volatility has caused the points in the chart to compress and thus even though the stop loss looks small, it is actually still quite a number of points away. So my suggestion is to manage your size and keep it small relative to your account.
Good luck!
SP500 may have already hit the low In the video I have shown an interesting relationship between past crashes on SP500 which shows we might have already hit the low are very close to it before we start next major rally.
Note: Even though the relationship I have shown holds true so far doesn't Guarantee it will in future as well as all patterns no matter how convincing get invalidated at some point.
BTC | BEARISH Cycle Begins | $71KThere are a few tell signs that BTC has entered the bearish market.
If the price fails to maintain closing daily candles ABOVE the 70k area, there is a likelihood for a nasty Head and Shoulders pattern to form.
A key point to watch are the Bollinger Bands, which gives you an indication of the next possible zone to watch.
_____________________
BINANCE:BTCUSDT
SPX500 & Nasdaq: Confluence! Confluence! Confluence!With consumer confidence off at circuit breaking levels, the market, technically, has reached extreme levels of support. Let's look at it:
Technicals:
(1) Horizontal Levels of support
(2) 50%/61.8% fib confluence
(3) exDiv1
(4) extreme indicators
(5) Chikou span testing cloud support
(6) 28% drop is SPX
All of these levels are lining up around the same location. And just like in real estate "Location! Location! Location!" is the adage; in markets, "Confluence! Confluence! Confluence!" is the adage!
Weekly Market Forecast: Short Term Buys, Then Sells! In this video, we will analyze the S&P 500, NASDAQ, AND DOW JONES Futures for the week of April 7 - 11th.
The Stock Market Indices may find support at current levels for a Bear Market Rally. Wait for the market structure shift to the upside before taking any buys. Let the market confirm it's intended direction first, then look for valid buy setups for a short term countertrend play.
Enjoy!
May profits be upon you.
Leave any questions or comments in the comment section.
I appreciate any feedback from my viewers!
Like and/or subscribe if you want more accurate analysis.
Thank you so much!
Disclaimer:
I do not provide personal investment advice and I am not a qualified licensed investment advisor.
All information found here, including any ideas, opinions, views, predictions, forecasts, commentaries, suggestions, expressed or implied herein, are for informational, entertainment or educational purposes only and should not be construed as personal investment advice. While the information provided is believed to be accurate, it may include errors or inaccuracies.
I will not and cannot be held liable for any actions you take as a result of anything you read here.
Conduct your own due diligence, or consult a licensed financial advisor or broker before making any and all investment decisions. Any investments, trades, speculations, or decisions made on the basis of any information found on this channel, expressed or implied herein, are committed at your own risk, financial or otherwise.
Weekly FOREX Forecast: Buy EUR, GBP, AUD, NZD vs USDThis is an outlook for the week of April 7 - 11th.
In this video, we will analyze the following FX markets:
USD Index
EUR
GBP
AUD
NZD
CAD
CHF
JPY
Wait for the market to tip its hand! Monday is a no red folder news day. Great time to let the markets settle on a direction.
Trading a market after a huge push in one direction can be tricky. There is likely to be a pullback before continuing the overall trend. Bear this in mind with the USD.
Enjoy!
May profits be upon you.
Leave any questions or comments in the comment section.
I appreciate any feedback from my viewers!
Like and/or subscribe if you want more accurate analysis.
Thank you so much!
Disclaimer:
I do not provide personal investment advice and I am not a qualified licensed investment advisor.
All information found here, including any ideas, opinions, views, predictions, forecasts, commentaries, suggestions, expressed or implied herein, are for informational, entertainment or educational purposes only and should not be construed as personal investment advice. While the information provided is believed to be accurate, it may include errors or inaccuracies.
I will not and cannot be held liable for any actions you take as a result of anything you read here.
Conduct your own due diligence, or consult a licensed financial advisor or broker before making any and all investment decisions. Any investments, trades, speculations, or decisions made on the basis of any information found on this channel, expressed or implied herein, are committed at your own risk, financial or otherwise.
Bitcoin Elliott Waves Analysis: Short opportunityIn this lengthy video, I discussed the details of labelling and counting of waves for Bitcoin from daily to the 5 mins timeframes. I drilled down to the minuette waves (in orange) on the 5 mins timeframe. Take note that I made a mistake in the actual config of one of the orange waves (setting it as minute instead of minuette). The mistake happened on the 9:15 where I changed the color of the corrective wave A-B-C but did not change the degree.
In this video, I also discussed the alternate counts (in blue) in details.
But while both the primary and alternate counts are both short bias, the target entries (and thus risks) are different. if you are an aggressive trader, and want to trade on the alternate count, your stop will be set above the blue line where the alternate count is invalidated. If you are trading on my primary count, you will want to see reversal pattern (e.g. candlestick reversal) or see rejection at the red line.
In any case, good luck in your trading and remember to keep your risk tight!
Nasdaq Elliott Wave Update on Short Position ManagementIn this video, I go through exactly how I plotted the wave counts that I published on 3rd April (linked to this idea). I also show how to estimate price target using support and Fibonacci extensions. Lastly, I talk about trading productivity again and why I recommend to take out some of your short position.
There are 3 main reasons:
1. We have completed wave 3 of 3 and is now going into wave 4 (and wave 4 are notorious for being unpredictable and may even have triple combinations).
2. We are what? 80% in the money and it happens very fast. So productivity wise, it is good to take some money off the table.
3. Weekend risk.
I am putting this idea as "Neutral" even though I am still expecting a wave 5 down. Reason is because we are in wave 4, and also because I pray that I can find time to update again when wave 4 ends and wave 5 of 3 starts.
Good luck!


