Following the thin neck.I have mentioned many times that I refer to the areas of the Ichimoku clouds
where Senkou Span A and Senkou Span B are closest to each other as the “thin neck.”
The same name can be given to the areas where these lines intersect,
which cause the Kumo cloud to change color.
This is the OTHERS.D/BTC.D/ETH.D chart.
An unusual composite, right?
Look at how the chart reacted to the change in clouds.
How many times did the movement in one direction or
another coincide with the thin neck area?
I have a surprise for you.
The next change in clouds will occur during New Year's week.
Support and Resistance

NVTS: trend structure updatePrice continues to follow through with the trend structure outlined in the Aug–Oct updates, showing an orderly consolidation toward the local support zone and rising moving averages.
If price manages to hold above the 21dEMA, I expect at least one more push higher into the 19–22 resistance zone before a potential longer consolidation and base-building phase.
Alternatively, failure to break out above the October lower high would shift the odds toward the mid-term top being in, suggesting a deeper move into the mid-term support area at 11–9 levels.
Chart:
Previously:
• On mid-term support (Aug 25):
Chart:
www.tradingview.com
• On higher low potential (Sep 26):
Chart:
www.tradingview.com
• On break-out and support (Weekly Chart Review – Oct 10):
Chart:
• On gap-up and follow-through (Oct 14):
Chart:
www.tradingview.com

CRUDE OIL Local Short! Sell!
Hello,Traders!
CRUDE OIL is reacting from the horizontal supply area after liquidity above previous highs was taken. Expect continuation to the downside as the market rebalances toward the target level.
Sell!
Comment and subscribe to help us grow!
Check out other forecasts below too!
Disclosure: I am part of Trade Nation's Influencer program and receive a monthly fee for using their TradingView charts in my analysis.

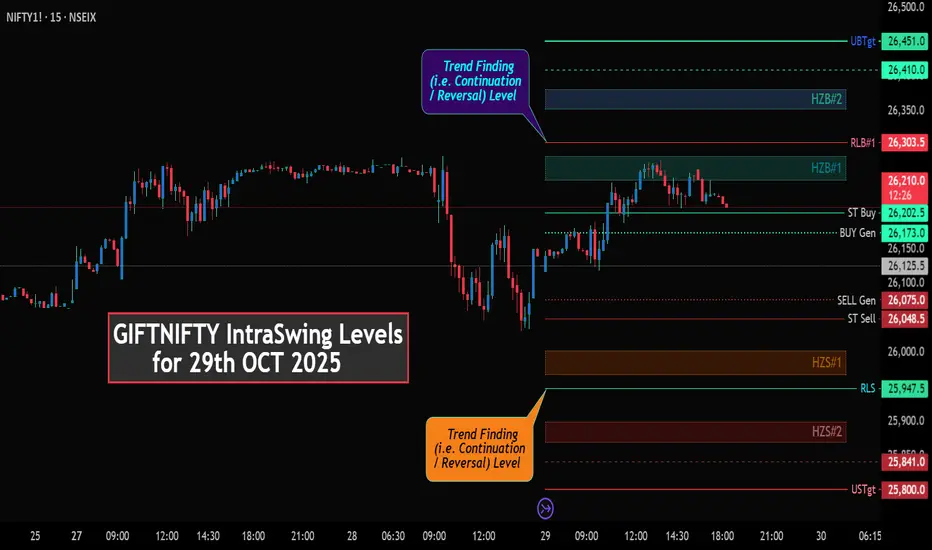
GIFTNIFTY IntraSwing Levels for 29th OCT 2025🌡️Plot Levels Using 3 Min, 5 Min Time frame in your Chart for Better Analysis
L#1: If the candle crossed & stays above the “Buy Gen”, it is treated / considered as Bullish bias.
L#2: Possibility / Probability of REVERSAL near RLB#1 & UBTgt
L#3: If the candle stays above “Sell Gen” but below “Buy Gen”, it is treated / considered as Sidewise. Aggressive Traders can take Long position near “Sell Gen” either retesting or crossed from Below & vice-versa i.e. can take Short position near “Buy Gen” either retesting or crossed downward from Above.
L#4: If the candle crossed & stays below the “Sell Gen”, it is treated / considered a Bearish bias.
L#5: Possibility / Probability of REVERSAL near RLS#1 & USTgt
HZB (Buy side) & HZS (Sell side) => Hurdle Zone,
*** Specialty of “HZB#1, HZB#2 HZS#1 & HZS#2” is Sidewise (behaviour in Nature)
Rest Plotted and Mentioned on Chart
Color code Used:
Green =. Positive bias.
Red =. Negative bias.
RED in Between Green means Trend Finder / Momentum Change
/ CYCLE Change and Vice Versa.
Notice One thing: HOW LEVELS are Working.
Use any Momentum Indicator / Oscillator or as you "USED to" to Take entry.
⚠️ DISCLAIMER:
The information, views, and ideas shared here are purely for educational and informational purposes only. They are not intended as investment advice or a recommendation to buy, sell, or hold any financial instruments. I am not a SEBI-registered financial adviser.
Trading and investing in the stock market involves risk, and you should do your own research and analysis. You are solely responsible for any decisions made based on this research.
"As HARD EARNED MONEY IS YOUR's, So DECISION SHOULD HAVE TO BE YOUR's".
Do comment if Helpful .
In depth Analysis will be added later (If time Permits)
BKKT: price in the support zone to decide on the next movePrice decided to pull back deeper into the support zone, following an alternative path suggested in the October update.
Watching for the nature of the reaction from current levels, as price might be finishing either the entire correction since October highs or just its first wave. In any case, I’m expecting at least a bounce in the coming days.
Chart:
Previously:
• On support (Oct 9, in weekly overview):
Chart:
On support zone and potential start of a new swing (Oct 14):
Chart:
www.tradingview.com

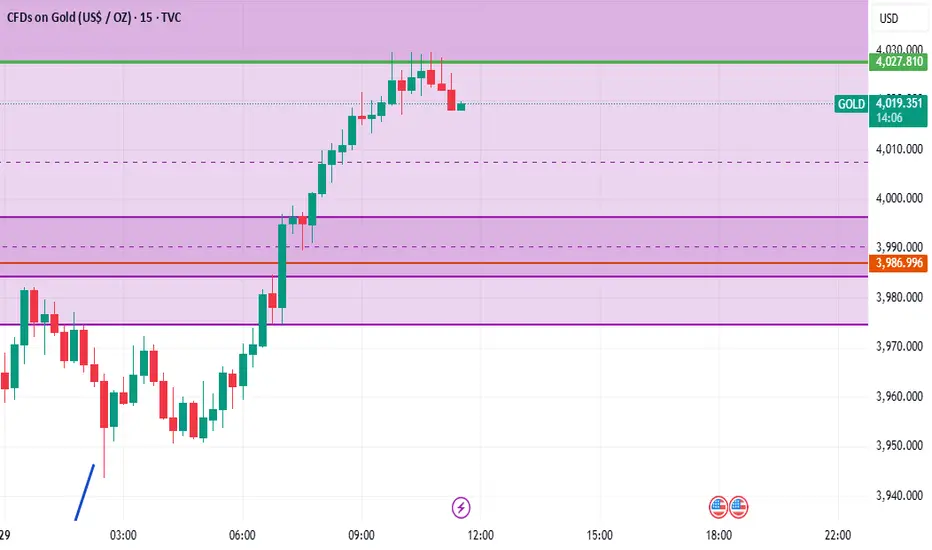
GOLD | Rebounds Above $4,000 Ahead of Fed DecisionGOLD – MARKET OVERVIEW | Rebounds Above $4,000 Ahead of Fed Decision 🪙
Gold futures climbed back above $4,000, rebounding in early trade ahead of the Federal Reserve’s rate decision later today.
The metal gained around 1%, supported by expectations that the Fed will cut rates by 25 basis points, a move that typically boosts demand for non-yielding assets like gold.
Markets have already priced in the rate cut, leaving investors focused on Chair Powell’s comments for clues on whether another cut could follow in December.
Technical Outlook
Gold remains in a bullish momentum as long as the price trades above 4,011, targeting 4,053 initially.
A 1H or 15Min close above 4,053 would confirm further upside toward 4,104.
However, if the price reverses and stabilizes below 3,982, it would shift the bias to bearish, opening the way toward 3,930 → 3,893.
Key Technical Levels
Pivot Zone: 4,011 – 4,016
Resistance: 4,053 · 4,104 · 4,148
Support: 3,982 · 3,930 · 3,893
Outlook:
Gold stays bullish while above 4,011, with potential to extend gains toward 4,104 if the Fed delivers a dovish tone.
But if Powell’s remarks turn unexpectedly hawkish and price stabilizes below 3,982, a deeper pullback toward 3,930–3,893 could follow.


NASDAQ Index Analysis (US100)The NASDAQ index continues its strong bullish trend, currently trading near a new all-time high around 26,140.
📉 A minor correction is expected toward the 26,000 support zone.
If the price breaks and holds below this level, a further decline toward 25,800 is likely.
📈 However, if the price bounces from 26,000, the index may retest the recent high or even create a new record high.
💡 Key Trading Levels:
✅ Buy: On confirmed bounce from 26,000 or 25,800.
🔻 Sell: Below 26,000 after confirmation.
XAUUSD (ONDA) IntraSwing Levels For 29 -30th Oct (2.30 pm) 2025🌡️Plot Levels Using 3 Min, 5 Min Time frame in your Chart for Better Analysis
L#1: If the candle crossed & stays above the “Buy Gen”, it is treated / considered as Bullish bias.
L#2: Possibility / Probability of REVERSAL near RLB#1 & UBTgt
L#3: If the candle stays above “Sell Gen” but below “Buy Gen”, it is treated / considered as Sidewise. Aggressive Traders can take Long position near “Sell Gen” either retesting or crossed from Below & vice-versa i.e. can take Short position near “Buy Gen” either retesting or crossed downward from Above.
L#4: If the candle crossed & stays below the “Sell Gen”, it is treated / considered a Bearish bias.
L#5: Possibility / Probability of REVERSAL near RLS#1 & USTgt
HZB (Buy side) & HZS (Sell side) => Hurdle Zone,
*** Specialty of “HZB#1, HZB#2 HZS#1 & HZS#2” is Sidewise (behaviour in Nature)
Rest Plotted and Mentioned on Chart
Color code Used:
Green =. Positive bias.
Red =. Negative bias.
RED in Between Green means Trend Finder / Momentum Change
/ CYCLE Change and Vice Versa.
Notice One thing: HOW LEVELS are Working.
Use any Momentum Indicator / Oscillator or as you "USED to" to Take entry.
⚠️ DISCLAIMER:
The information, views, and ideas shared here are purely for educational and informational purposes only. They are not intended as investment advice or a recommendation to buy, sell, or hold any financial instruments. I am not a SEBI-registered financial adviser.
Trading and investing in the stock market involves risk, and you should do your own research and analysis. You are solely responsible for any decisions made based on this research.
"As HARD EARNED MONEY IS YOUR's, So DECISION SHOULD HAVE TO BE YOUR's".
Do comment if Helpful .
In depth Analysis will be added later (If time Permits)

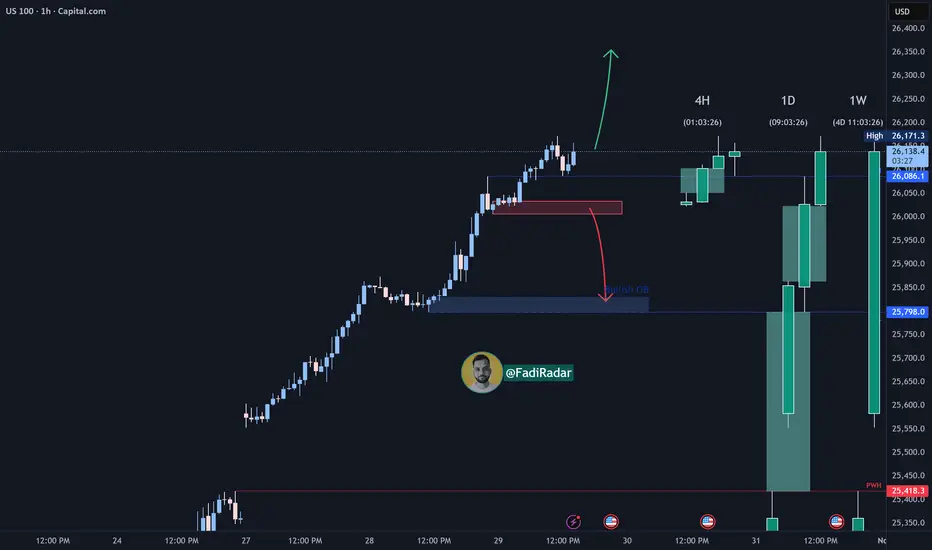
USNAS100 Extends Rally to New All-Time Highs?USNAS100 | Bullish Continuation Toward New Highs
The index recorded a new all-time high (ATH) and has already stabilized above it, supporting further bullish momentum toward 25,400 → 25,550.
The main driver behind the move remains strong corporate earnings.
However, to confirm a bearish reversal, the price must close a 1H candle below 25,170, which would expose 25,100 → 25,010.
A sustained break below those levels could extend the decline toward 24,850.
Pivot Line: 25,230
Resistance: 25,400 – 25,550
Support: 25,100 – 25,010 – 24,860
SOME INSIGHT I POSTED MONDAY YOU CAN GO THROUGH
SOME INSIGHT I POSTED MONDAY YOU CAN GO THROUGH
Gold showed a buy signal last Thursday because it was supposed to sell and it failed, that is a buy signal there but it comes with technicalities, so immediately i saw it, i posted buy around 4090 and i guess price retraced down to 4091.7 and started buying and hit around 4140 and i thought it would buy more( but it was a buy to create a lower high which start like a major buy until it fails to move above a zone), but it closed somewhere around 4130 and after analyzing Thursday evening i realized, it will buy friday, but it would sell to test a major zone before the buy start with momentum so signaled a sell first before the buy Thursday,
On Friday midnight to dawn i gave a sell to somewhere 4050 and i gave a buy around morning time and was firm on that and entry was at 4065-60 sl was at 4040, and CPI drops in the afternoon , i thought what if CPI pushes it below 4040 with a sharp move before the buy start because i strongly believed it will buy but CPI is a dangerous news.
Immediately CPI dropped it moved up so I went to check the CPI and saw that m/m data was lower than expected and previous which is disinflation short term and therefore a possible bearish gold short term and y/y CPI was higher than previous which is inflationary long term and therefore a bullish gold after the short term sells, and so i anticipated the sells especially after price failed to close above 4130 but i still needed a confirmation and an hour or two after markets opened yesternight it signaled sells and thus today sells.
So there is a possible heavy buy lately by early next month which will be driving by the y/y CPI and an already priced in Fed's rate cut this Wednesday and a higher time frame buy , i don't trade only based on fundamentals, i check to see if they will lead to a change of trend and to be alert but my trades and analysis are pure price action/ technical analysis and no indicator , my brain and eyes always work together to determine price next possible move and not any indicator
DOGECOIN H1 SELLAfter a sharp decline and a slow correction, I expect the price to fall to the specified target.

EURJPY SHORT After seeing the previous daily candle close bearish below the low of the last bullish candle we could expect price to continue selling off since we saw a rejection at a key weekly level

S&P500 INDEX | Bulls in Control Above 6,889 Ahead of Fed CutSPX500 – MARKET OVERVIEW | Bullish Momentum Builds Ahead of Fed Decision 🇺🇸
Barclays equity strategists believe stocks will continue their strong rally into year-end, despite some “pockets of froth.”
The Federal Reserve is widely expected to cut interest rates later today, with growing speculation it may also slow or end balance sheet reduction, further supporting risk assets.
Technically, the SPX500 has stabilized above 6,889, confirming bullish momentum and signaling potential continuation toward 6,941 and 6,991.
As long as the index trades above 6,889, the bias remains bullish.
However, to shift toward a bearish trend, the price would need to stabilize below 6,889, which could trigger a decline toward 6,842 and 6,755.
Key Technical Levels
Pivot Line: 6,889
Resistance: 6,941 · 6,991
Support: 6,843 · 6,760
Outlook:
SPX500 remains bullish above 6,889, supported by expectations of a Fed rate cut and year-end equity strength.
A confirmed break below 6,889 would shift momentum to bearish, targeting deeper corrections toward 6,842–6,755.

AUDUSD: Major Resistance.Hello everyone,
Lets take a sight on AUDUSD, the pair is presently at the resistance zone. in regards to the structure the price have respected this level for several times, qualifying it as the major resistance. we assume this as opportunity to short.
However we look forward for a clear confirmation.
Key Points;
A confirmed retracement below the resistance would set off downward movement to 0.6482 as potential target.
Thanks for reading.


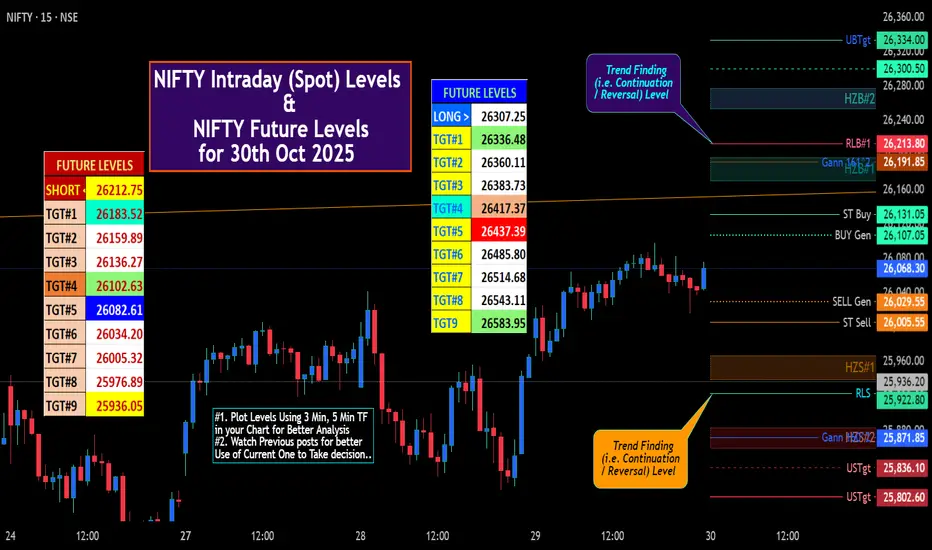
NIFTY IntraSwing (Spot) Levels & Future Levels for 30th Oct '25🚀 "NIFTY Future Levels for 30th Oct 2025" mentioned in BOX format.
🌡️Plot Levels Using 3 Min, 5 Min Time frame in your Chart for Better Analysis
L#1: If the candle crossed & stays above the “Buy Gen”, it is treated / considered as Bullish bias.
L#2: Possibility / Probability of REVERSAL near RLB#1 & UBTgt
L#3: If the candle stays above “Sell Gen” but below “Buy Gen”, it is treated / considered as Sidewise. Aggressive Traders can take Long position near “Sell Gen” either retesting or crossed from Below & vice-versa i.e. can take Short position near “Buy Gen” either retesting or crossed downward from Above.
L#4: If the candle crossed & stays below the “Sell Gen”, it is treated / considered a Bearish bias.
L#5: Possibility / Probability of REVERSAL near RLS#1 & USTgt
HZB (Buy side) & HZS (Sell side) => Hurdle Zone,
*** Specialty of “HZB#1, HZB#2 HZS#1 & HZS#2” is Sidewise (behaviour in Nature)
Rest Plotted and Mentioned on Chart
Color code Used:
Green =. Positive bias.
Red =. Negative bias.
RED in Between Green means Trend Finder / Momentum Change
/ CYCLE Change and Vice Versa.
Notice One thing: HOW LEVELS are Working.
Use any Momentum Indicator / Oscillator or as you "USED to" to Take entry.
⚠️ DISCLAIMER:
The information, views, and ideas shared here are purely for educational and informational purposes only. They are not intended as investment advice or a recommendation to buy, sell, or hold any financial instruments. I am not a SEBI-registered financial adviser.
Trading and investing in the stock market involves risk, and you should do your own research and analysis. You are solely responsible for any decisions made based on this research.
"As HARD EARNED MONEY IS YOUR's, So DECISION SHOULD HAVE TO BE YOUR's".
Do comment if Helpful .
In depth Analysis will be added later (If time Permits)
THE KOG REPORT - UpdateEnd of day update from us here at KOG:
Simple one this evening. Yesterday we wanted to see which way it broke, the red boxes activated, the short hit target, we then got the TAP AND BOUNCE, red box activated with the hot spot and Excalibur, and BOOM! RIP And FLIP.
Now, support below at the 3930 level with resistance 3955 could be the play but the close here is important! The pull back here is huge, all the way up to the level of 4050 which needs to break to change the structure, otherwise, more downside is on the horizon.
From Camelot this morning:
Red boxes:
Break above 3909 for 3920✅ and 3933✅ in extension of the move
Break below 3890 for 3865, 3955 and 3848 in extension of the move
As always, trade safe.
KOG

HYPE/USDT: Rejection at 50.000 Keeps Sellers in Short-Term ContrHYPE/USDT is facing rejection near the 50.000 resistance zone, showing signs of weakening momentum after a strong rebound. Price remains within a downward structure, and the recent compression pattern points to buyer exhaustion.
If the pair fails to hold above 47.000, a drop toward the 42.000 support zone becomes more likely. Sellers remain in control as long as price stays below the 50.000 resistance level.

AUD/CAD: Overextended Rally Eyes Resistance Near 0.9227AUD/CAD is approaching the 0.9227 resistance zone following a clean breakout from its previous range. However, price action now appears overextended, with signs of exhaustion forming near last month’s high.
A rejection from this area could prompt a pullback toward 0.9166, aligning with the lower trendline support. With momentum fading, buyers may begin taking profits ahead of this key resistance level.

GOLD → The market is testing 4K ahead of the Fed's decision FX:XAUUSD is testing $4,000 ahead of the Fed's decision, partially recovering from a 3.5% drop this week. The fundamental backdrop is mixed, but technically, the signs of a bull market are positive.
Key factors : Fed decision (today): A 25 bps rate cut is expected, but the main focus is on the vote count and Powell's comments.
A dovish scenario (emphasis on risks to the labor market) will support gold. A hawkish surprise will reinforce the correction. Trump-Xi meeting (tomorrow): Statements about lowering tariffs weaken demand for defensive assets.
Gold is in limbo; in the second half of the European session and the beginning of the US session, the market may enter a phase of stagnation. Growth is only likely if the Fed takes a soft tone, while progress in trade negotiations or a hawkish surprise from the Fed will prolong the correction.
Resistance levels: 4015, 4050, 4085
Support levels: 3975, 3945, 3900
If the bulls can hold their ground above 4K, we will see strong support, in which case growth to 4050-4100 may be triggered. Otherwise, the market may form a correction to 3975-3945. It is worth keeping an eye on comments from Powell and Trump... Volatility will be high...
Best regards, R. Linda!

POTENTIAL FOR THE GOLD MARKETXAU/USD 4H - As you can see I have marked out two potential outcomes for this pair on how I feel price could play out over the course of the next few days, both setups are valid and seem realistic.
Setup B is the most likely setup in my eyes and this is because I feel price is exhausted, the Demand in the market is running out, hence the big move to the downside. I feel price will have to come lower in order to pick up more Demand before the next bull run.
However price has traded down and into a Demand Zone and we are seeing large amounts of volume being introduced, and with the current state of the US economy the Gold Spot could still just be out-powering the Dollar.
Setup A would be following the prevailing trend and overall be a safer option as this market is bullish dominant but its important we wait for entry confirmation before we execute, looking for the break to the upside first followed by a pullback.

XAU/USD
Good morning, traders! ☀️
In today’s gold analysis, I’m watching for a potential bounce around the 4012–4020 zone, which aligns with a key resistance level and the 0.5 Fibonacci retracement. Ideally, I’d like to see price move down toward the 3982 support area, where the 0.382 Fib level sits, before aiming for a bullish reversal.
With major news events on the calendar today, many traders are eyeing lower zones on the chart to position themselves long. Stay sharp and manage your risk—reducing your lot size is crucial in volatile conditions if you want to protect your account.
Wishing you all a profitable and disciplined trading day! 🚀📈
