GBPUSD SHORT Market structure bearish on HTFs 3
Entry at Both Weekly and Daily AOi
Weekly Rejection at AOi
Previous Weekly Structure Point
Daily Rejection at AOi
Around Psychological Level 1.33500
Touching EMA H4
H4 Candlestick rejection
TP: WHO KNOWS!
Entry 100%
REMEMBER : Trading is a Game Of Probability
: Manage Your Risk
: Be Patient
: Every Moment Is Unique
: Rinse, Wash, Repeat!
: Christ is King..
Support and Resistance

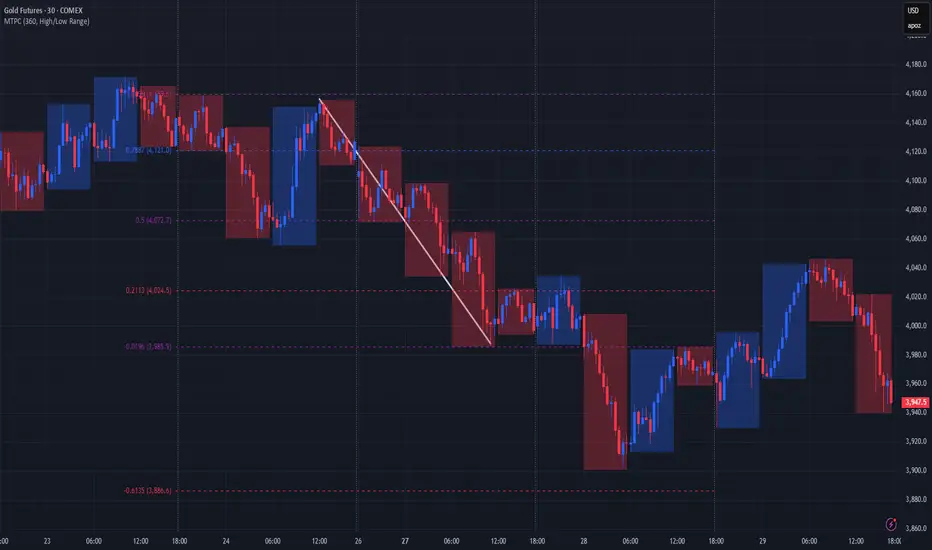
A better alternative to Fibonacci grid🙏🏻 Fibonacci based grid is a great inspiration from the Universe, but imo ain’t the final product, and here it is:
For traders
Use these values above and put em into grid tool here, and you’ll end up with uniform distribution based grid:
1.6134612334371357
1.0196152422706632
0.7886751345948129
0.5
0.21132486540518708
-0.019615242270663247
-0.6134612334371357
Then about how to apply it, you can divide trading activity by analytical units, these are in turn are based on:
^^ by price
^^ by time
^^ by signed volume waves/volume delta
Explanation
If you’ve followed my latest work you know I’ve identified a way to combine higher order moments to construct natural data driven estimates of data’s extremums and “ever possible” values (I still got no idea how no1 Ever posted it anywhere over the last centuries).
Now imagine you got only 2 input values: actual max and min (just like in Fibo grid, it ain’t knows nothing else). Given only these 2 values we can model stuff with uniform distribution that has precisely known values of standardized moments, so we end up with (and remember that uniform distro is symmetric around its mid, so all odd moments are zero):
dev = 1 / math.sqrt(12) //standard deviation
kurt = 1.8 //kurtosis (not excess ofc, the raw one)
hkurt = 27 / 7 //hyperkurtosis, 6th moment, raw af as well
0.5 + dev * hkurt
0.5 + dev * kurt
0.5 + dev
0.5
0.5 - dev
0.5 - dev * kurt
0.5 - dev * hkurt
And the resulting output of it u seen at the beginning of the post, notice how the edges *almost* match your lovely golden ratio.
For wanderers:
Now for the wanderers, creators etc etc etc
We might have a new math constant in our hands.
This can’t be a coincidence that limit levels (the ones at the edges) almost match the golden ratio . What if we find some kind of ‘almost’ uniform distro, where the limit levels would ‘exactly’ match the golden ratio? No problem - Beta distribution with parameters alpha = beta = (smth just a bit greater than 1).
I solved it numerically in python with mpmath library (necessary for high precision stuff, default packages are gonna truncate too much and we work with gamma functions there, high powers, huge numbers).
The following constant used as both parameters for Beta distribution provides us an almost uniform beautiful distro, with a minimal necessary deviation from uniform distro if u pls, just with a lil bit gently smoothed corners, and all connected to fibonacci sequence and golden ratio:
1.013156499304251804283836146883597463164059088989506487984660881392552993230097518061037104047261922219476043198153474114525730243848097530913517155085537693517359999905511951459927003624291626547046737804828112785002512650…
… and it goes on and on. I called it Sagitta constant, because visually it creates that beautiful almost flat shape, the minimal natural curvature. And now if we put this as c in Beta(c, c) following the same levels construction method from before we get these levels:
std = 0.28741741
K = 1.80628205
Hk = 3.88993123
0.5 + std * hk = 1.61803398
0.5 + std * k = 1.01915692
0.5 + std = 0.78741741
0.5 = 0.5
0.5 - std = 0.21258258
0.5 - std * k = -0.01915692
0.5 - std * hk = -0.61803398
Visuals, plots, graphics
^^ here you can see how our resulting distro & derivatives look like, kinda cute aye?
Beta(c, c), where c is our constant Sagitta, actually might be a natural prior for Bayesian stuff, almost a boxcar windowing function for DSP so u gonna tame that famous spectral leakage, or a kernel for KDE, like u name it, every case when u need a uniform shape yet with slightly relaxed endpoints, you can use it in design and architecture.
Go for it bros, test it in your R&D. Maybe some1 gonna use it to prove Riemann assumption conjecture , if u get dat milli send me 25% ima find a good use for it.
∞
Gold is Ready For Bull From SupportHello Traders
In This Chart GOLD HOURLY Forex Forecast By FOREX PLANET
today Gold analysis 👆
🟢This Chart includes_ (GOLD market update)
🟢What is The Next Opportunity on GOLD Market
🟢how to Enter to the Valid Entry With Assurance Profit
This CHART is For Trader's that Want to Improve Their Technical Analysis Skills and Their Trading By Understanding How To Analyze The Market Using Multiple Timeframes and Understanding The Bigger Picture on the Charts

CAD-CHF Short From Supply Area! Sell!
Hello,Traders!
CADCHF Price has reacted from a horizontal supply area, showing early signs of distribution. A short-term retracement is expected as liquidity below the recent swing lows gets targeted. Time Frame 2H.
Sell!
Comment and subscribe to help us grow!
Check out other forecasts below too!
Disclosure: I am part of Trade Nation's Influencer program and receive a monthly fee for using their TradingView charts in my analysis.

GBPAUD RISKY LONG|
✅GBPAUD Price created a triple-bottom formation at discount levels, signaling strong bullish rejection from demand. Expect a short-term rally targeting liquidity above the recent highs. Time Frame 2H.
LONG🚀
✅Like and subscribe to never miss a new idea!✅

EURAUD WILL GROW|LONG|
✅EURAUD Price tapped into the demand zone and showed a bullish reaction, confirming short-term accumulation. Expect continuation higher toward the next liquidity pocket near the target zone. Time Frame 2H.
LONG🚀
✅Like and subscribe to never miss a new idea!✅

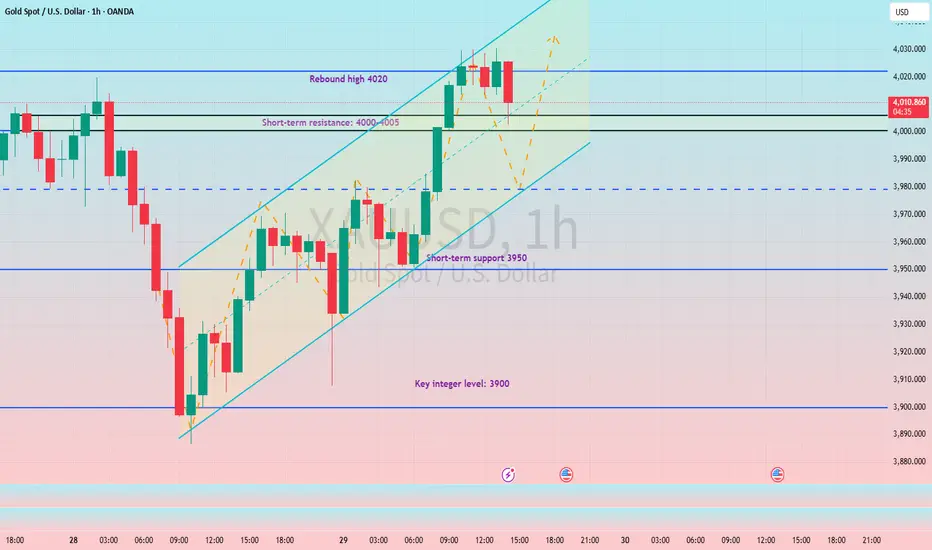
Watch for support at 3990-3980 to consider going long on gold.#XAUUSD TVC:GOLD OANDA:XAUUSD
Gold prices have repeatedly tested the 4030 level without a successful breakout. Gold has now begun to decline, with short-term bears gradually releasing their momentum. Further downside is expected, with support expected in the 3990-3980 range. If gold prices can pull back to this range in the short term, we can consider going long on gold in anticipation of a rebound. Target range: 4030-4050
EUR-GBP Free Signal! Sell!
Hello,Traders!
EURGBP formed a clean double-top structure at premium pricing and broke below the neckline with momentum, signaling bearish intent. The move targets a key imbalance zone below.
-------------------
Stop Loss: 0.8818
Take Profit: 0.8783
Entry: 0.8804
Time Frame: 1H
-------------------
Sell!
Comment and subscribe to help us grow!
Check out other forecasts below too!
Disclosure: I am part of Trade Nation's Influencer program and receive a monthly fee for using their TradingView charts in my analysis.


Nasdaq Computer sector & Nasdaq nearing pullback areaNasdaq Computer (IXCO) Is nearing pullback territory (23,717 resistance). IXCO being the largest sector in Nasdaq (IXIC) means the composite index, now that it's over previous resistance, is also looking for a pullback into support (20,160).
It's possible IXCO will break resistance next year and if that happens whatever gains are made will be lost on an eventual drop back into support.
If you have call options on NVDA or other tech companies closing them when IXCO hits 23,717 is highly advisable. If it hits there around this January it could be 2 years before IXCO resumes the uptrend past 23,717. Calls will likely get destroyed during this time.
Another note is lots of tech IPOs are occurring this year with lofty valuations. When this IXCO pullback comes they are likely to get hit hard. It's a great opportunity to short or wait to buy up the ones you like when the pullback is over.
As always good luck and try your best to avoid getting into new tech related trades as this year ends. It's going to be a great idea to have cash ready next year.

Strategic positioning ahead of the Fed decision
News:
The Federal Reserve's interest rate decision is poised to trigger significant market volatility today.
Gold prices remain bearish after three consecutive days of declines. The Fed will announce its monetary policy decision on Wednesday.
This week's expectations for the Fed meeting focus on two points: a 25 basis point rate cut, and, given the growing disagreement among policymakers regarding the future path of interest rates, Powell is unlikely to provide any clear guidance.
Powell hinted earlier this month that the FOMC will continue to focus on threats to the labor market. Last week's weaker-than-expected inflation report may temporarily dampen hawkish rhetoric within the Fed regarding inflation.
Due to the US government shutdown, Fed officials have been unable to obtain complete data on the labor market since early September.
Specifically:
Gold prices have fallen below $4,000/oz. In the coming weeks, gold prices may fall further towards the $3,850-$3,800/oz range. Unless a strong rebound occurs, the short-term outlook remains bearish.
Looking at the 4-hour chart, gold prices previously fell along a descending slope from a high of $4,155, reaching a low of $3,886 before forming a V-shaped rebound. During this rebound, Fibonacci retracement levels formed a clear "stepped resistance-support" pattern.
If inflation subsequently rises, or the labor market tightens again, causing the market to downgrade the consensus from "two rate cuts this year" to "one," the dollar and long-term interest rates will rise, and gold will return to below the upper edge of the descending channel. The consolidation phase, where time is used to create space, will be prolonged, and the $4,050-$4,090 range will evolve into a "strong resistance box," with multiple attempts to break through it failing to hold.
Trading strategy:
Buy: 4025-4035, SL: 4050, TP: 3920-3880-3820
If the price of gold does not retrace to the target level before the speech, then a short position can be established at the current price.

XAUUSD ForecastGold has broken out of the descending wedge pattern, signalling a potential bullish reversal. Price is currently retesting the breakout zone near the 3,980–4,000 support area. A successful bounce from this level could trigger an upward move toward the first target at 4,045 and the second target around 4,100. Holding above the retest zone will confirm bullish momentum continuation.
"Thank you for your support! If you found this idea valuable or learned something new, please consider liking and leaving a comment. I’d really appreciate hearing your feedback and thoughts

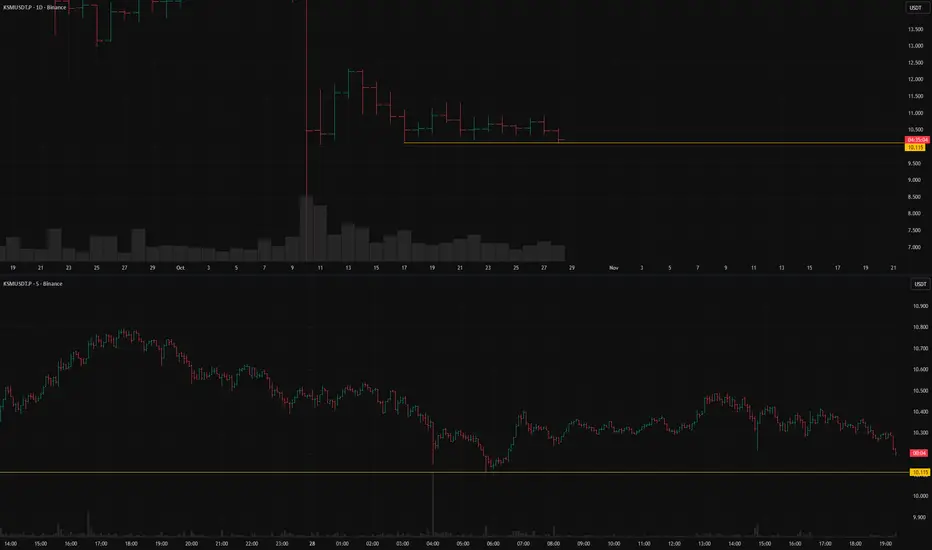
KSMUSDT.P: short setup from daily support at 10.115BINANCE:KSMUSDT.P remains in consolidation, clearly confirming the level — no false breakouts or sweeps, just consistent touches and short pullbacks. The asset has held this structure for nearly two weeks and will eventually break out. In my view, the likely scenario is a short below 10.115.
Today, the asset has already tested the level once and is gradually approaching it again. Maintaining low volatility during this approach will be important.
Key factors for this scenario:
Global & local trend alignment
Volatility contraction on approach
Prolonged consolidation
Was this analysis helpful? Leave your thoughts in the comments and follow to see more.
1:2 Risk Reward Buying USD CAD in bull channelSimple trade, buying USDCAD in bull channel at bottom of bull channel with RR of 2

Bitcoin Buy signal now near 111K lowWe are approaching a significant fundamental event—the release of key news—which introduces a high degree of short-term volatility risk. This event could trigger a sharp, downward price spike that may hit our stop-loss levels.
However, our technical analysis is currently generating a high-probability buy signal, independent of the upcoming news. The chart structure suggests substantial upside potential is developing.
Therefore, we are executing a calculated contrarian trade based on the technical setup. We are entering a long position here with a tightly defined stop-loss to strictly manage the elevated event-driven risk. The trade is structured to capitalize on the significant technical upside potential, offering a favorable risk-to-reward ratio should the bullish technical outcome materialize after the initial volatility subsides.
DISCLAIMER: ((trade based on your own decision))
<<press like👍 if you enjoy💚

SLP LAST CALLS for that +800% pump After a prolonged and exhaustive bear market characterized by deep, consistent monthly declines, NASDAQ:SLP is now trading at a level we identify as a historical price floor. Such severe and sustained downtrends often culminate in a state of maximum investor capitulation, which typically precedes a major trend reversal.
The asset is now fundamentally positioned for a significant mean reversion. From a technical perspective, the risk-to-reward profile at this juncture is exceptionally compelling. A recovery of +800% from these levels is not merely speculative; it aligns with a classical measured move target derived from the scale of the prior downtrend and would represent a natural recalibration toward the asset's historical mean.
All technical indicators suggest that the conditions are ripe for a powerful bullish reversal. A breakout above the nearest significant resistance level would be the confirming signal that this new upward impulse has commenced.
DISCLAIMER: ((trade based on your own decision))
<<press like👍 if you enjoy💚

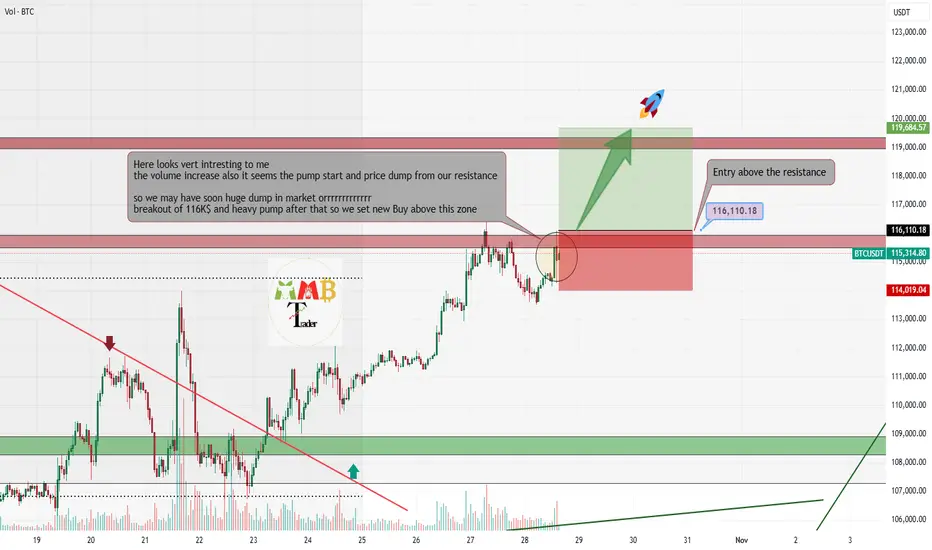
Bitcoin next hours can bring massive dump or Pump!!!The upcoming trading session is critical for Bitcoin as price approaches the significant $116,000 resistance zone. We are observing a notable increase in trading volume, which often serves as a precursor to a decisive price movement.
This volume surge ahead of a key level increases the probability of a bullish resolution. Our primary scenario anticipates a potential breakout. A confirmed daily close above $116,000, supported by sustained high volume, would validate this breakout and could initiate a strong bullish impulse.
In alignment with this thesis, we have strategically placed a buy-stop order above the $116,000 resistance. This order will only activate upon a valid and confirmed breakout, ensuring we are positioned for a potential continuation upward.
Conversely, as part of robust risk management, we must acknowledge the alternative scenario. Should the $116,000 resistance hold and provoke a bearish rejection, a breakdown below the $113,000 support level would become the expected outcome. This would signal a failure of the bullish attempt and likely trigger a short-term corrective move.
DISCLAIMER: ((trade based on your own decision))
<<press like👍 if you enjoy💚
SHIB the dead coin soon again will pump hardSHIB has been undergoing a prolonged period of consolidation, characterized by low volatility and a notable absence of significant bullish momentum over recent months. Such phases of compression and quiet price action often occur after a prior trending period and typically precede a new directional move.
Technical analysis suggests this accumulation phase may be nearing its conclusion. We are now monitoring for a potential catalyst that could trigger a robust bullish impulse. The anticipated outcome of such a move would be a decisive breakout, likely manifested as a series of strong bullish candles, propelling the asset toward the predefined technical targets established on the chart.
DISCLAIMER: ((trade based on your own decision))
<<press like👍 if you enjoy💚

Opendoor Technologies (OPEN) – Bulls Still Holding the Door OpenWhat a ride it’s been for OPEN!
Back in early July 2025, the stock finally broke above its 50-day MA, and that was the spark that started an incredible rally — all the way to a major resistance zone from June 2022.
Then, as always, the market had to test everyone’s patience — a shooting star reversal formed, price pulled back into the 0.382–0.5 Fibonacci zone, and built a solid double bottom.
Once that double bottom broke out around 13–14 August, it was rocket fuel — a massive +247% run until 11 September 2025! 🚀
Since that peak, OPEN has been cooling off — retracing with low volume and shaping a falling wedge, which usually hints at bullish continuation. The price even bounced at EMA-50 and printed a hammer candle, showing that buyers are still defending the trend.
As long as the price holds above $6.23 (hammer support), bulls are still in charge.
Break that level? Then the bears might finally get a turn.
Until then — the door’s still open for another breakout! 😉
Trade Idea 💡
Bullish scenario: Wait for a breakout above the falling wedge with volume — that’s your green light.
Support to watch: $6.23 (hammer low).
Stop loss: Just below that support.
Take profit: Trail as long as price stays above the MA-50 or aim for the $13.70 zone .

DraftKings Wave Analysis – 29 October 2025- DraftKings reversed from support area
- Likely to rise to resistance level 32.45
DraftKings recently reversed up from the support area between the long-term round support level 30.00 (which has been reversing the price from August of 2024) and the lower daily Bollinger Band.
The upward reversal from this support area created the daily Japanese candlesticks reversal pattern Hammer.
Given the strength of the support level 30.00, DraftKings can be expected to rise to the next resistance level 32.45 (former support from the start of October).

NVDA Wave Analysis – 29 October 2025- NVDA opened with the upward gap
- Likely to rise to resistance level 215.00
NVDA stock opened today with the sharp upward gap, which follows the earlier breakout of the resistance zone between the resistance levels 193.75 and 200.00.
The breakout of the these resistance levels accelerated the active impulse wave iii of the extended intermediate impulse sequence 5 from April
Given the overriding daily uptrend, NVDA can be expected to rise to the next resistance level 215.00 (target price for the completion of the active impulse wave iii).

COAI Buy/Long Setup (2H)First of all, you should know that this is a highly volatile and risky asset, so you need to enter the position in a way that if it hits the stop loss, you only lose about 1–2% of your capital, or even less | so manage your risk carefully.
The marked entry zones are considered strong supports for this coin, which could potentially lead to good profits. You should enter in spot, as this coin has wide zones.
Targets are shown on the chart.
For risk management, please don't forget stop loss and capital management
When we reach the first target, save some profit and then change the stop to entry
Comment if you have any questions
Thank You

