GOLD → Retest 4060 within the range. What are the expectations?FX:XAUUSD is forming a correction from the Asian session, with the price testing the important 4060 zone ahead of two key events: US inflation data (CPI) and the results of US-China trade negotiations.
Key factors: US inflation (CPI): Low data will support gold (expectations of two cuts in 2024), but high figures will strengthen the USD and weaken gold (rates for a rate cut in December will decline).
Progress in negotiations between China and the US could weaken gold, while failure would bring back demand for safe havens. US sanctions against Russian oil are supporting oil prices and inflation expectations.
Gold is in wait-and-see mode. Growth is likely with weak CPI or a failure of negotiations. Strong CPI and progress in trade will reinforce the correction. The mood remains cautious ahead of events.
Resistance levels: 4090, 4150, 4163
Support levels: 4060, 4002
The important zone of 4060 - gold is forming a false breakdown. If the bulls hold their defense above this zone, it could trigger growth towards the resistance of the range. Otherwise, we can expect a retest of 4000K, and the reaction should be aggressive...
Best regards, R. Linda!
Support and Resistance

BITCOIN → Trend support broken. Consolidation...BINANCE:BTCUSDT.P is consolidating below the previously broken uptrend line. There are no clear signs of the correction ending or the presence of a strong bullish player. A retest of resistance is forming...
Bitcoin is forming a trading range of 111650 - 107377 (106270). There is no clear bullish pattern at the moment, and we are seeing a correction to resistance before a possible decline to the liquidity pool of 106270, which is formed by consolidation and a retest phase. There are two key zones ahead: 111650 and 113600. Resistance at 111650 has been confirmed, but if this zone does not hold the price, it will be necessary to monitor the upper boundary. A false breakout could trigger a pullback. The cryptocurrency market currently looks somewhat weak due to the phase of uncertainty and doubts about policy.
Resistance levels: 111650, 113600
Support levels: 108650, 107375, 106270
Market behavior indicates that a consolidation phase is currently developing within the local downtrend. A breakout of 113K and consolidation above 113500 could confirm a trend reversal, but there are no such signals at the moment. I consider a pullback to the zone of interest from resistance to be a priority.
Best regards, R. Linda!

Weekly crypto review: BTC trend structure Price continues to move in line with the main scenario discussed in previous weekly updates.
As long as the structure remains constructive and key supports hold, I'll be holding the base hypothesis of correction completion and gradual trend recovery as a prime one.
In this scenario, over the coming weeks and into Q4, I’d like to see:
• price holding above local support;
• breakout and consolidation above the 21-day EMA and 50-day MA;
• gradual movement toward next resistance zones — 115–120K, followed by 123K+.
Key levels:
• Local support: 109–107K
• Local resistance: 114–116K, then 120–123.5K
• Macro support zone: 102K
A breakdown below local support may trigger another retest of the lower boundary of the macro-support zone.
If weekly closes occur below 102K, it would notably increase the probability that the current long-term uptrend cycle is ending and a macro-correction phase is beginning.
Daily time frame:
Weekly:
Thank you for your attention — wishing everyone a calm weekend and a productive start to the new week!

GBPUSD (Oct 25, 2025) — Two Possible Scenarios AheadGBPUSD is completing a contracting structure on the 4H chart.
Price is approaching point D, where two outcomes are possible:
1️⃣ Direct Bullish Breakout — price holds above 1.33 and targets 1.3650–1.38 zone.
2️⃣ Short-term Sell then Bullish Rally — a fakeout below D before wave E reversal.
Both cases point toward a medium-term bullish structure developing.
Market confirmation will decide the next leg — stay patient and disciplined.
Bias: Bullish after D
Timeframe: 4H
Pair: GBP/USD
#GBPUSD #WaveAnalysis #PriceAction #ElliottWave #ForexTrading #SmartMoneyConcept #TechnicalAnalysis #TraderMindset #ForexCommunity

Possible rebound idea from major resistance Possible rebound idea from major resistance , GPBUSD is expected to test the resistance highlighted in chart and rebound from it to break last low on 4h frame

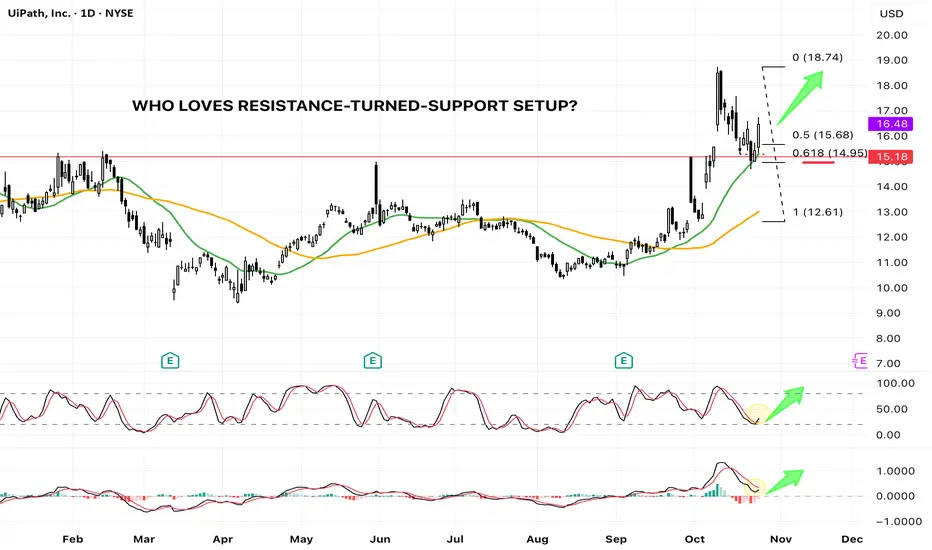
PATH - Textbook R/S Flip at Key Fib & MA Support (Bullish Setup)UiPath ( NYSE:PATH ) spent the majority of 2025 range-bound, oscillating between the $10 and $15 marks. This consolidation phase ended dramatically in early October, when the price decisively breached the long-standing 2025 horizontal resistance at approximately $15.
The breakout led to a swift rally, tagging a new year-to-date high of $18.74 . Following this strong move, the stock began a healthy retracement, pulling back to test the very level that had previously acted as resistance—the classic Resistance-Turned-Support (R/S Flip) setup.
The Confluence of Support
This current pullback is resting on a powerful confluence of technical supports, significantly increasing the probability of a bullish continuation:
1. Horizontal Support: The previous major resistance line (around $15) now acts as a crucial horizontal support.
2. Moving Average Support: The price is testing the 20-day Simple Moving Average (SMA 20, Green Line) . Importantly, this is the first time the price has pulled back to the SMA 20 since the bullish SMA 20/SMA 50 Golden Cross , signaling a strong trend retest.
3. Fibonacci Golden Pocket: The retracement has landed perfectly into the 0.618 Fibonacci Retracement level (from the $12.61 swing low to the $18.74 swing high), a statistically significant reversal zone often called the "Golden Ratio."
Momentum Indicators Confirm Bullish Bias
Beyond the price action, our auxiliary indicators are flashing constructive signals:
* Stochastic: The Stochastic oscillator is reversing from the oversold territory and is showing a clear bullish cross , indicating waning selling pressure and the start of a new upward momentum cycle.
* MACD: The Moving Average Convergence Divergence (MACD) indicator is attempting a bullish cross above the zero line , a powerful sign of increasing positive momentum.
Conclusion
The confluence of price action and indicator signals presents a high-probability bullish setup. The market is currently rewarding the successful test of the R/S flip at the 0.618 Fib and SMA 20 support.
While this setup suggests a strong likelihood for the next leg higher, traders must remember that trading involves probabilities. A clearly defined stop-loss is essential to manage risk should the market invalidate this robust support zone.
NASDAQ: CEG — Strong Rebound from Support, Uptrend Still Intact?On the daily chart, CEG found solid support and began to rebound.
The September price action shows a clear higher high, higher low structure — confirming a healthy uptrend. The upward trendline (green) continues to act as reliable dynamic support.
In October, the stock broke above the previous horizontal resistance (red dotted line), and recent pullbacks have retested the same level as support — a classic resistance-turned-support setup.
After a successful retest of the horizontal support line — which coincides with the Fibonacci 0.618 retracement zone — the latest candle closed back above the 20-day SMA (purple), reaffirming that the uptrend remains firmly intact.
Friday’s session showed strong momentum with a gap-up and a full-bodied bullish candle, signaling renewed buying interest.
Overall, the uptrend remains valid, and this rebound from support may mark the beginning of the next leg higher.

Ethereum weakened or holding structure? | ETH 1H Analysis👋🏻 Hey everyone! Hope you’re doing great! Welcome to SatoshiFrame channel.
✨ Today we’re diving into the 1-Hour Ethereum analysis. Stay tuned and follow along.
👀 We observe Ethereum on the 1-hour timeframe. After breaking and stabilizing at the $3,889 zone, Ethereum formed a higher low on this area and is now moving along a trendline (dynamic support), with an important static resistance at $3,982.50. Price has reacted to this level once but has not succeeded in breaking it!!!
🧮 Using the RSI oscillator is a reasonable approach in this situation. Since Ethereum is currently in a box/trading range, a breakout requires entering overbuy territory and surpassing the 70 level. Note that there is a significant oscillation support below the average, at the 44.5 zone, which holds strong validity and represents our swing low.
🐷 Pay attention to Ethereum’s volume. To break the specified zone, Ethereum needs to show a strong reaction, fill sell orders, and liquidate futures contracts. Therefore, we need buyer market makers to support the breakout, causing volume to increase through a price jump.
✍️ The scenario forming for Ethereum may require some patience and could play out differently, because we are now facing the second touch of this level, so the win rate of this scenario may be slightly lower.
🟢 Long Position Scenario
Breaking Ethereum’s resistance at $3,982.50 along with surpassing the 70 RSI level and seeing a significant increase in buying volume and price squeeze can form a good long position scenario on Ethereum.
❤️ Disclaimer : This analysis is purely based on my personal opinion and I only trade if the stated triggers are activated .

Frank: HTF has enough fuel to jump it up!Hello Traders,
As you might have seen the HTF zone was strong enough to rebounce the pair! Now we are waiting for more profits from the newly formed zones.

Bitcoin is now positioned below its main resistance! | Day 10👋🏻 Hey everyone! Hope you’re doing great! Welcome to SatoshiFrame channel.
✨ Today we’re diving into the 1-Hour Bitcoin analysis. Stay tuned and follow along!
👀 Bitcoin has still not succeeded in breaking the resistance zone at $111,458. However, Bitcoin formed a higher low compared to its previous low, which increases the probability of breaking this resistance and gives it a higher win rate for a breakout.
🧮 Pay attention to the RSI oscillator. The 70 zone has maintained its overlap with Bitcoin just like yesterday, with the difference that the RSI support zone is now in the 45 range, which also overlaps with the newly formed higher low.
💰 Bitcoin’s volume in the 1-hour time frame has increased after forming a higher low, meaning this low is being respected by buyers, and the desire to break multi-timeframe resistances has increased. Breaking the current resistance zone requires strong buying volume so that sell orders are filled and some futures orders get liquidated.
✍️ The expected scenario for Bitcoin does not differ significantly from yesterday’s scenario.
🟢 Long Position Scenario
Break the key resistance at $111,458, surpass the 70 level on RSI and enter overbuy territory, accompanied by increased buying volume and a price squeeze.
❤️ Disclaimer : This analysis is purely based on my personal opinion and I only trade if the stated triggers are activated .

Tesla Macro ChartSharing my Macro Chart.
Use this as a reference for the levels of interest mentioned in my previous tesla post. Added a 30 minute box within the weekly balance box.
I like to personally use this chart to monitor levels intraday on the 30 minute or to plan major shorts or buys.
Some of these levels were drawn a year ago probably but I hope you'll find them useful.
~The Villain

BTC: (BTCUSDT) Current Update Today.Hi everyone,
Lets take a view on BTCUSDT. lately the price has been scaling up deliberately, trending in momentum region of highs and lows. there is fair prospect of it heading toward $116K, as next partial high and resistance as we can notice in the structure.
In addition the price might break above $116K and continue rising gradually.
Meanwhile a firm reversal below our target would activate a short down to the next lows.
Happy weekend
Thanks for reading.

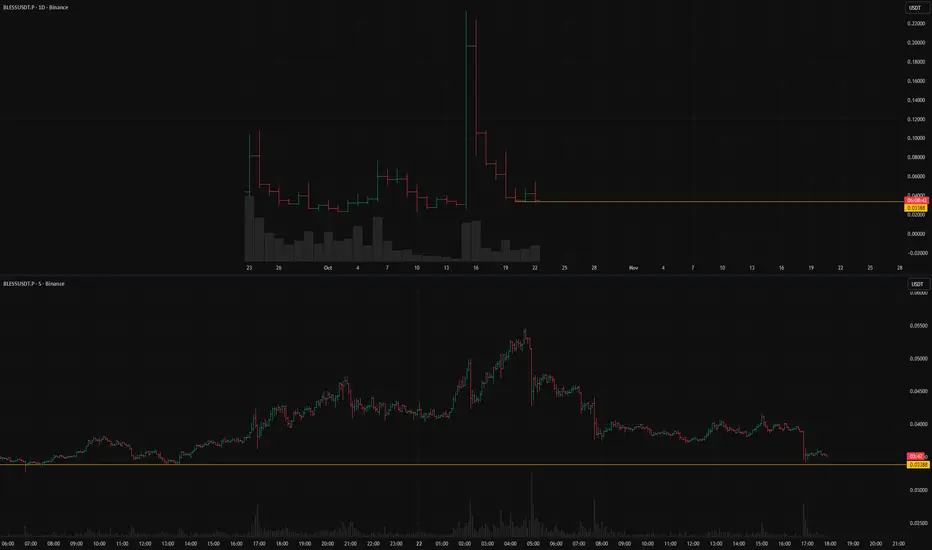
BLESSUSDT.Pshort setup from daily support at 0.03388BINANCE:BLESSUSDT.P is likely to continue moving within the short trend. The asset dropped sharply and stopped right before the key level, now remaining in a narrow consolidation range. The key factor here is the absence of a corrective rebound.
Key factors for this scenario:
Global & local trend alignment
Correlation with the market
Liquidity grab (false move against the trend)
Momentum stall at the level
Immediate retest
Factors that contradict this scenario:
Closing far from the level
Was this analysis helpful? Leave your thoughts in the comments and follow to see more.
Big Short is Ready BTC to 93000 USDTAs you can see, if the order block breaks down to the yellow area of 109,000, I expect to short Bitcoin to the area of 93,000 to 90,000. This is a big short. Be careful with your capital.
This is not investment advice. Check it out for yourself. Also observe risk and capital management. Thank you for your attention.

Bullish potential detected for BGLEntry conditions:
(i) higher share price for ASX:BGL along with swing up of indicators such as DMI/RSI.
Depending on risk tolerance, the stop loss for the trade would be:
(i) below the long-term support level of $0.98 (from the open of 7th January), or
(ii) below the rising 30 day moving average (currently $0.94).

Bearish potential detected for MTSEntry conditions (Darvas box failure play):
(i) lower share price for ASX:MTS along with swing up of ADX/DMI indicator and decline in RSI.
Depending on risk tolerance, the stop loss for the trade would be:
(i) above the long term resistance level of $4.00 from 17th April 2023, or
(ii) above the declining 30 day moving average (currently $4.05), or
(iii) above the high of the recently formed Darvas box of $4.16.

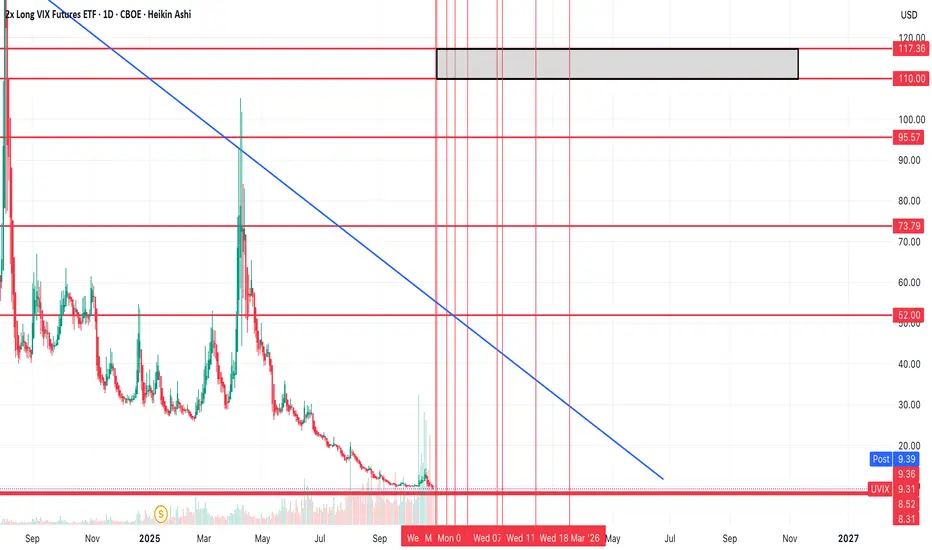
Almost time to bid for volatility? $UVIX over $100?I think we're getting really close to a large spike in volatility.
I think it's likely that vol will continue to fall into next week (and potentially a big longer into November), and if we can get down to the $8-$8.50 region, that there's strong support there and that could trigger a reversal.
SPY is almost to my upper levels of $709-716, and if we can see a push up there and a drop down to the support levels in UVIX that should trigger a reversal on both charts.
I do think the spike in volatility will be strong.
The most probable levels on the chart for a spike to find resistance in is $110-117, which would be a spike of 1100%-1200% or so if you were to catch the move entirely, and of course if the idea plays out.
I've also marked other resistance levels, should we get a smaller spike.
Could be the best trade of the year if it comes to fruition. Going to be watching the chart over the next week or so and will likely bid those levels with some calls for a trade.
Euro Coils Ahead of Fed / ECBEuro plummeted more than 3.1% from the yearly highs with price exhausting into technical support for the past three-weeks and the focus is on possible inflection into this zone with the medium-term risk still weighted to the downside while below the monthly open (1.1734).
Initial weekly support rests with the July low-week close (LWC) / 61.8% retracement of the July advance at 1.1586/93 and is backed by 1.1497-1.1505- a region defined by the March 2020 high, the 2022 high, and the 100% extension of the September decline. Look for a larger reaction there IF reached with a break / weekly close below needed to suggest a more significant high is in place / a larger correction is underway within the broader uptrend. Subsequent support objectives eyed at the Aril high close at 1.1394 with the next major technical consideration eyed at the 2024 high-week close (HWC) / 38.2% retracement of the yearly range at 1.1228/54.
Weekly resistance is eyed at the 1.1747/75- a region defined by the 2025 HWC, the June high-close, and the 61.8% retracement of the September decline. A breach / weekly close above this pivot zone is needed to mark resumption of the broader uptrend with key resistance steady at the 100% extension of the 2022 advance / 38.2% retracement of the broader 2008 decline at 1.1917-1.2020 (area of interest for possible exhaustion / price inflection IF reached. Subsequent resistance eyed at the 2021 HWC at 1.2218 in the event of a breakout.
Bottom line: Euro is trading just above support, and the focus is on inflection off this zone in the days ahead with a weekly close below needed to fuel the next leg of this pullback. From a trading standpoint, rallies should be limited to 1.1734 IF price is heading lower on this stretch with a close below 1.1497 needed to fuel the next leg of the decline.
-MB

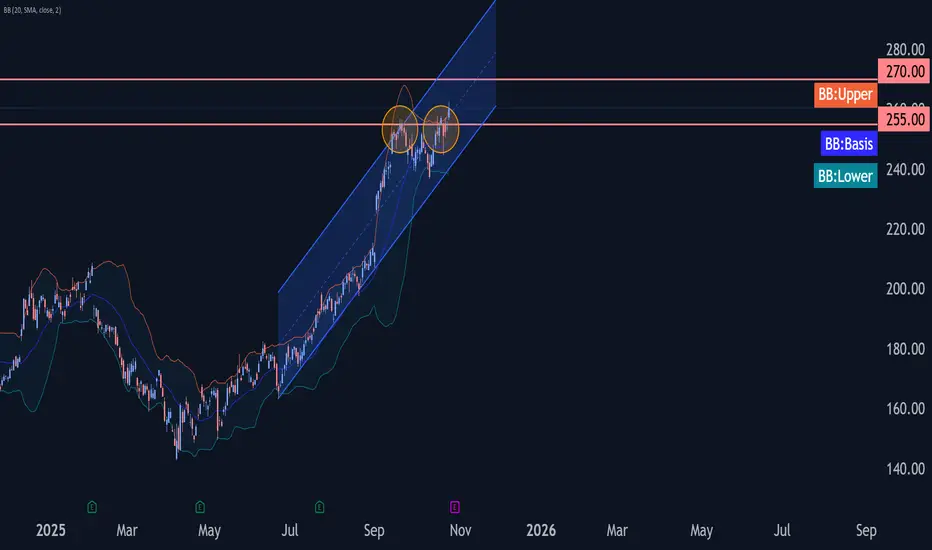
Google Wave Analysis – 24 October 2025- Google broke key resistance level 255.00
- Likely to rise to resistance level 270.00
Google broke above the key resistance level 255.00 (which stopped the previous impulse waves 3 and i, as can be seen from the daily Google chart below).
The breakout of the resistance level 255.00 accelerated the active minor impulse wave 5 of the daily impulse sequence (1) from April.
Given the strong daily uptrend, Google currency pair can be expected to rise to the next resistance level 270.00 (target price for the completion of the active impulse wave iii).
ZECUSDT Breakdown Incoming? Don’t Get Caught Long!Yello, Paradisers! Have you been paying attention to what’s happening on ZECUSDT lately? If not, now’s the time to look closely—because the signs of an incoming bearish move are stacking up fast, and getting caught on the wrong side could be costly.
💎Right now, ZECUSDT is reacting directly from a key 4H resistance zone, and the price structure is showing some serious warning signals. We’re seeing the formation of a clear Head & Shoulders pattern, which is one of the most reliable bearish reversal setups. On top of that, there’s bearish divergence showing up—indicating that upside momentum is fading, even as price attempts to push higher.
💎This kind of setup is what experienced traders wait for. For aggressive traders, there’s already a potential short opportunity from current levels. However, if you're more conservative (as you should be in this kind of uncertain environment), it's smarter to wait for a pullback and then look for a clear bearish candlestick formation. That confirmation will not only improve the probability of success but also provide a much more favorable risk-to-reward ratio.
💎But caution is key here. If price breaks and closes above the resistance zone, this whole bearish idea becomes invalid. In that case, the best move is to stay patient and wait for clearer price action before making any decisions. Jumping in early without confirmation is what wrecks most traders.
🎖Strive for consistency, not quick profits. Treat the market as a businessman, not as a gambler.
MyCryptoParadise
iFeel the success🌴

I held off as long as I could -- long at 34.72I have only so much willpower and only so much fear of market corrections. Both were exceeded today. I do not argue that this stock is overvalued based on its current business. I can make a case for its long term positive future (AI needs SOOOOOOO much energy while we apparently think it's a good idea to squash free energy in this country). Small modular reactors will be part of the energy future globally I suspect both near and especially, long term.
That said, I am a trader, not an investor. A 35% pullback that respected (so far) the most recent low is as much as I can justify waiting on a stock that has produced the gains this one has for me. Could it go down another 15%. I suppose. But I don't think it will before it rebounds, and when this thing rebounds, it makes Nikola Jokic (or insert your favorite NBA rebounder here) look like a child. It has had 5 15% or more single days since June.
It had a chance for a head and shoulders top back in June-Sept and it failed and ran to all time highs. To me this is a steep correction, but not a trans failure 30 is my expected floor here, but anything is possible if the whole market melts down. Regardless, this trend began back at the beginning of 2024 and is still very much intact here. In my perfect world, though, this is a trade that lasts less than a week for me. Tactical adds and sells until final resolution are always a possibility.
As always - this is intended as "edutainment" and my perspective on what I am or would be doing, not a recommendation for you to buy or sell. Act accordingly and invest at your own risk. DYOR and only make investments that make good financial sense for you in your current situation.

ETHUSDTBINANCE:ETHUSDT have a amazing trend because this is second the best crypto an head of all project so is in watchlist of best traders.
Support for buy: 3750$
Resistance for targets: 4045 - 4200 - 4435 - 4755
Please your risk management.

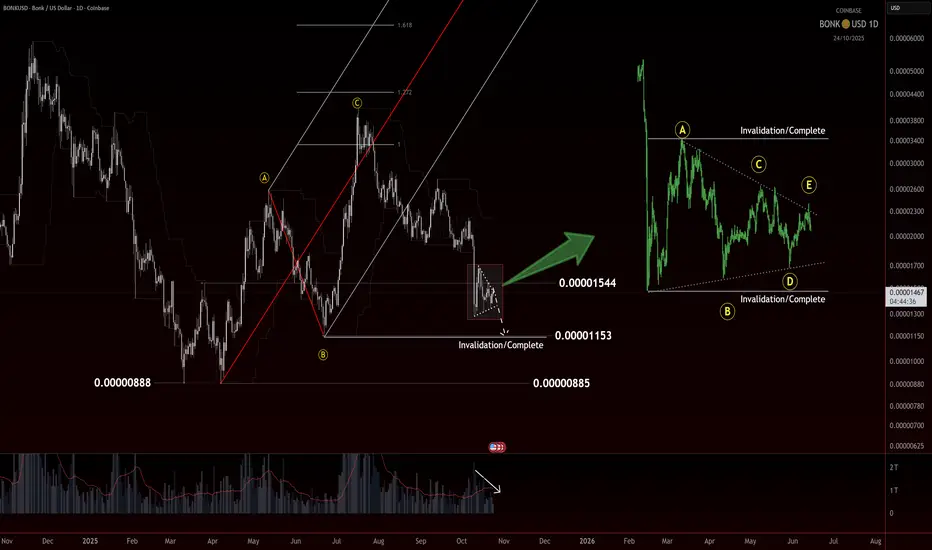
BONK: ALTsummers darling is dumping.BONK – One of the First Runner of #ALTSummer
BONK was one of the first tokens to blast off this summer, setting the pace for early alt momentum. It completed what looks like a clean five-wave impulse up, but now we’re seeing the market digest that move.
If the structure were still strongly bullish, we’d expect a simple internal retracement into the summer impulse before continuation. Instead, the current price action is drifting lower and looks ready to sweep the origin of that move. That tells us this may be more than just a pullback.
On the hard right edge, the structure is giving off triangle vibes. The range is tightening, volume is contracting, and the swings are overlapping. In Elliott Wave terms, a triangle is often the final pattern before the last move of a sequence. It’s the market coiling up before making its decision.
If this forms and finishes as a triangle, we can use it to anchor the count. A clean thrust and sweep of the pivot could trigger short-term upside and possibly close out the current leg. From there, the key question becomes whether that push is the start of something new or simply the last gasp before one more low.
For now, I’m watching how BONK handles this pattern. If it holds and breaks above the triangle invalidation, that would confirm a short-term bullish response. If it completes and breaks lower, the summer impulse is likely complete, and the next real opportunity will come from the base that forms afterward.
Trade safe, trade clarity.
TonyTalon