BTCUSDT: Bearish Drop to 84000?BINANCE:BTCUSDT is eyeing a bearish reversal on the 4-hour chart , with price forming lower highs within an upward channel, approaching resistance near cumulative long liquidation zones that could trigger downside momentum if sellers defend the levels amid recent volatility. This setup suggests a pullback opportunity after the rally, targeting lower support levels with overall risk-reward exceeding 1:4.
Entry between 91400–92700 for a short position. Targets at 87900 (first), 84000 (second). Set a stop loss at a close above 93180 , yielding a risk-reward ratio of more than 1:3.5 in total. Monitor for confirmation via a bearish candle close below entry with rising volume, leveraging the pair's channel dynamics.🌟
Fundamentally , Bitcoin has plunged below $90,000 on December 12, 2025, amid AI-related jitters dragging down Nasdaq and crypto stocks, with prices consolidating around $89,978 after a sharp fall from its $126,000 peak earlier this year. Despite a 1.9% daily crypto market cap increase to $3.23 trillion, sentiment remains cautious with fears of a price crash, as the asset oscillates in the $88,000–$93,000 range on Fed outlook but shows hourly downside after failing $92,735 resistance. Long-term forecasts eye drops to $80,000 by end-2026, with prediction markets skeptical of hitting $100,000 in 2025, though bulls maintain the uptrend for now. Bitcoin correlates with the S&P 500, which slipped today alongside Nasdaq due to AI bubble fears from Broadcom's results, potentially adding downward pressure on BTC. 💡
📝 Trade Setup
🎯 Entry (Short):
91,400 – 92,700
(Entries inside this zone remain valid with proper risk & capital management.)
🎯 Targets:
• 87,900 (first)
• 84,000 (second)
❌ Stop Loss:
A daily close above 93,180
⚖️ Risk-to-Reward:
More than 1:4 overall
💡 Your view?
Will BTC reject the 92K zone and unwind toward 84,000, or does crypto surprise with a squeeze first? 👇
Support and Resistance

OKLO LongNear Support Line
Long entry 94
Stop 78
Target 145
Risk management is much more important than a good entry point.
I am not a PRO trader.
In my trading plan, the Max Risk of each short term trade should be less than 1% of an account.

Long XAUUSD"After a pullback and a corrective move into the predefined zones (fibo as Order Blocks, FVGs, or key support levels), the price may regain bullish momentum and continue its upward trend."

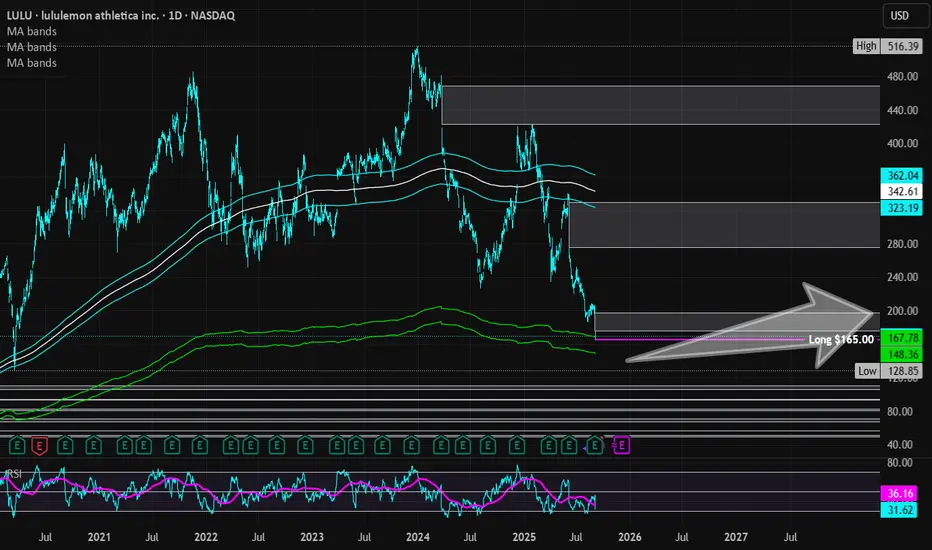
Lululemon Athletica | LULU | Long at $165.00Lululemon $NASDAQ:LULU. If you don't think the US is in a recession, examine most retail stocks right now. But this doesn't mean doom and gloom are here from a US government/news narrative - in fact, the complete opposite. AI and tech are solely propping up the US stock market ... but pay no attention to the issues behind the curtain! Once interest rates start dropping, trading and investing are going to get wild before the cracks open up.
Okay, off my soap box...
NASDAQ:LULU entered by "crash" simple moving average zone (green lines) today after earnings. Competition is finally catching up to the company, but expansion into China and other foreign areas *may* revive them in the next 1-2 years. While most analysts are relatively bullish, I'll stay centered. I wouldn't be surprised if the stock dips into the $140's and $150's in the near-term. Bigger news will have to come out for me to stay long-term, but I'm holding here or even lower. Additional entries will be made in the $140's-$150's to swap out the position I just made at $165.00 for the future.
Thus, at $165.00, NASDAQ:LULU is in a personal buy zone with the risk of a continued drop to the $140's and $150s. Christmas rally potential...
Targets into 2028:
$185.00 (+12.1%)
$197.00 (+19.4%)
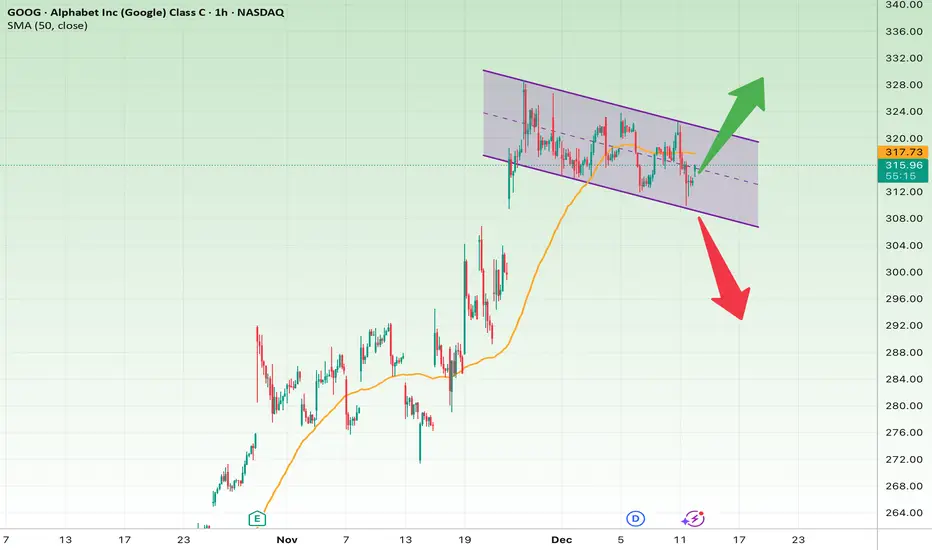
Technical Analysis of GOOG (1H Timeframe)The price is currently oscillating inside a short-term descending channel. Multiple touches on both the upper and lower boundaries increase the pattern’s reliability. The SMA50 is positioned slightly above the price and is acting as resistance for now.
This structure suggests that the market is trapped between two scenarios and is likely to experience a breakout or breakdown soon.
Bullish Scenario
If the price breaks above the channel resistance (around 319–320) and closes a confirming candle above it:
Targets
• Target 1 → 323
• Target 2 → 327–328 (full channel breakout)
• Target 3 → 332
Stop-Loss
• A close below 313
Bullish Reasons
• EMA/SMA are beginning to flatten and may shift back upward
• Price action at the channel bottom signals active demand
• A bullish reversal pattern often forms after a short-term descending channel
Bearish Scenario
If the price breaks below the channel support at 310:
Targets
• Target 1 → 304–305
• Target 2 → 298–300
• Target 3 → 292
Stop-Loss
• A close back above 316–317
Bearish Reasons
• The MA50 is currently acting as resistance
• The descending channel has strong validity
• Multiple rejections at the channel top
Quick Summary
• GOOG is compressed inside a short-term descending channel.
• Break above 320 → continuation of the bullish move.
• Break below 310 → deeper correction likely.
• For now, the market is in a neutral to slightly bearish stance.
DAX at a Historical Ceiling (Breakout or Breakdown Ahead?)Price is stuck under a major multi-month resistance zone at 24,600–24,800, while SMA50 acts as support around 23,980.
The market is in a critical decision zone.
Bullish Scenario — if price closes above 24,800:
• Target 1: 25,400
• Target 2: 26,000
• Target 3: 26,500
• Stop-loss: Below 24,600
Bearish Scenario — if price rejects and falls below 24,150:
• Target 1: 23,700
• Target 2: 23,300
• Target 3: 22,800
• Stop-loss: Above 24,400
Short Fundamental Overview
• EU inflation cooling; ECB remains cautious
• German corporates stable but economic growth is soft
• Market needs a clear breakout to confirm direction

Banknifty Banknifty levels are based on volume profile
1. Gapup 59800 long
2. 59800-59400 trade breakout
3. Gapdown 59400 short

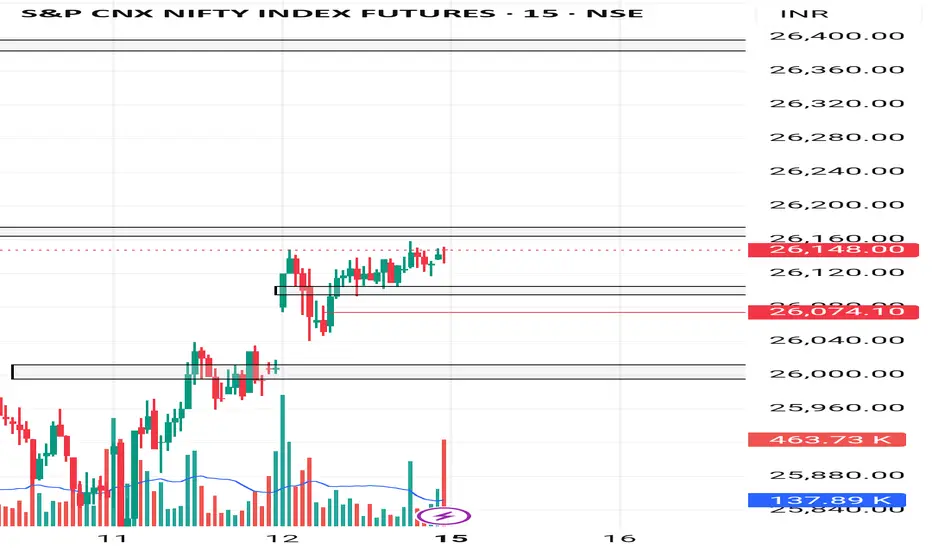
Nifty Nifty levels are based on volume profile
1. Gapup 26175 long
2. 26175-26100 trade breakout
3. Gapdown 26100 short
NZDCAD: Possible Buy.!NZDCAD is ranging on a momentum trend of support and resistance, the pair is ascending slowly in respect of the structure. currently the price is at the trendline support, as we anticipate an upward move above the support.
Key points;
A Confirmed reversal above the trendline, would set off a bullish rise to 0.8037 as potential target
Thanks for reading.

DXY: Bearish Divergence and Its Impact on Risk Assets
This chart tracks the daily price of DXY , revealing key technical and macro dynamics relevant for traders and investors in risk-on markets.
The DXY has approached a major horizontal resistance level near 100.2, a zone that previously acted as both support and resistance.
While price tests this resistance, the RSI shows a classic bearish divergence, DXY has made higher highs on price, but RSI has failed to confirm new momentum highs. This gap signals underlying exhaustion, suggesting that further upside for the dollar may be limited in the near term.
A falling DXY signals easier liquidity and can catalyze rallies in riskier asset classes. Traders often watch DXY movements for clues on when to deploy capital into stocks or crypto.

CARD on LSE - LongCARD on LSE - Long
Playing an old level, the 3 higher lows and steady accumulation at the lows.
Early signs of MACD hidden bullish divergence.
Trading the range, but you could exit only 50 or 75% of position and keep the rest for a long term dividend hold.

SNDK: at macro resistance Price broke out through the resistance zone highlighted in the September update and continued to show strong upside momentum. However, the trend structure now appears substantially extended at current levels.
As long as the price remains below the 207–225 resistance zone, I expect selling pressure to start building, potentially leading to a pullback toward the 130–100 support area.
Chart:
Previously:
On resistance level (Sep 26):
Chart:
www.tradingview.com

AVGO: mid-term trend structure If price is to hold above 209-198 area of support, next resistance zones are: 287-303 and 320-330-360.
Macro trend structure also assumes higher targets for the uptrend since 2022 bottom (Monthly):
Thank you for your attention!

Bullish BOS Breakout, Watching Reaction at OB & Sell-Side Liquid◆ Market Context (H2)
Price has just broken a bullish BOS and closed above the previous equilibrium zone, confirming buyers are in control. After the strong impulse, the market has entered a rebalancing phase, where a short-term pullback often appears before continuation or a liquidity sweep to the upside.
◆ SMC & Price Action
• Bullish structure confirmed by consecutive BOS following the prior CHoCH.
• The 4,274 OB is the nearest demand zone where buyers previously reacted.
• Above lies sell-side liquidity at 4,355, with a further extension toward 4,408 — a potential distribution or short-term reversal zone.
• Price is currently in premium, so patience is preferred over FOMO entries.
◆ Key Levels
• Resistance / Liquidity: 4,355 → 4,408
• Support OB: 4,274
• Deeper OB: 4,217
◆ Trading Scenarios
➤ Scenario A – Pullback BUY (Primary)
• Wait for a pullback into OB 4,274
• Conditions: structure holds (no break of recent lows), bullish reaction appears
• Targets:
▪ 4,319
▪ 4,355 (Liquidity Sell)
▪ Extension: 4,408
➤ Scenario B – Break & Continue
• If price holds above 4,319 with bullish closes
• Monitor reactions at 4,355 for partial profit-taking
• Avoid chasing price in premium zones
➤ Scenario C – Deeper Pullback
• If OB 4,274 is clearly broken
• Price may retrace to OB 4,217 for re-accumulation
• Only consider BUY after a fresh bullish CHoCH
◆ Summary
• Primary trend: Bullish (BOS confirmed)
• Priority: Buy pullbacks, avoid FOMO
• Key decision zone: OB 4,274
• Upside liquidity targets: 4,355 → 4,408

EURUSD EURUSD had a bounce up early morning and got rejected by Friday highs a little later.
EURUSD finding some resistance in the upper green zone.
Looking at how EURUSD reacts and will try to anticipate a move!
Let me know what you think!
Stay safe out there and do your own due diligence, this is not investment advise!

GOLD | Short ideaGold tapped into the previous monthly high and since then been trending down.
Now it is at a key level where I expect Gold to reject and make a move down.
A reaction has been there already, it is very volatile so tread carefully.
Let me know what your analysis is!
Stay safe out there and do your own due diligence, this is not investment advise!

EURUSD - 12/ 12/25 - day tradeYesterday had a major bullish push up in EURUSD. Now with a correction in play during this Friday, i would like to take a trade in the direction of the short term correction.
- Sub structure bearish Break of structure in play
- Market Structure suggesting further bearish action.
Small doji and imbalance identified on the 1 hour chart and a bearish trade placed to take out the imbalance below and read the area identified. the demand zone that broke the structure to the bullish side.


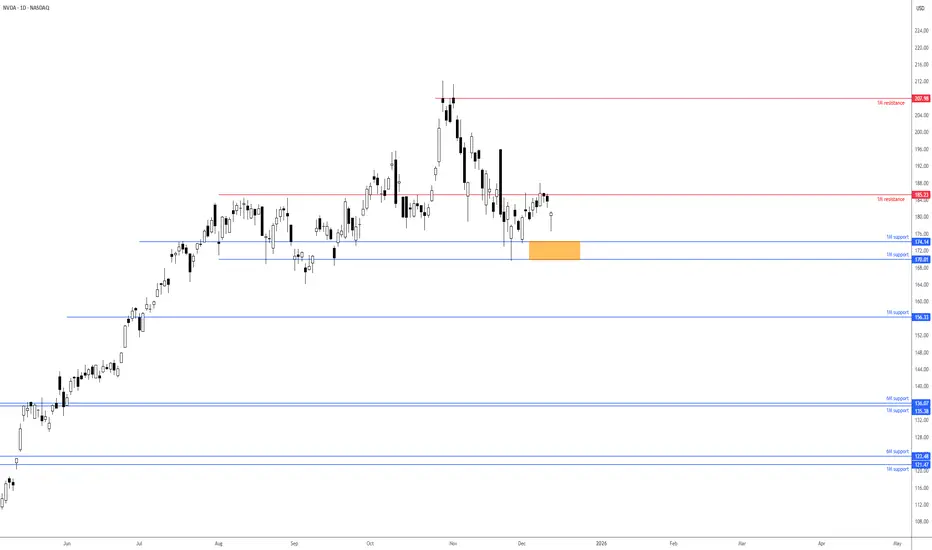
NVDA breakout will help determine near-term direction Shares of Nvidia took a hit during Thursday’s session, losing about 1.5%. Technically, the trend remains northbound, though near-term price action has shown a few lower lows and lower highs: early signs of a downtrend.
1M resistance recently made a show at US$185.23 and withstood a few upside attempts. 1M support is nearby between US$170.01 and US$174.14, with a break under here unbolting the door to another layer of 1M support from US$156.33. Alternatively, pushing above US$185.23 would help bolster the long-term trend, and potentially attract fresh buying to 1M resistance at US$207.98, closely shadowed by the all-time high of US$212.19.
Ultimately, the direction of travel for this Stock will depend on whether it breaks above resistance at US$185.23, encouraging buying, or below the support zone between US$170.01 and US$174.14, which could prompt further underperformance.
Written by the FP Markets Research Team
CHF-JPY Bullish Breakout! Buy!
Hello,Traders!
CHFJPY breaks above a well-defined supply zone with strong bullish displacement, confirming a shift in market structure. The breakout signals smart money strength, with upside liquidity now exposed. A brief pullback may occur, but continuation toward higher targets remains favoured. Time Frame 4H.
Buy!
Comment and subscribe to help us grow!
Check out other forecasts below too!
Disclosure: I am part of Trade Nation's Influencer program and receive a monthly fee for using their TradingView charts in my analysis.

GBPCHF LOCAL LONG|
✅GBPCHF is approaching a key ICT demand zone after a corrective pullback. Price is likely to retest demand to mitigate imbalance and fill inefficiency before bullish continuation. Expect renewed displacement toward buy-side liquidity once demand is respected. Time Frame 6H.
LONG🚀
✅Like and subscribe to never miss a new idea!✅

EUR-CHF Free Signal! Buy!
Hello,Traders!
EURCHF reacts strongly from a well-defined SMC demand zone after a liquidity sweep below equal lows. The sharp displacement confirms smart money absorption, with price now poised for a corrective push higher into the nearest inefficiency and premium objective.
--------------------
Stop Loss: 0.9311
Take Profit: 0.9346
Entry: 0.9326
Time Frame: 4H
--------------------
Buy!
Comment and subscribe to help us grow!
Check out other forecasts below too!
Disclosure: I am part of Trade Nation's Influencer program and receive a monthly fee for using their TradingView charts in my analysis.

CRUDE OIL Bearish Bias! Sell!
Hello,Traders!
CRUDE OIL taps into a fresh SMC supply pocket after a clean liquidity grab and shifts order flow bearish. The current pullback simply mitigates the breaker before another leg down unfolds toward discounted pricing. Time Frame 4H.
Sell!
Comment and subscribe to help us grow!
Check out other forecasts below too!
Disclosure: I am part of Trade Nation's Influencer program and receive a monthly fee for using their TradingView charts in my analysis.
