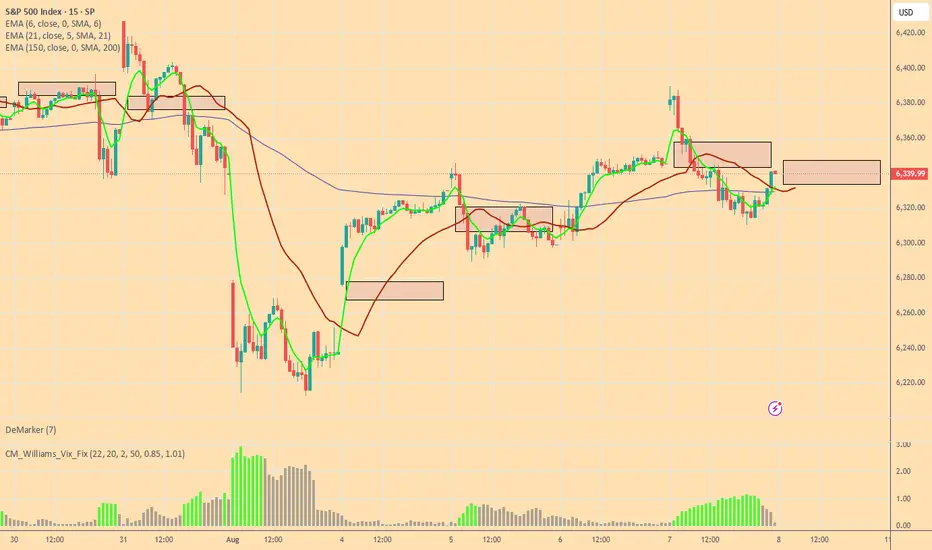
Bulls and Bears zone for 08-08-2025ETH session has rallied to 61.8 Fibonacci level of yesterday's RTH session. Any test of ETH session High could provide direction for the day.
Level to watch: 6384 --- 6386
Supportandresistancezones
XAUUSD Gold Trading Strategy August 8, 2025XAUUSD Gold Trading Strategy August 8, 2025:
Gold prices have approached the 340x area and have fallen sharply to the 338x support area at the beginning of today's trading session.
Basic news: President Trump announced to double tariffs on Indian goods to 50% in response to continued oil imports from Russia. Reports show that Trump may meet with Russian President Vladimir Putin as early as next week.
Technical analysis: Gold prices are currently in an uptrend channel, but the trading range is showing signs of narrowing. The possibility that the price will correct at this 340x area is very high; if the gold price creates a double peak pattern in the H1 frame, the price range of 3375 - 3380 will confirm the pattern and create a strong downward force for the gold price. If gold forms a double top pattern here, this correction could take gold to the 3350 or even 3330 area.
Important price zones today: 3375 - 3380, 3405 - 3410 and 3420 - 3425.
Today's trading trend: SELL.
Recommended orders:
Plan 1: SELL XAUUSD zone 3407 - 3409
SL 3412
TP 3404 - 3394 - 3374 - 3354.
Plan 2: SELL XAUUSD zone 3423 - 3425
SL 3428
TP 3420 - 3410 - 3390 - 3370.
Plan 3: BUY XAUUSD zone 3375 - 3377
SL 3372
TP 3380 - 3390 - 3400.
Wish you a safe, successful and profitable trading weekend.🌟🌟🌟🌟🌟

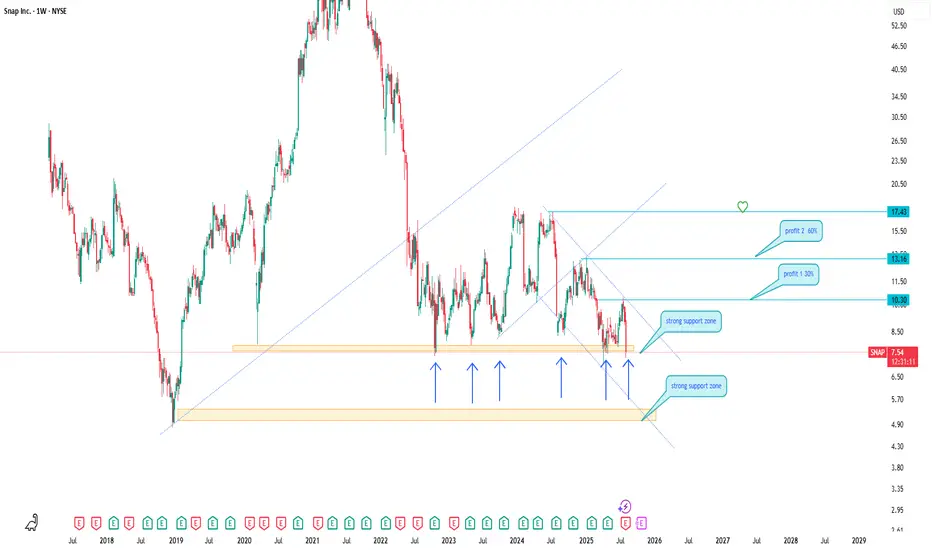
Snap Inc. — key weekly support area for long positionsSnap Inc.
Regularly Pays Cash as Salaries
Price is testing a strong support zone near 6.00–7.00 USD, held since 2022.
Bullish reversal signals are forming. First target: 10.30, second target: 13.16 to 17.43.
Potential upside exceeds 60 percent.
The area is attractive for mid-term investors if the support holds. If price dips lower, I will average the position at 5.50 USD within the extended support zone.
"simple deal that makes money"
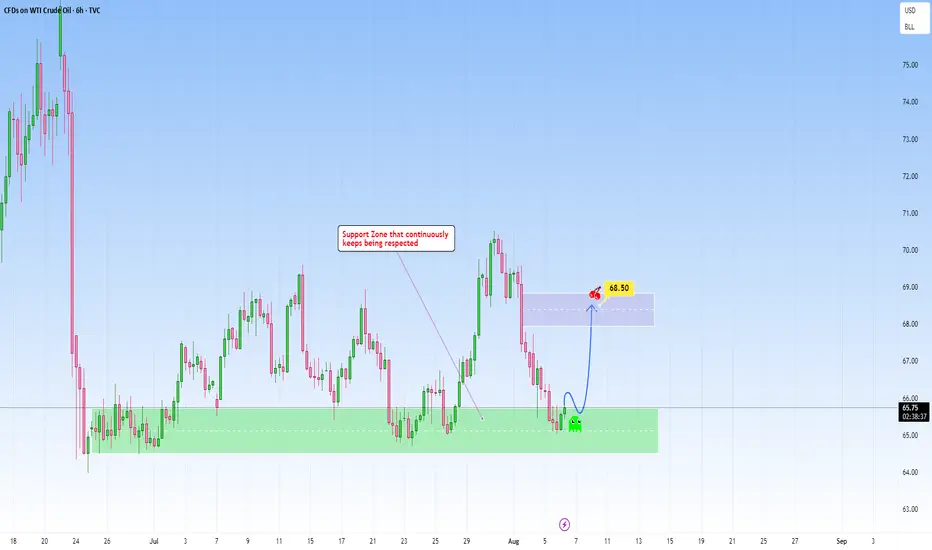
USOIL: Respecting support, repeating opportunity The chart on USOIL presents a compelling technical setup that blends structure, behavioral dynamics. The core technical analysis here lies in this support zone that is well-defined area that has been tested multiple times and consistently held, suggesting strong demand.
The narrative structure is one of rebound. Every time price approaches the support zone, the reaction is not only immediate but also structured, price responds with conviction.
So I am recognizing the strength of the reaction and forecasting an upward move to the 68.50 level.
The target at 68.50 is achievable, acting as both a profit objective and a psychological level, round enough to attract attention and previously strong enough to cause a drop. If momentum sustains, a breakout from there would depend on volume confirmation and structure shifts, but for now, the play back into that range makes sense and respects both the chart’s geometry and price action logic.
Not reacting to noise, but to repeatable high-probability zones.
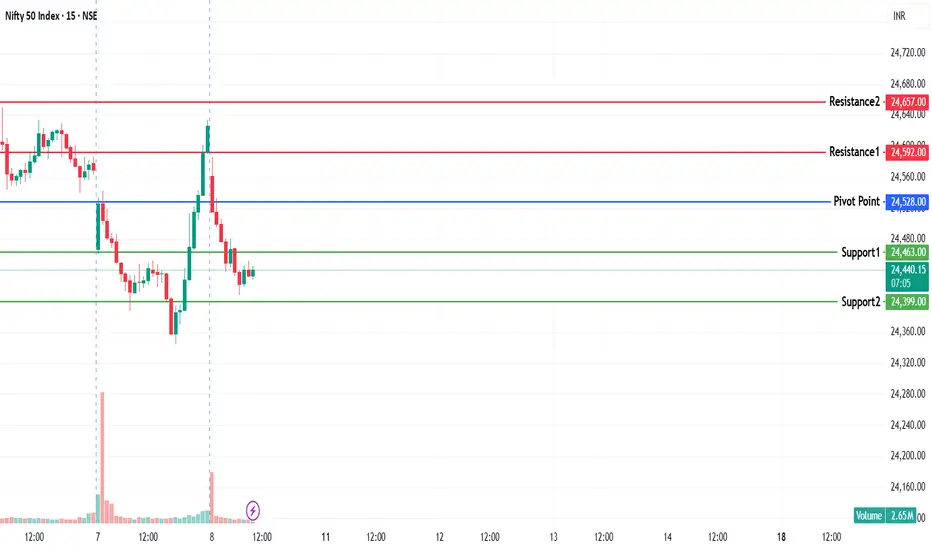
NIFTY KEY LEVELS FOR 08.08.2025NIFTY KEY LEVELS FOR 08.08.2025
Apologies for the delay in sharing this..
If the candle stays above the pivot point, it is considered a bullish bias; if it remains below, it indicates a bearish bias. Price may reverse near Resistance 1 or Support 1. If it moves further, the next potential reversal zone is near Resistance 2 or Support 2. If these levels are also broken, we can expect the trend.
If the range(R2-S2) is narrow, the market may become volatile or trend strongly. If the range is wide, the market is more likely to remain sideways
📢 Disclaimer
I am not a SEBI-registered financial adviser.
The information, views, and ideas shared here are purely for educational and informational purposes only. They are not intended as investment advice or a recommendation to buy, sell, or hold any financial instruments.
Please consult with your SEBI-registered financial advisor before making any trading or investment decisions.
Trading and investing in the stock market involves risk, and you should do your own research and analysis. You are solely responsible for any decisions made based on this research.
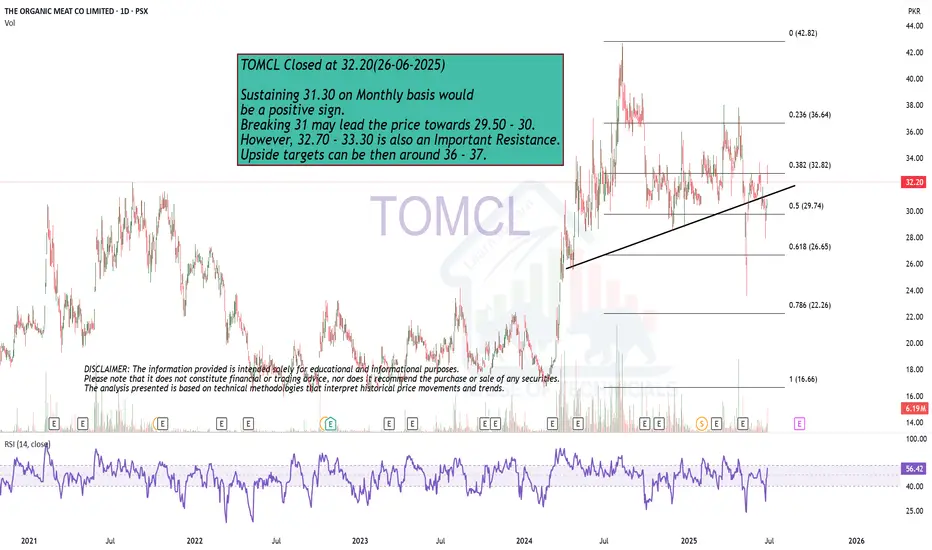
Play on Levels.26-06-2025
Sustaining 31.30 on Monthly basis would
be a positive sign.
Breaking 31 may lead the price towards 29.50 - 30.
However, 32.70 - 33.30 is also an Important Resistance.
Upside targets can be then around 36 - 37.
NZDCAD higher bullish for expect
OANDA:NZDCAD price in PA, its make bounce on bottom line of PA, here after todays events expecting higher bullish continuation.
SUP zone: 0.81500
RES zone: 0.82600, 0.82850

XAUUSD Bearish SMC Analysis – Institutional RejectionXAUUSD Bearish SMC Analysis – Institutional Rejection from Supply Zone
Gold (XAUUSD) is showing a clear bearish structure after rejecting a major supply zone at premium pricing. This setup is aligned with Smart Money Concepts (SMC) and reflects how institutions manipulate liquidity and order flow before major price moves.
🔍 Market Structure Context:
The market had been trending upward with higher highs and higher lows, until it approached a key premium supply zone near $3,420.
At this level, price stalled, creating internal Equal Highs (liquidity) — a common trap used by institutions to grab orders before reversing.
🔄 Change of Character (CHoCH):
A clear CHoCH was printed when price broke below the most recent higher low, signaling a shift from bullish to bearish structure.
This change marked the first early signal that institutional order flow has flipped bearish, and distribution is underway.
📉 Break of Structure (BOS):
Following the CHoCH, the market confirmed intent with a clean BOS to the downside.
This structural break confirms bearish control and validates short bias.
🧲 Liquidity Engineering:
Equal Highs were swept at the top, indicating a liquidity grab before institutions drove price downward.
This move traps breakout buyers and provides large players with sell-side execution at premium pricing.
🧱 Fair Value Gap (FVG) & Supply Zone Mitigation:
After BOS, price retraced into a Bearish Fair Value Gap (FVG) and the origin of the supply zone, offering a high-probability entry.
The rejection from this zone showed imbalance was respected and no bullish continuation existed — further validating the short setup.
🔍 Confluences for the Bearish Bias:
Confluence Confirmation
CHoCH Structure flipped bearish
BOS Bearish continuation confirmed
Liquidity Sweep Equal highs taken
FVG Retest Smart Money re-entry signal
Supply Zone Mitigation Institutional reaction confirmed
📘 Educational Summary:
This setup exemplifies a complete Smart Money bearish reversal model:
Premium pricing ✅
Liquidity taken ✅
Structure flipped (CHoCH + BOS) ✅
Supply & FVG respected ✅
It reflects how institutions build positions quietly, using engineered liquidity to trap retail traders, and then drive price with high-volume imbalance moves.

"BTCUSD Technical Outlook: Support Holds, Bulls Aim for $117K""BTCUSD Technical Outlook: Support Holds, Bulls Aim for $117K"
Market Structure Overview
BOS (Break of Structure): Multiple BOS points indicate strong shifts in market direction, confirming both bullish and bearish trends across different zones.
Bearish Fair Value Gap (FVG): This zone, marked after a BOS on July 23–24, acted as a rejection area, initiating a sharp sell-off — a classic bearish imbalance fill and reversal.
Equal Lows & Sell-side Liquidity: This area attracted liquidity grabs, as smart money hunts resting stop losses below these equal lows before reversing direction.
🔸 Key Supply & Demand Zones
Previous Resistance Zone (~118,000 - 120,000): Price rejected this area after filling the imbalance, confirming it as a strong supply zone.
Support Zone (~112,000 - 113,000): Currently acting as a high-probability demand zone. Liquidity accumulation here suggests a possible bullish reversal.
📉 Liquidity Zones
Sell-side Liquidity Sweep: Price dipped below equal lows to collect liquidity, often a signal of institutional accumulation.
Liquidity/Fair Value Zone (~116,000): Acts as a magnet for price, offering potential retracement targets before any major trend continuation.
📈 Forecast & Target
Current Price: $114,061
Short-term Target: $117,546 — aligning with previous FVG imbalance and liquidity zone.
Bias: Bullish Reversal expected from support zone toward the previous inefficiency and resistance levels.
🎓 Educational Takeaways
BOS Confirmation is critical in validating trend shifts and structure breaks.
FVGs (Fair Value Gaps) highlight inefficiencies and offer high-probability reversal or continuation zones.
Liquidity Sweeps near equal lows/highs often precede smart money moves — useful for spotting entries and exits.
Volume Profile (left side) suggests higher activity zones — these areas often align with major turning points.
✅ Conclusion
BTCUSD has swept liquidity below support and is showing signs of reversal. If the bullish pressure holds above $113,000, a move toward the $117,500 zone is likely, targeting previously unfilled imbalance and trapped liquidity.

XAUUSD Gold Trading Strategy August 7, 2025XAUUSD Gold Trading Strategy August 7, 2025:
Gold prices are steady as US President Donald Trump has imposed an additional 25% tariff on Indian goods due to India's continued purchases of Russian energy. This new measure raises the current 25% tariff on Indian goods to 50%.
Fundamental news: The current market pulse is still mainly revolving around the tariff story initiated by Trump, in which spot gold is trading in a fairly narrow range. Gold is still waiting for further impact from the Fed's interest rate cut process, a weaker dollar will create support for non-yielding gold.
Technical analysis: The trading range of gold prices is currently narrowing, RSI on H1 and H4 frames is approaching the overbought zone. Gold prices have recovered, but resistance zones such as 3400 - 3405 and 3420 - 3425 can be short-term profit-taking areas for investors. Liquidity zones and Fibonacci frames show that the upward force of gold prices is showing signs of slowing down.
Important price zones today: 3373 - 3378, 3400 - 3405 and 3420 - 3425.
Trading trend today: SELL.
Recommended orders:
Plan 1: SELL XAUUSD zone 3402 - 3404
SL 3407
TP 3399 - 3390 - 3380 - 3360 - OPEN.
Plan 2: SELL XAUUSD zone 3423 - 3425
SL 3428
TP 3420 - 3410 - 3390 - 3370 - OPEN.
Plan 3: BUY XAUUSD zone 3373 - 3375
SL 3370
TP 3378 - 3388 - 3400 (small volume).
Wishing you a safe, successful and profitable trading day.💗💗💗💗💗

EURUSD Bearish Market Structure Unfolding – Liquidity Grab BelowEURUSD Bearish Market Structure Unfolding – Liquidity Grab Below Support Expected"
🔍 Technical Analysis Breakdown:
🔺 Resistance Zone (1.17500 - 1.18500)
Labelled “Strong High”, this is a high-supply zone where price previously reversed.
Multiple Break of Structure (BOS) and Change of Character (CHoCH) confirm this as a strong bearish supply area.
Any retracement toward this level could be ideal for short entries.
🟩 Fair Value Gap (FVG)
This imbalance area previously served as a magnet for price before it broke down.
Price failed to hold inside the FVG, reinforcing bearish sentiment.
🔻 Support Zone (1.13500 - 1.14000)
Marked as a "Weak Low", suggesting this level is likely to be taken out in a liquidity sweep.
Price is expected to retest and potentially break below this zone in the near term.
📉 Current Price Action
Recent CHoCH (Bearish) confirms shift in structure.
Price has made a corrective pullback and seems poised for another leg down.
Highlighted grey zone suggests price may retrace slightly higher before continuing its bearish move.
🎯 Bias: Bearish
Expecting downside continuation toward 1.13500 support, targeting liquidity below.
Traders may wait for rejection signals on lower timeframes around the minor pullback zone before executing shorts.
📚 Educational Notes:
CHoCH indicates a shift in market sentiment (from bullish to bearish).
FVG often acts as a magnet but if not respected, confirms momentum in the opposite direction.
Support/Resistance zones are used to determine institutional activity zones.

XAUUSD Chart Analysis – Smart Money Concepts (SMC) Based🔍 XAUUSD Chart Analysis – Smart Money Concepts (SMC) Based
1. Market Structure Overview:
The chart clearly shows a bullish market structure forming after a sequence of Breaks of Structure (BOS) and Change of Character (CHoCH) events.
The market has consistently made Higher Lows, indicating strength from the bulls and institutional order flow to the upside.
2. Key Zones Identified:
✅ Strong Support Zone (Demand Area):
Around $3,260–$3,280, this level has been respected multiple times.
It is marked with BOS, CHoCH, and a Bullish Fair Value Gap (FVG) indicating institutional accumulation and unfilled orders.
The area also contains a Weak Low, which gives price a reason to stay above if bullish sentiment continues.
❌ Strong Resistance Zone (Supply Area):
Around $3,420–$3,460, this area shows signs of Level Rejection and is labeled with Buy-Side Liquidity.
This is where price previously reversed after grabbing liquidity—indicating distribution and possible shorting interest from smart money.
3. Liquidity Zones:
Buy-Side Liquidity: Above recent swing highs near $3,420–$3,440. Price tapped this level and sharply rejected.
Sell-Side Liquidity (Target Area): Currently aiming for the zone around $3,350, which aligns with a recent imbalance (FVG) and a clean liquidity pool below short-term higher lows.
4. Fair Value Gaps (FVGs):
A Bullish FVG is seen mid-chart, where price was rapidly driven up, leaving a gap—price later returned to this zone, respected it, and pushed higher again.
This is a strong sign of institutional entry and provides excellent long entries.
5. Trend Confirmation:
BOS + CHoCH + Higher Lows = Bullish Bias.
Each low is forming higher than the previous, with strong rejections from demand zones.
6. Entry & Target Insight:
Entry Point: After price reacted from support and printed another Higher Low.
Target: Currently price is targeting $3,350 (short-term retracement or pullback target).
This target is likely an internal liquidity sweep before potential continuation to retest the resistance zone again.
7. Educational Takeaways:
Market Structure is King: Observe BOS/CHoCH for directional bias.
Liquidity Matters: Understand where liquidity is resting—price seeks it.
FVG as Entry Tool: Fair Value Gaps provide high-probability trade setups when aligned with structure.
Patience at Key Zones: Wait for confirmations at resistance/support rather than impulsive trades.
✅ Summary:
Bias: Bullish, until structure breaks.
Short-Term Target: $3,350 (as per the chart).
Long-Term View: If price maintains higher lows, potential revisit to the resistance zone ($3,420–$3,460) is likely.
Invalidation Level: Break and close below strong support ($3,260) would shift bias.

Bullish Flag Pattern.
Bullish Flag Pattern.
Crossing 435 with Heavy volumes will
trigger more positivity & will expose
New Highs targeting 700+
On flip side, breaking 300 now, will
bring more selling pressure.

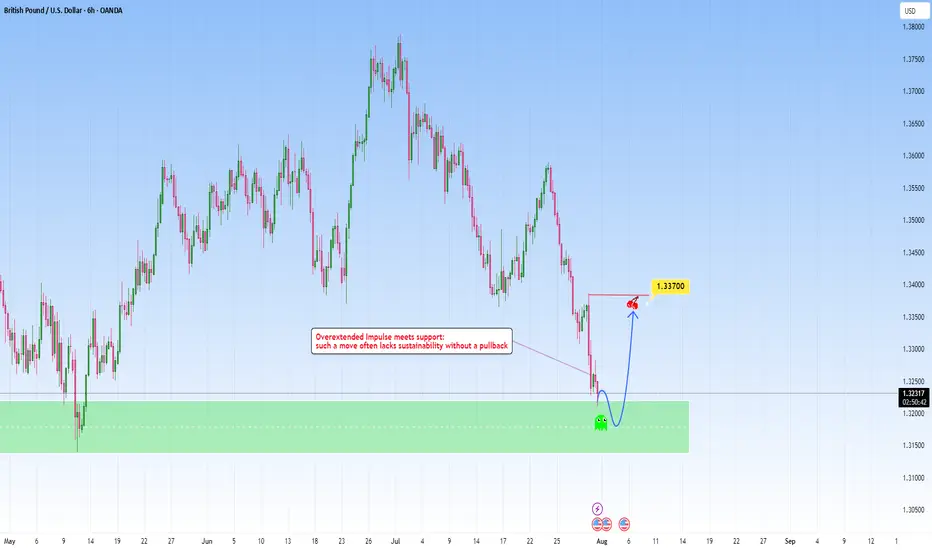
GBPUSD: Overextended move meets with supportAfter a steep and aggressive sell-off, price has tapped into a clear zone. This recent move wasn't gradual: it was impulsive and sharp, which tells us one key thing: exhaustion is likely.
The overextension into it without any meaningful pullback typically highlights imbalance, where price moves ahead of structure and becomes vulnerable to correction. But price doesn’t move in straight lines forever. Markets that fall too quickly tend to burn out just as fast. When such aggressive pushes meet with a clean, resistance like this one, they often trigger the exact opposite, a snapback correction.
I am now watching for signs of absorption and accumulation. This could play out in the form of sideways candles, wick rejections, or a sudden reversal spike. These are early signs that smart money might be stepping in.
My projected target would be toward the 1.33700 area, from the last impulsive drop. It’s a classic mean reversion setup, not just technical but psychological. Traders who chased the move late may find themselves trapped, fueling the correction as they’re forced to exit.
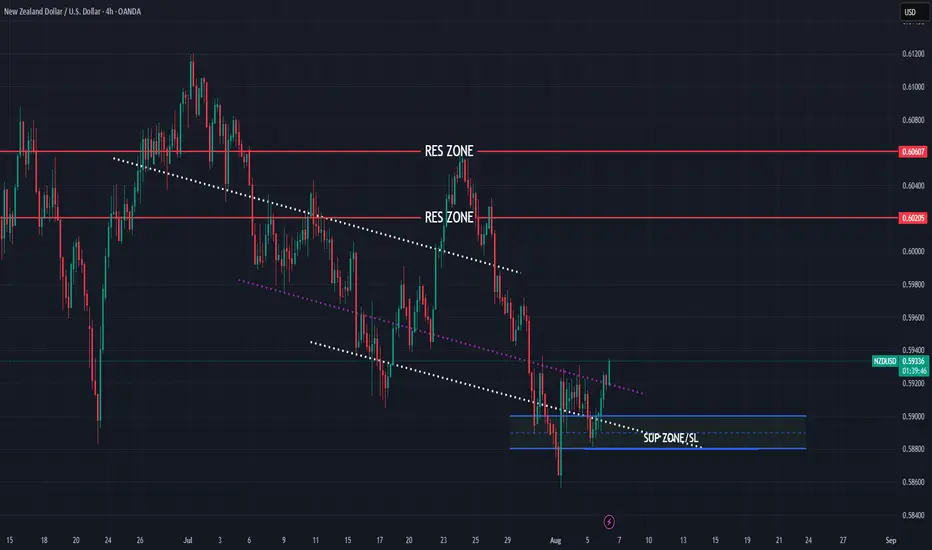
NZDUSD bullish view for this week
OANDA:NZDUSD structure based analysis, price in PA bouncing on bottom line, here bullish expectations for this week.
SUP zone: 0.59000
RES zone: 0.60200, 0.60600
Gold Trading Strategy XAUUSD August 6, 2025Gold Trading Strategy XAUUSD August 6, 2025:
Spot gold edged lower in Asian trading yesterday (August 5), currently trading around $3,380/ounce. On Tuesday, the US ISM Services PMI came in at 50.1, below the forecast of 1.4 and below the previous month's reading of 0.7; the news sent gold prices soaring in the US session.
Fundamentals: Gold prices surged after weak jobs data increased the likelihood of a rate cut by the Federal Reserve. Data released last Friday showed that the number of new jobs in the US non-farm sector was much lower than expected, indicating a sharp deterioration in the labor market. The probability of the Fed cutting interest rates in September increased to 87%, up from 63% last week.
Technical analysis: Gold price is still in the uptrend channel in the H1 frame, the 3365 - 3370 area is supporting the gold price to continue following the price channel. If the gold price continues to fluctuate according to the price channel, the next prospective area could be 3400 - 3405 or even 3420 - 3425. However, the RSI and MA lines have shown signs that the buyers are weakening, so the gold price is very likely to have a strong correction from today until the end of the week.
Important price zones today: 3365 - 3370, 3400 - 3405 and 3420 - 3425.
Today's trading trend: SELL.
Recommended order:
Plan 1: SELL XAUUSD zone 3403 - 3405
SL 3408
TP 3400 - 3390 - 3380 - 3350 - OPEN.
Plan 2: SELL XAUUSD zone 3423 - 3425
SL 3428
TP 3420 - 3420 - 3400 - 3380 - OPEN.
Plan 3: BUY XAUUSD zone 3365 - 3367
SL 3362
TP 3370 - 3380 - 3390 - 3400.
Wish you a safe, successful and profitable trading day.🥰🥰🥰🥰🥰

Next predictions for ZoraI see two scenarios for Zora on the chart, one scenario is a head and Shoulder pattern , which pushes Zora down .
and the next scenario is the possibility of another bullish wave.

EURJPY LONG After seeing price reject 170.000 monthly area of institutional support we saw a sharp push to the upside on the weekly timeframe from last week and we could see the market push to the upside not that the 4hr broke area of structure resistance

CADJPY still bearish to expect
OANDA:CADJPY strong bearish fall in week behind us, for next week still having bearish expectations.
SUP zone: 108.000
RES zone: 105.900, 105.500

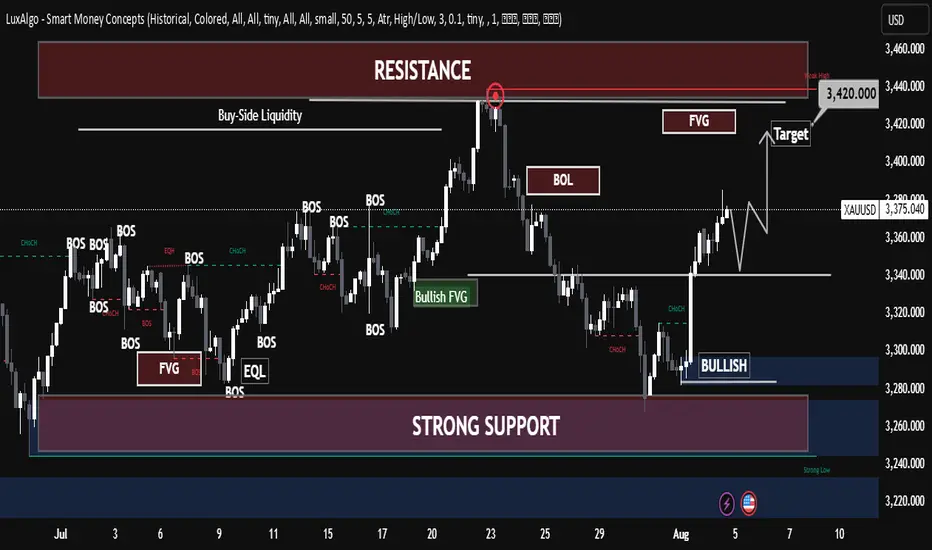
"Gold on Fire! Smart Money Bulls Aiming for Final Target🟡 "Gold on Fire! Smart Money Bulls Aiming for Final Target
Overview:
The XAUUSD chart presents a clear smart money structure, showing a bullish recovery from a strong demand zone and a current move toward a significant supply (resistance) area.
🔍 Key Technical Highlights:
Strong Support Zone
The price reacted powerfully from the well-marked strong support zone (~3,260), aligned with a previous Bullish Fair Value Gap (FVG) and BOS (Break of Structure), confirming bullish intent.
Bullish Market Structure
A clean CHoCH (Change of Character) confirmed the end of the previous bearish leg.
Multiple BOS followed, solidifying the bullish shift in momentum.
Liquidity Grab & Price Expansion
Price swept equal lows (EQL) and mitigated bullish FVG, collecting sell-side liquidity before reversing.
The breakout pushed toward the current level of ~3,380, targeting the Buy-Side Liquidity zone and resistance.
Resistance & Fair Value Gap
The final target is aligned at 3,427.83, situated inside a high-probability bearish FVG and resistance zone.
This area previously rejected price (noted with the red circle), making it a critical supply zone.
Partial Target Hit
Price has already achieved half of the projected move, indicating bullish strength and proper SMC execution.
The current consolidation near the mid-level suggests accumulation or re-accumulation before a final push toward the target.
📈 Educational Notes:
Fair Value Gaps (FVG) highlight inefficiencies in price delivery. These zones often act as magnets for price and reversal points, as seen here.
Break of Structure (BOS) and Change of Character (CHoCH) are crucial for identifying trend shifts. This chart reflects a textbook bullish transition.
Liquidity concepts (EQL, Buy-Side) emphasize institutional behavior. Price often hunts liquidity before moving to new highs or lows.
✅ Conclusion:
XAUUSD is playing out a well-structured bullish smart money setup, with price currently in mid-path toward the final target. Traders should monitor reactions at the 3,427 resistance zone, which will be critical for potential reversal or continuation scenarios.

Technical Breakdown (Smart Money Concepts-Based)📊 Technical Breakdown (Smart Money Concepts-Based):
🔹 Market Structure:
Multiple Break of Structure (BOS) signals show a bullish shift in momentum, especially after the recent CHoCH followed by BOS at the current price zone.
Strong bullish confirmation after reclaiming previous liquidity zones, indicating institutional interest.
🔹 Liquidity and Zones:
Buy-Side Liquidity above $3,420 is likely the short-term institutional target.
Price has clearly reacted from a strong support block near the $3,260–$3,280 area, confirming demand and institutional accumulation.
The highlighted Bullish FVG (Fair Value Gap) aligns with a mid-level retracement zone—ideal for potential pullbacks before continuation.
🔹 Key Supply & Demand:
Resistance Zone (3,420–3,450): Contains weak highs and unmitigated FVG—prime liquidity zone for a sweep.
Strong Demand Zone: Around $3,260 has shown repeated reaction; the base of bullish moves.
Imbalance Fill & Rejection Expected in FVG near $3,420.
🔮 Projection & Scenario:
Expected pullback toward $3,340–$3,350, followed by bullish continuation.
Targeting liquidity sweep at $3,420, aligned with Smart Money accumulation and distribution logic.
Monitor for reaction at $3,420 for either a rejection or a clean breakout, confirming further upside.
✅ Conclusion:
This setup suggests institutional buy-side pressure with targets on resting liquidity around $3,420. Smart Money is likely driving price toward that level to grab orders before the next big move.
XAUUSD Gold Trading Strategy August 5, 2025
Yesterday's trading session, gold prices continued to increase sharply due to previous influences. However, the possibility of a short-term correction in gold prices at the end of the week will be very high.
Basic news: According to CME FEDWatch, the probability of the Fed cutting interest rates at its September meeting has now increased to about 84%, reflecting increasing concerns about economic weakness. The market is currently pricing in at least two 25 basis point cuts between now and the end of the year, showing a clear shift in investor sentiment after disappointing employment data.
Technical analysis: Gold's bullish momentum is currently showing signs of weakening. The peak area of 3383 - 3385 may create a double peak pattern on H1, but the possibility of gold prices correcting today is very low. Currently, gold prices are filling liquidity at support areas. The correction of gold prices may take place at the end of the week when buyers take profits.
Important price zones today: 3350 - 3355 and 3330 - 3335.
Today's trading trend: BUY.
Recommended orders:
Plan 1: BUY XAUUSD zone 3350 - 3352
SL 3347
TP 3355 - 3365 - 3375 - 3400.
Plan 2: BUY XAUUSD zone 3330 - 3332
SL 3327
TP 3335 - 3345 - 3365 - 3400.
Plan 3: SELL XAUUSD zone 3420 - 3422
SL 3425
TP 3417 - 3407 - 3387 - 3357 - OPEN (small volume).
Wish you a safe, successful and profitable trading day.🌟🌟🌟🌟🌟

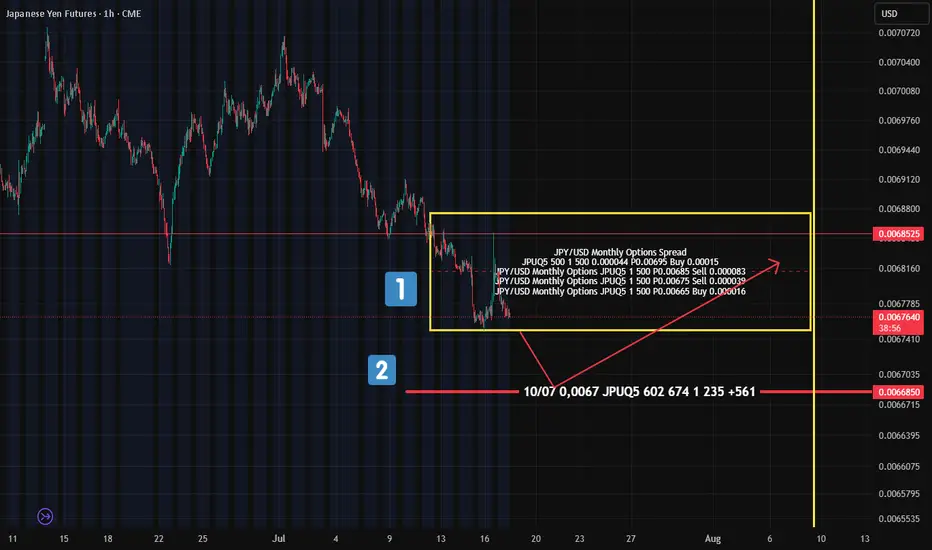
Yen Futures Options: What the "Put Condor" Tells Us About FutureA quick look at the options sentiment on Japanese Yen futures (not spot) — and there’s something interesting on the flow radar.
On July 10 , a "Put Condor" was placed — boundaries marked by the yellow rectangle on the chart (№1).
The goal of this setup? Price should expire within these boundaries — meaning the seller expects limited downside , but still allows for some controlled movement.
What’s notable?
This position was placed before the yen started to weaken — so someone was clearly preparing for this scenario in advance .
Also worth watching:
Further down (№2 on the chart), there’s another cluster of put options at 0.0067 — suggesting this level could act as a support zone if the futures contract drops that low.
📊 Bottom Line:
There are clear signs pointing to continued downside pressure in Yen futures.
The 0.006685 level is key — potential support for a bounce back into the 0.00675–0.00685 range .