GOLD - Consolidation ahead of news. Long squeeze?FX:XAUUSD is trading in the $4575-4600 range (consolidation) ahead of US inflation data (CPI) for December...
Inflation remains above the Fed's target (2%), making the data key to assessing the timing of rate cuts. XAU is consolidating below record highs. Profit-taking is observed ahead of the data release. Geopolitical risks and concerns about the Fed's independence support long-term demand for gold.
The reaction to CPI data may be short-term, as these factors remain a priority:
• Above forecast: dollar growth, gold correction to $4550 - 4520.
• Below forecast: dxy weakening, gold growth to $4650 - 4700
Gold retains its upside potential, but in the near term, its movement will depend on inflation data. Any correction can be seen as a buying opportunity amid ongoing geopolitical and monetary risks.
Resistance levels: 4600, 4630, 4650
Support levels: 4577, 4560, 4550
The initial retest of 4600 may end in a pullback, and a close below 4577 may trigger a decline to 4561 - 4550 before an attempt to grow (interest in the liquidity zone). However, against the backdrop of news reaction, gold may test 4550 - 4520 before continuing to rise. Very weak news may trigger a breakout of 4600 and an aggressive rally. It is important to monitor the context...
Best regards, R. Linda!
Support and Resistance

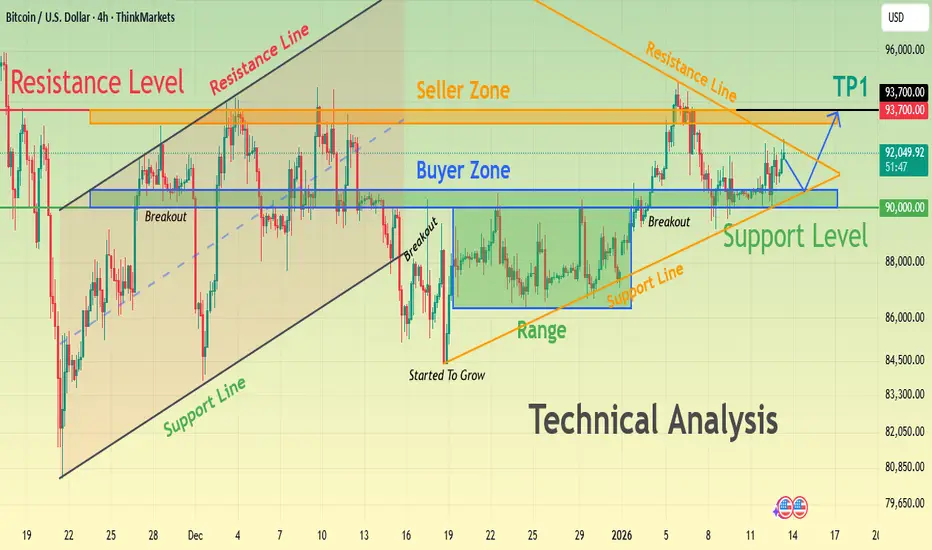
BTCUSD Consolidation Before the Next Big MoveHello traders! Here’s my technical outlook on BTCUSD (4H) based on the current chart structure. Bitcoin is trading within a broader bullish structure after reclaiming key levels and breaking above previous consolidation zones. Earlier on the chart, price respected a rising support line and formed a series of higher lows, signaling growing buyer strength. After a brief pullback, BTC entered a consolidation range, where the market paused before continuing higher. This range acted as an accumulation zone, and the subsequent breakout confirmed renewed bullish momentum. Currently, BTCUSD is trading above the Buyer Zone around the 90,000–91,000 area, which aligns with previous resistance turned support. Price recently broke out from this zone and is now consolidating just below the Seller Zone / Resistance Level near 93,700. This resistance also aligns with a descending resistance line, increasing its significance and making it a key reaction area. My scenario: as long as BTCUSD holds above the Buyer Zone and respects the rising support line, the bullish structure remains intact. A clean breakout and acceptance above the 93,700 Resistance Level would confirm continuation toward the next upside target (TP1). However, a strong rejection from resistance could lead to a corrective pullback back into the Buyer Zone before any further attempt higher. For now, price remains compressed between support and resistance, and a decisive move is likely soon. Please share this idea with your friends and click Boost 🚀
EURUSD Price Action - Support Holds at 1.1670, TP Near 1.1720Hello traders! Here’s my technical outlook on EURUSD (1H) based on the current chart structure. After trading inside a clearly defined range, EURUSD broke to the upside, showing initial buyer strength. However, this bullish move failed to sustain, and price turned around, transitioning into a descending channel. Within this channel, price respected both the falling resistance line and the internal support, forming a consistent sequence of lower highs and lower lows, confirming short-term bearish control. During the decline, EURUSD moved into the Seller Zone, where selling pressure remained active and pushed price lower toward the Buyer Zone. This Buyer Zone aligns with a key Support Level and represents an area where demand previously entered the market. From this level, price reacted strongly, producing an impulsive move up and a clear breakout from the descending channel, signaling a potential shift in short-term structure. Currently, price is holding above the reclaimed support, suggesting acceptance above the former bearish structure. My scenario: as long as EURUSD holds above the Buyer Zone and maintains support, a continuation move toward the Resistance Level around 1.1720 (TP1) is possible. This area also overlaps with the Seller Zone, where selling pressure may reappear. If price fails to hold above support and falls back below the Buyer Zone, the bullish scenario would weaken and the broader bearish structure could resume. For now, price is at a key decision area, with buyers attempting to confirm the breakout and build further upside momentum. Please share this idea with your friends and click Boost 🚀

EURUSD: Sellers Take Control Below Key Resistance, Eyes 1.1600Hello everyone, here is my breakdown of the current EURUSD setup.
Market Analysis
EURUSD previously traded within a well-defined upward channel, confirming a bullish recovery phase after forming a strong base from the prior decline. Buyers maintained control by producing higher highs and higher lows, eventually pushing price toward a key Resistance Zone around 1.1690–1.1700. At this resistance area, price transitioned into a broad range, signaling a balance between buyers and sellers. Multiple attempts to hold above resistance failed, indicating growing selling pressure at the highs. Eventually, EURUSD broke down from the range, confirming a loss of bullish momentum and a shift in short-term market control.
Currently, EURUSD is trading within the descending channel and moving toward a key Support Zone around 1.1600, which previously acted as a demand area and a structural reaction level. This zone represents the next important area where buyers may attempt to slow or pause the decline.
My Scenario & Strategy
My primary scenario remains bearish as long as EURUSD stays below the 1.1690–1.1700 Resistance Zone and continues to respect the downward channel. Any pullbacks into resistance that show rejection can be viewed as potential short opportunities, with downside continuation toward the 1.1600 Support Zone as the first target.
However, a clean breakout and acceptance above resistance would invalidate the short bias and suggest a possible shift back toward consolidation or bullish recovery. Until that happens, market structure favors sellers, and rallies are considered corrective within the broader bearish context.
That’s the setup I’m tracking. Thank you for your attention, and always manage your risk.

XAUUSD Trendline Break & ContinuationPrice has broken above the descending trendline and reclaimed the key support zone, indicating a short-term bullish continuation. A pullback toward support may offer buy opportunities.
Key Levels:
Support: 4600 – 4606
Resistance / First Target: 4633 – 4647
Main Target Zone: 4680 – 4690
Bias remains bullish above support. Wait for confirmation or retest before entry. Risk management is essential.

THE KOG REPORT - UpdateEnd of day update from us here at KOG:
We could have got more!
Yes, we could have ran more on that trade idea but the move worked well and all of our red box targets were completed and exceeded. We got to a point where it was a little too stretched to attempt going long again and due to the break above the target level, shorting was no option.
Now, we have support at the 4606 level and resistance at the 4640 region which are the levels that need to be watched. We can see higher, but at the moment, I'm not confident in going long up here, short only from resistance levels on indi's. 4580 is the level to watch for the break below.
As always, trade safe.
KOG

GOLD - Consolidation ahead of news. ATH retestFX:XAUUSD is trading around $4630, pretty close to its all-time high, but since the session opened, the price has jumped a lot because of the aggressive bull market, which could lead to a correction. News ahead...
US inflation (CPI) slowed in December, and the market expects 2-3 Fed rate cuts in 2026, which exceeds the regulator's forecasts. Protests in Iran and threats of possible intervention by the US; tensions surrounding the independence of the Fed (investigation into Powell); and the tense situation in Eastern Europe are creating geopolitical risks.
• US PPI data will be released today.
• Higher inflation figures may temporarily support the dollar and limit gold's growth.
• Traders are also awaiting the Supreme Court's decision on Trump's tariffs, with a 72% probability of cancellation. If this is confirmed, the market may react strongly...
Resistance levels: 4630, 4650, 4675
Support levels: 4600, 4577
Technically, the ideal scenario would be to wait for a correction, for example to 4605-4600, or to the support level of the trading range to form an ideal entry point. But against the backdrop of an aggressive market, bulls are likely to push the price up from the 4630 zone...
Best regards, R. Linda!

USDACD Price Update – Clean & Clear ExplanationPrice is moving within an ascending channel, respecting trendline support and resistance. After a pullback from the upper channel, the pair is currently reacting from a key demand zone, showing signs of potential bullish continuation.
🔹 Bias: Bullish
🔹 Entry Area: Near channel support / demand zone
🔹 Target 1: Previous resistance / mid-channel zone
🔹 Target 2: Upper resistance zone (channel high)
The structure remains higher highs & higher lows, suggesting buyers are still in control as long as support holds. A strong bullish confirmation candle from this area could trigger upside momentum toward the marked targets.
If you find it please like and comments for this post and share thanks.

GOLD (XAU/USD): Confirmed BoS & More GrowthI see clear confirmed break of structure and a violation of a significant intraday horizontal resistance on a 4-hour timeframe on Gold.
It is highly probable that the market will continue to rise.
The next level to watch is at 4680.

Bitcoin Ranges as Middle East Tensions Raise Sell-Off RiskBitcoin( BINANCE:BTCUSDT ) has experienced both bullish and bearish moves over the past few days under the influence of various news events, resulting in a clear ranging structure.
One key factor that must be considered for Bitcoin and other risk assets is the escalation of tensions in the Middle East. This situation can act as a catalyst for sudden sell-offs across Bitcoin and the broader crypto market.
Currently, Bitcoin is trading near resistance lines, as well as the Cumulative Short Liquidation Leverage($93,150-$92,970), and has reacted precisely to the Potential Reversal Zone(PRZ) .
From an Elliott Wave perspective, Bitcoin appears to be completing a Double Three Correction (WXY) within this short-term range.
I expect Bitcoin to make another attempt toward the lower line of the ascending channel.
If this level breaks, we should be prepared for a deeper decline toward the Cumulative Long Liquidation Leverage zone($90,360-$89,360).
First Target: $90,773
Second Target: $89,903
Stop Loss(SL): $90,923
Points may shift as the market evolves
CME gap: $88,720-$88,120
What do you think about Bitcoin in the short term? I’d love to hear your thoughts!
Cumulative Long Liquidation Leverage: $87,125-$86,000
💡 Please respect each other's opinions and express agreement or disagreement politely.
📌Bitcoin Analysis (BTCUSDT), 1-hour time frame.
🛑 Always set a Stop Loss(SL) for every position you open.
✅ This is just my idea; I’d love to see your thoughts too!
🔥 If you find it helpful, please BOOST this post and share it with your friends.

XAUUSD: Critical Supply Zone - Reaction May Define Next MoveHello everyone, here is my breakdown of the current XAUUSD setup.
Market Analysis
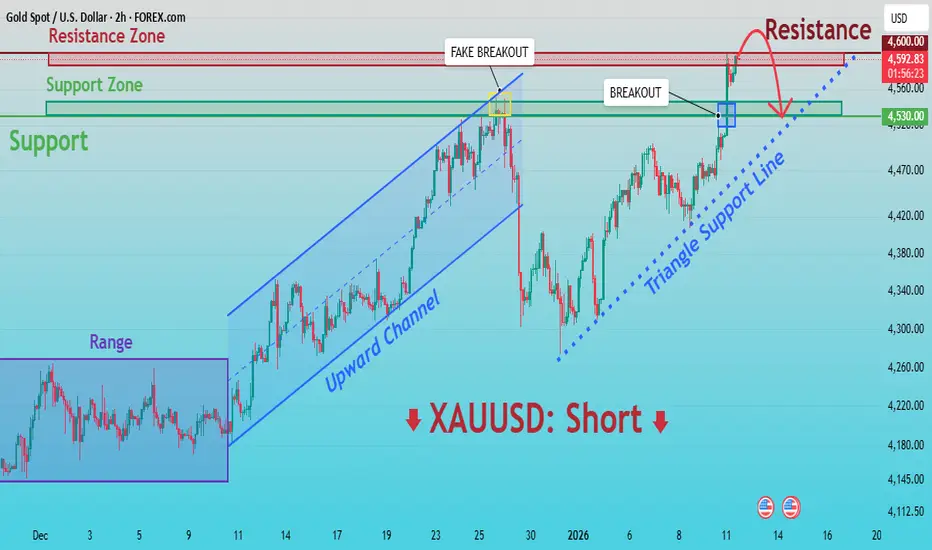
Gold is trading within a broader bullish environment, but recent price action shows signs of exhaustion near key resistance. After a period of consolidation inside a clear range, XAUUSD broke to the upside and formed a well-defined upward channel, confirming buyer control. This move brought price into the upper Resistance Zone around 4,590–4,600, where strong selling pressure emerged.
Currently, at this level, price printed a fake breakout, indicating a lack of acceptance above resistance and trapping late buyers. Following this rejection, gold pulled back sharply and then staged a recovery, breaking above the local structure again and retesting the Support Zone near 4,530. This area aligns with previous resistance turned support and a rising triangle support line, which is currently being tested. Despite the bullish recovery, price is once again approaching the major resistance area, where sellers have previously shown strong interest. The market structure suggests that the current move is corrective within a larger resistance context rather than the start of a fresh impulsive rally.
My Scenario & Strategy
My primary scenario favors a short setup while price remains below or reacts strongly from the 4,590–4,600 Resistance Zone. A rejection from this area could trigger a move back toward the 4,530 Support Zone and potentially lower if selling momentum increases.
However, a clean breakout and acceptance above 4,600 would invalidate the short bias and signal bullish continuation. Until that happens, the resistance area remains a key decision point, and caution is warranted near the highs.
That’s the setup I’m watching. Thank you for your attention, and always manage your risk.
GOLD Price Update – Clean & Clear ExplanationGold is currently trading inside a well-defined ascending channel, respecting both higher highs and higher lows, which confirms a short-term bullish structure. Price has steadily climbed from the lower boundary of the channel and is now approaching a major supply / resistance zone near the channel top.
Multiple key supply zones are marked above current price, indicating strong selling pressure may enter the market. The recent bullish push shows momentum, but price is now overextended into resistance, increasing the probability of a reaction.
📉 Bearish Scenario (Preferred): If price shows rejection or a false breakout near the upper supply zone, a sell opportunity may form, targeting:
📈 Bullish Continuation Scenario: If price breaks and holds above the supply zone with strong momentum, continuation toward higher resistance levels is possible—but confirmation is required.
⚠️ Conclusion: Gold is at a critical decision zone. Patience is key. Wait for price action confirmation (rejection or breakout) before entering trades.
If you find it please like and comments for this post and share thanks.

GOLD Bullish XAUUSD (1H) is holding above key support around 4600, showing bullish structure. A pullback from support could lead to continuation toward targets at 4660 and 4700.

Bitcoin Price Update – Clean & Clear ExplanationBitcoin after a long period of consolidation and choppy movement, price has started making higher lows and higher highs, which signals growing buying strength.
Previously, Bitcoin faced rejection from a descending trendline, but after breaking above it, price pulled back and found strong support around the 90,000–91,300 zone. This area is acting as a demand zone, where buyers are consistently stepping in to defend price.
Currently, BTC is breaking above the recent consolidation range, which suggests that momentum is shifting back to the upside. As long as price holds above the support zone, the bullish bias remains valid.
As long as Bitcoin stays above the support zone, the market structure remains bullish. Buyers are in control, and a move toward 95k and then 97k is likely. A clear break below 88,500 would invalidate this bullish setup.
If you find it please like and comments for this post and share thanks.

GOLD Consolidation remains bullish continuallyGold prices slipped below 4580 per ounce on Tuesday, retreating after hitting a record high in the previous session. The pullback comes as traders book profits following strong safe-haven demand driven by uncertainty surrounding the Federal Reserve and escalating geopolitical tensions in Iran.
Adding to market volatility, U.S. prosecutors have reportedly launched a criminal investigation into Federal Reserve Chair Jerome Powell related to his testimony last June. Powell has characterized the move as part of former President Donald Trump’s ongoing efforts to pressure the Fed into cutting interest rates.
Meanwhile, investors are closely watching developments in the Middle East after Trump announced 25% tariffs on countries trading with Iran, intensifying pressure amid widespread protests in the country. He has also reiterated the possibility of military action, further supporting safe-haven demand.
Technical Outlook;
If bullish momentum holds, today’s high-impact CPI data could push prices higher on the upside, immediate resistance is seen around 4,620–4,640 If prices show weakness, gold may retest support near 4,575 / 4,560, before potentially rebounding again.
You may find more details in the chart,
Trade wisely best of luck buddies.
Ps; Support with like and comments for better analysis thanks for supporting.

Brent Oil Breaks Resistance as Middle East Tensions EscalateWith the start of the new week, Brent Oil( BLACKBULL:BRENT ) has continued its bullish trend.
Given the escalating tensions in the Middle East, a region that is crucial for global oil production, oil prices have risen accordingly.
Brent Oil has successfully broken through the resistance zone($63.30-$62.00) and resistance lines and is currently completing a pullback to these levels.
I expect that, given the potential for renewed tensions in the Middle East in the coming days and hours, the bullish trend in oil will continue, supported by both fundamental and technical analysis, and it will reach the targets set in the chart.
First Target: $64.91
Second Target: $65.77
Stop Loss(SL): $62.07
Points may shift as the market evolves
💡 Please respect each other's opinions and express agreement or disagreement politely.
📌U.S. Dollar/Brent Crude OIL Analysis (USDCAD), 4-hour time frame.
🛑 Always set a Stop Loss(SL) for every position you open.
✅ This is just my idea; I’d love to see your thoughts too!
🔥 If you find it helpful, please BOOST this post and share it with your friends.

ETHUSDT Price test the resistance after false continually ETHUSDT is approaching a key upper resistance zone, and price action suggests we could see a retest of resistance following a false downside move. A local resistance area is identified between 3,400 – 3,450, where sellers may step in.
Tecnically on-chain and market rotation data indicate that as macro uncertainty has returned and altcoin momentum has faded, capital has been rotating steadily back into Bitcoin and Ethereum. This supports ETH relative strength, even as broader risk appetite cools.
If price respects the bearish trend structure and fails to break cleanly above resistance after the false downside, we could expect a pullback toward key support levels. The primary downside support zone lies between 3,250 – 3,150, which may act as a demand area for a potential bounce.
You may find more details in the chart,
Trade wisely best of luck buddie
Ps; Support with like an comments for better analysis thanks for supporitng.

Ethereum — Stronger Signal Than BTC
BBG:ETHEREUM has printed a stronger signal than CRYPTOCAP:BTC , sooner than I expected. On top of that, $ETH/BTC is holding its ground, which is exactly what you want to see if ETH is gearing up for relative outperformance.
Will ETH outperform BTC over the next couple of months?
Chart-wise, it looks like it could, but this is something we need to track continuously to avoid losing sats if the setup fails.
For now, the signal is there — and **we act on signals, not opinions**. If you haven’t positioned yet, this is the moment where ETH deserves attention.
If structure continues to hold and momentum follows through, a new ATH is absolutely on the table.

S&P 500 | CPI In Line, Earnings Pressure Drives VolatilityS&P 500 Dips Despite Steady December Inflation | JPMorgan Weighs on Sentiment
The S&P 500 slipped 0.2% on Tuesday, pressured by a 4.2% decline in JPMorgan shares, despite the bank reporting generally solid fourth-quarter results.
However, profits fell 7% and investment-banking fees declined, raising concerns that dealmaking activity—often a key risk-on signal for the economy—may be slowing.
On the macro side, December CPI came in at 2.7%, exactly in line with expectations. Core inflation, which excludes food and energy, also remained unchanged instead of ticking higher.
Normally, this stable inflation backdrop would support equities, as it gives the Federal Reserve more flexibility to cut rates without reigniting inflation fears.
Still, earnings sentiment outweighed the inflation data, with JPMorgan’s results overshadowing the otherwise supportive CPI print.
Technical Outlook
- Above 6918: The bullish structure remains intact
- A confirmed break below 6918 is required to shift momentum into a bearish trend, targeting 6877
- While trading above 6918–6944, bullish momentum is favored
- A corrective pullback toward 6918 remains possible from the 6943–6945 zone before continuation
Key Levels
Pivot Line: 6918
Resistance: 6995 – 7020
Support: 6900 – 6877 – 6820

#NAS100 Buy Trade Scenario #NAS100/USD Just am update you That Market price done BOS so hopefully now price going to upside.

Potential V shape reversal chance in POLICYBZR.A sign of reversal is formed at swing low and as price is breaking lows of previous session's since 11 sessions, I think there can be a chance of pullback from here.

GBPUSD 4H Technical ChartGBP/USD Sells taken, will we see new lows after breaking daily low ? with first TP 1.335 ? watch out for GDP news on 15th Jan

US100 Technical Outlook – Bullish Bias IntactUS100 continues to display a bullish market structure, with price respecting the ascending trendline and consistently forming higher lows, confirming sustained buying pressure.
Broader market conditions remain supportive. Wall Street indices were mixed on Tuesday, while the U.S. dollar pulled back after inflation data reinforced expectations for rate cuts later this year. Meanwhile, oil prices surged as geopolitical tensions in Iran outweighed concerns about excess supply — adding volatility but not derailing risk appetite.
A Price is currently consolidating near the upper boundary of the rising channel, between 25,850 and 26,000, a key resistance zone. This sideways movement suggests accumulation rather than distribution, indicating the market is pausing before its next move.
The projected path favours a shallow pullback (healthy correction) before a renewed bullish continuation. As long as price holds above the mid-support zone at 25,600 – 25,500, buyers are likely to step back in, keeping the broader uptrend intact.
You may find more details in the chart,
Trade wisely best of luck buddies.
Ps; Support with like and comments for better analysis thanks for supporting.
