NB Bullish Multi-Timeframe Swing Trade SetupNASDAQ:NB getting attention lately.
Bull trend is already established.
Strong monthly ADX. Prior 65% advance.
Constructive pullback, holding between rising 50 & 100 day SMAs.
Rounding structure.
Watching for expansion from here.
Swingtradesetup

Breakout in CAMSBreakout in CAMS
Entry - 3967
Target - 4370
SL - 3870
DISCLAIMER: I am not SEBI registered and the ideas posted are only for educational purpose. Do a proper analysis and always trade with STOP LOSS.

PHOENIX MILLS LTD looks good for 1655PHOENIX MILLS LTD looks good for 1655
Entry - 1561 to 1571
Stop loss - 1548
Target - 1655
Risk Reward - 1:7.1

Swing trade opportunity in INOX WINDSwing trade opportunity in INOX WIND.
Entry - 150
Targets - 175 & 190
DISCLAIMER: I am not SEBI registered and the ideas posted are only for educational purpose. Always trade with proper STOP LOSS.

TATAMOTORS looks good for 740TATAMOTORS looks good for 740
Entry - 672.9
Stop loss - 666.65
Target - 740
Risk Reward - 1:10.7

IGL looks good for 222IGL long for 222
Entry - 207 to 206.75 ( Triggered )
Stop loss - 204.65
Target - 222
Risk Reward - 1:6.3

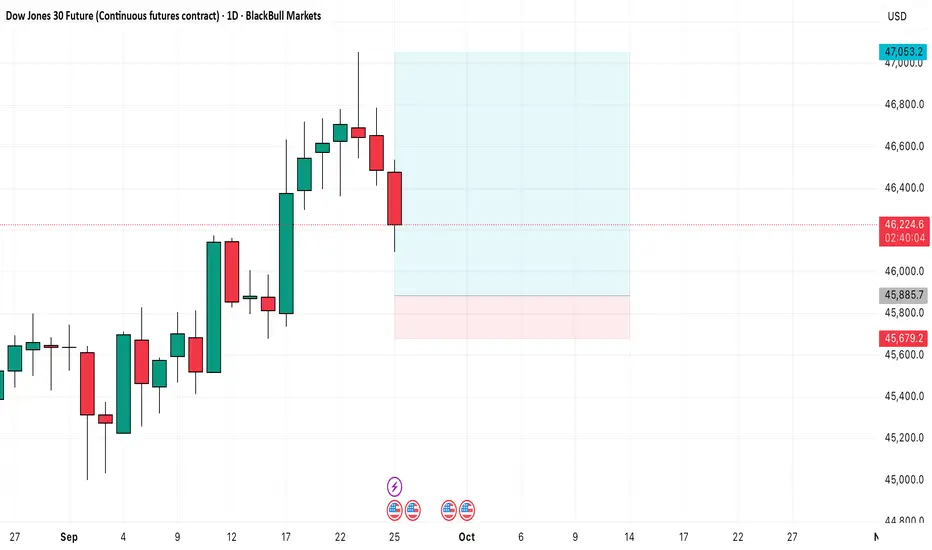
DOWFUT long setupDOWFUT long setup
Entry - 45885.7
Stop loss - 45679.2
Target - 47053.2
Risk Reward - 1:5.65
PNB looks good for 115PNB looks good for 115
Entry - 108.68
Stop loss - 107.3
Target - 115
Risk Reward - 1:4.6

Prestige Estate looks good for 1670Prestige Estate looks good for 1670
Entry - 1561.9 to 1576.5
Stop loss - 1520
Target - 1670
Risk Reward - 1:2.5

TATAMOTORS looks good for 725Tatamotors long view
Entry - 666 (Triggered)
Stop loss - 657.7
Target - 725.25
Risk Reward - 1:7.14

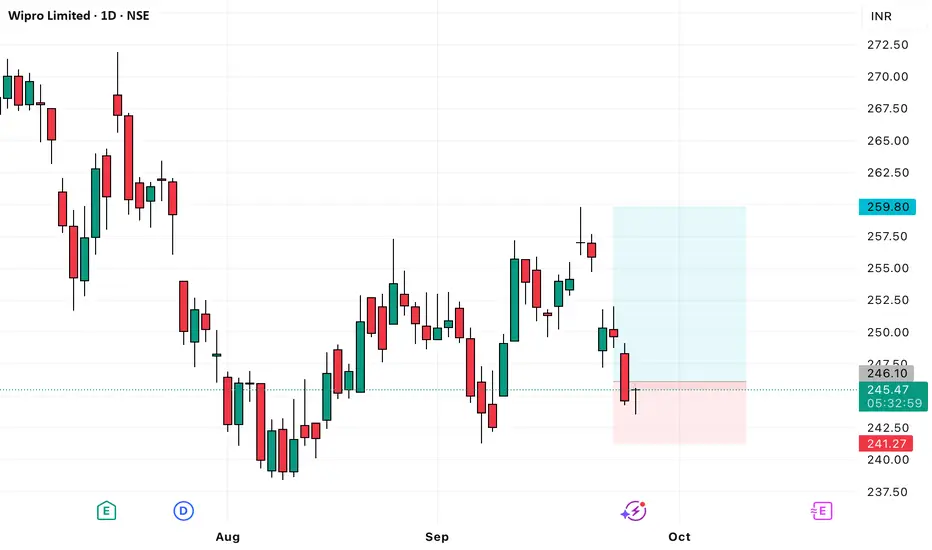
Wipro long setup looks good for 259Wipro looks good for 259
ENTRY - 244.36 to 246.1
Stop loss - 241.27
Target - 259.8
Risk Reward - 1:2.84
Nelco looks good for 938Nelco
Entry - 852.15
Stop loss - 839
Target - 939
Risk Reward - 1:6.6
Setup valid until 2 days close below the Stop loss level.

Nifty50 long setupNifty 50 long setup
Entry - 24715.05
Stop loss - 24522.35
Target - 25448.95
Risk Reward - 1:3.8

BHARATFORG long for 1278BHARATFORG looks good for 1278
Entry - 1205 (Triggered)
Stop loss - 1194
Target - 1278.5
Risk Reward - 1:6.6

LATENTVIEW long setupLATENT view long setup
Entry - 414.2
SL - 410.15
TGT - 434.2
Risk Reward - 1:4.94

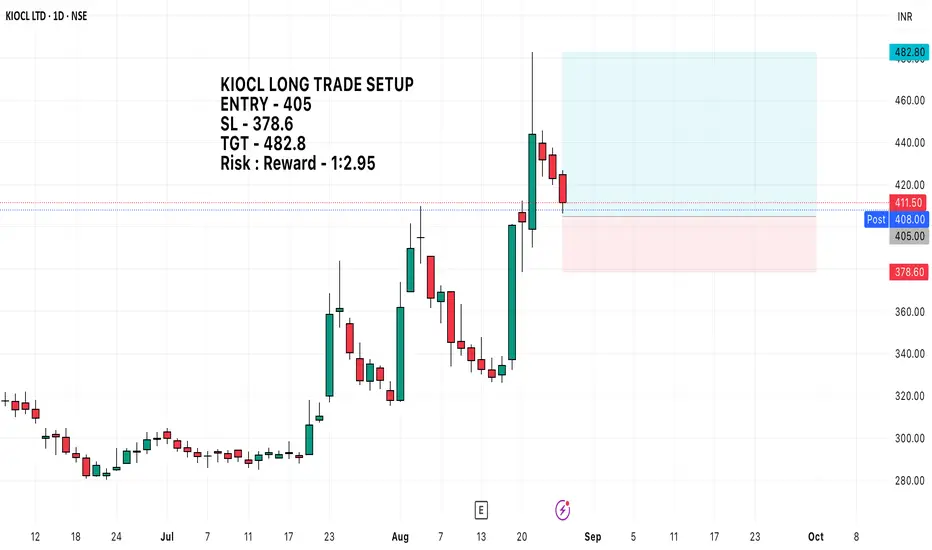
KIOCL Long setupKIOCL LONG TRADE SETUP
ENTRY - 405
SL - 378.6 (Max SL stretch to 375)
TGT - 482.8
Risk : Reward - 1:2.95

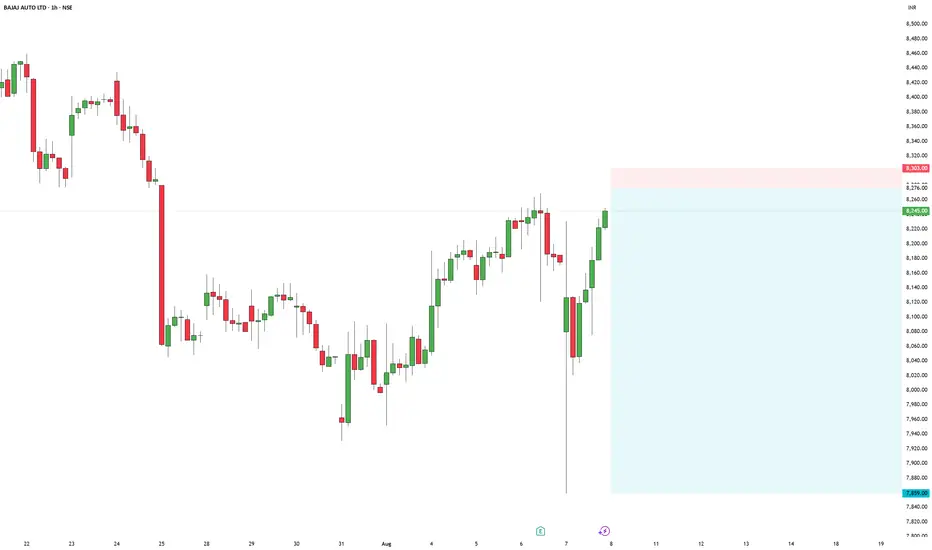
BAJAJAUTO short setupBajaj-Auto short setup
CMP - 8245
Entry - 8276
Stop loss - 8303
Target - 7859
Risk Reward - 1:15.44
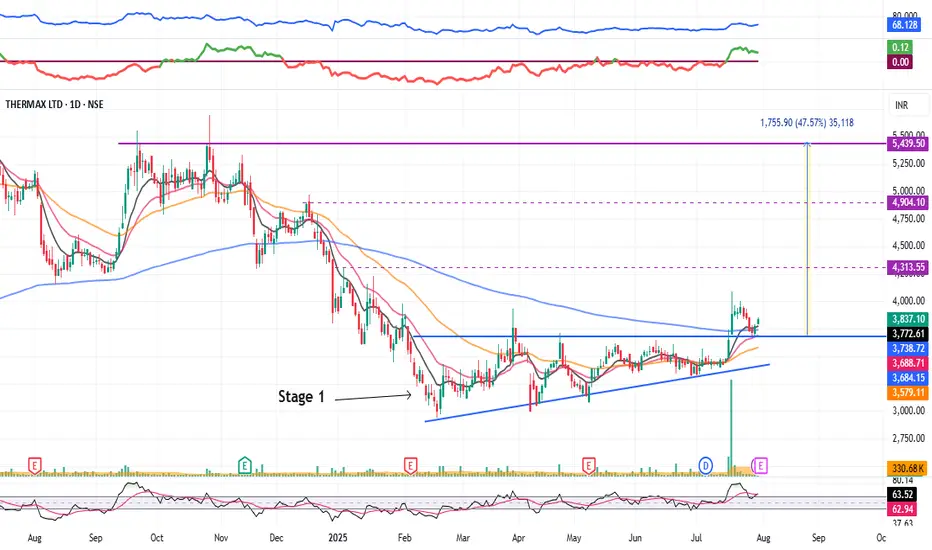
Thermax : Stage 1 Breakout (1-3 Months)#Thermax #stage1nreakout #ascendingtrianglepattern #patternbreakout #trendingstock #swingTrading
Thermax : Swing Trading
>> Stage 1 Breakout + Retest done
>> Ascending Triangle @ bottom of Downtrend
>> Trending setup in stock
>> Good strength & Recent Volume Buildup
>> Low Risk High Reward Trade
Swing Traders can lock profit at 10% and keep trailing
Pls Boost, comment & Follow for more Analysis
Disc : Charts Shared are for Learning Purpose & not a Trade recommendation. Pls consult a SEBI Registered Advisor before taking position in it
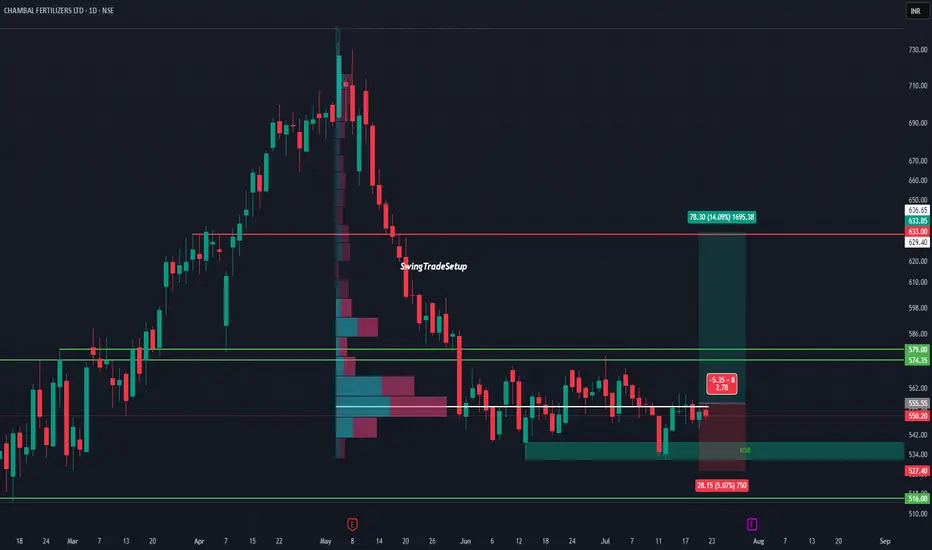
CHAMBAL FERTILISERS LTD – Potential Bottoming Out‽CHAMBAL at Demand Zone | Volumes story
After a steep fall from 730 to 516, Chambal is now consolidating in a critical demand zone backed by visible volume activity. This range has previously triggered price reversals, and now history might repeat.
The stock is respecting the support between 527–516, forming a potential base. On the upside, a clean breakout above ₹555.55 can unlock a near-term target of 633+, a move of over 14%.
The risk-to-reward ratio remains attractive with a tight invalidation below ₹527, while the volume profile suggests accumulation in this range.
Technical View :
• Major support: ₹516–527
• Breakout trigger: ₹555.55
• Upside target: ₹633–636
• Risk below: ₹527
• Volume profile: Dense node suggests buyer interest
Valuation :
• PE: ~10.3 (undervalued vs peers)
• Dividend Yield: ~6.5% (steady income potential)
• Promoter Holding: 60.62% (strong & stable)
• No recent equity dilution
• DII/FII: Activity neutral, could turn if technical align
A good mix of fundamentals, attractive valuation, and technical structure makes this a stock to keep an eye on. If it crosses ₹560 with volume, it may kick off a short-term trend reversal.
This chart is for educational use only and not a buy/sell recommendation.
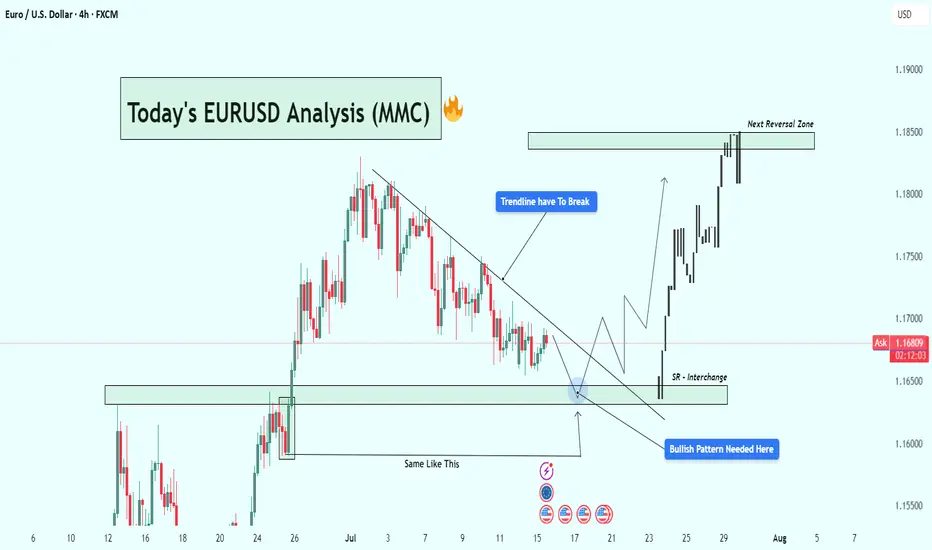
EURUSD Analysis : Eyes on Bullish Breakout Setup + Target🧭 Current Market Context:
The EURUSD pair is currently trading near 1.16765 on the 4H timeframe, displaying classic accumulation behavior at a key Support-Resistance Interchange Zone (SR Flip). After an extended bearish correction from the previous swing high, price has started compressing in a descending structure underneath a well-respected trendline. This tightening range near a historic support zone suggests that a major breakout could be on the horizon.
🧠 Technical Confluences:
🔹 1. Descending Trendline - Bearish Control Line:
The trendline drawn from the July highs has acted as a clear resistance line, rejecting multiple bullish attempts to break higher.
Price has failed to close above it on the 4H chart, showing sellers are still in control—but momentum is fading.
A breakout of this line is a crucial confirmation of buyer strength returning.
🔹 2. SR Flip Zone - Interchange Area:
This zone previously acted as resistance, capping the rally in June.
After price broke above it, the same area now acts as support, confirming its role as an SR flip zone—a textbook demand level.
Smart money often steps in at these interchange areas to accumulate long positions.
🔹 3. Re-accumulation Phase (Smart Money Behavior):
Market structure is showing a rounded bottom formation, hinting at possible absorption of sell-side liquidity.
Price action is compressing into the support zone, reducing volatility—a signal that a reversal or breakout is near.
The previous similar move ("Same Like This") from late June led to a strong bullish impulsive wave—this historical behavior adds confidence in the current bullish outlook.
🔹 4. Potential Bullish Pattern:
Price needs to develop a bullish reversal pattern (e.g., inverse head & shoulders, bullish engulfing, or a sweep of the low with rejection).
Only then will the setup be validated. This is not a blind buy zone, but a zone of interest for high-probability longs if price confirms.
🧨 Trade Plan Scenarios:
✅ Scenario 1 - Confirmation Breakout:
Wait for a clean breakout above the descending trendline.
Enter on breakout + retest structure.
Target the next major reversal zone at 1.18500.
🐢 Scenario 2 - Early Long Entry:
Enter on bullish confirmation (engulfing, pin bar, etc.) at the SR Interchange zone.
Stop loss below the support box.
Ride early for better R:R if the breakout confirms.
❌ Invalidation:
A clean breakdown below 1.1600 with momentum will invalidate the bullish bias.
In that case, reevaluate based on new structure.
📊 Projected Path:
If the trendline breaks, expect a bullish rally toward the next major resistance zone (1.18500).
That zone has historically acted as a major reversal and profit-taking level for bulls, and we expect price to react again if tested.
🔍 Macro View (Optional Insight):
USD may show weakness due to macro data (CPI/FED talks), helping EURUSD lift.
Eurozone data stability could further fuel demand for EUR.
📌 Final Thoughts:
This EURUSD setup is forming at a high-value area, backed by technical structure, historical behavior, and smart money positioning. If the price reacts positively from this zone and breaks the descending trendline, it could trigger a bullish leg toward 1.18500, offering a rewarding risk-to-reward opportunity for both swing and short-term traders.
Stay patient. Let the market confirm the direction before execution. 📈
USDJPY Analysis : Bearish Setup from Reversal Zone + Target⚠️ Overview:
The USDJPY 4H chart reveals a smart money-driven bearish setup, unfolding precisely from a major Reversal Zone, which aligns with a key supply area. Price action is now offering high-probability short trade opportunities, supported by structural breaks, clear CHoCHs (Change of Character), and BOS (Breaks of Structure).
🔎 Detailed Technical Breakdown:
🔹 Bearish Pattern + Channel Formation:
The pair formed a bearish price pattern earlier, which initiated the previous downtrend. This move developed into a well-formed descending channel, showing controlled distribution from the institutional side. The channel break marked a liquidity grab below previous lows, trapping retail sellers before shifting structure.
🔹 Channel Insider Demand + Breakout:
After reaching the Channel Insider Demand, USDJPY made a strong bullish push, causing a Minor BOS — a sign of temporary bullish pressure. However, this move served to rebalance price into a premium zone, which is the current Reversal Zone. This zone lies near previous imbalance/fair value gaps and coincides with a supply structure, making it a high-reaction area.
🔹 Reversal Zone (Premium Area):
Price tapped the Reversal Zone and began rejecting aggressively. This reaction indicates the presence of large sellers and order blocks. The current price action now displays a Minor CHoCH, suggesting a short-term bearish shift in order flow.
This is a textbook case of premium vs. discount pricing, where price seeks liquidity above recent highs before reversing to more balanced zones.
🔹 Price Flow Expectations (Downside Targets):
The first confirmation of bearish continuation will come with a clean break below the Minor CHoCH level (~144.400). Following that, momentum is expected to carry USDJPY toward:
🥇 Target 1: 144.00 – Local support / liquidity pocket
🥈 Target 2: 143.00 – Key psychological & structural support
🥉 Target 3: 142.00–142.50 Zone – Marked as the Next Reversal Zone, which could act as demand
This setup remains valid as long as the price remains below 147.200, which is the high of the Reversal Zone. A breakout above this invalidates the bearish thesis.
🧠 MMC (Mind Market Curve) Interpretation:
The chart clearly respects Mind Curve Theory structure:
CHoCH/BOS confirms internal order flow
Reversal zone is placed at a curve top (premium)
Support base (discount zone) is yet to be revisited
The curve shape guides a possible rounded rejection scenario, pushing price down into the major support, aligning with smart money liquidity grab behavior.
📊 Strategic Insight:
This is a classic smart money trap — fake bullish breakout, quick grab of early breakout traders’ stops, followed by a decisive turn from supply.
Traders should monitor:
Candle structure at current levels
Reaction to minor CHoCH zone (~144.400)

Swing Trading: Unique Features and StrategiesSwing Trading: Unique Features and Strategies
Swing trading stands out as a dynamic approach in the trading world, blending elements of both short-term and long-term strategies. In this article, we will explore the unique features of swing trading, including its reliance on technical analysis, the use of chart patterns, and the strategic timing of entries and exits. Whether you're new to trading or seeking to refine your approach, understanding the nuances of swing trading can provide valuable insights into navigating the financial markets.
The Basics of Swing Trading
Swing trading meaning refers to a style that involves holding short- and medium-term positions - usually from a couple of days to a few weeks - with the aim of capitalising on the “swings” in the market.
What is a swing trader? A swing trader’s definition is simple: swing traders are those who typically enter and exit markets at significant support and resistance levels, hoping to capture the bulk of expected moves.
These traders tend to look at hourly to weekly charts to guide their entries, although the timeframe used will depend on the swing trader’s individual approach and the asset being traded. Swing trading can be used across all asset classes, from stocks and forex to cryptocurrencies* and commodities. In the stock market, swing trading can be especially effective, as stocks tend to experience high volatility and are subject to frequent news and events that can drive prices.
Swing traders predominantly use technical analysis to determine their entries and exits, but fundamental analysis, like comparing the interest rates of two economies, can also play a significant role. It can help determine a price direction over the course of days or weeks.
Swing Trading vs Other Styles
To better understand the unique features of swing trading, let’s compare it with our styles.
Position trading involves holding trades for weeks and months, focusing on capturing long-term trends. Position traders are less concerned with short-term fluctuations and are more likely to use fundamental analysis, such as economic data and company earnings, to make their decisions. This style requires patience and a long-term perspective, with fewer trades but potentially larger returns per trade.
Swing trading involves holding trades for several days to a few weeks, aiming to capture short- and medium-term price movements within a larger trend. This style balances the need for active market participation with the flexibility to not monitor trades constantly. Swing traders primarily rely on technical analysis to identify entry and exit points, focusing on chart patterns and indicators.
Day trading requires traders to buy and sell assets within the same trading day, often holding positions for just minutes or hours. The goal is to capitalise on intraday price movements, and traders close all positions before the market closes to avoid overnight risk. This style demands constant market monitoring and quick decision-making, with a strong reliance on real-time technical analysis.
Scalping is an ultra-short-term trading style where positions are held for seconds to minutes, aiming to make small profits on numerous trades throughout the day. Scalpers rely almost entirely on technical analysis and need to act quickly, often executing dozens or hundreds of trades daily. The focus is on high-frequency trading with very tight stop-losses, requiring intense concentration.
Swing Trading: Benefits and Challenges
Although swing trading provides numerous opportunities which makes it popular among traders, it comes with a few challenges traders should be aware of.
Benefits:
- Lower Time Commitment. One of the most significant benefits for swing traders is the reduced time commitment. This style can be adapted to suit a trader’s individual schedule.
- Flexibility. It is often more flexible than other styles. Not only does it offer time flexibility, but it allows for a wider range of tools to be used to determine price swings. Also, it can be applied to many assets. The most common is swing trading in forex and swing trading in stocks.
- Technical Analysis Focus: Utilises technical indicators and chart patterns to identify entry and exit points, providing clear criteria for decision-making.
- More Opportunities Compared to Long-Term Techniques. Because swing traders usually hold positions for a few days to a few weeks, they have the ability to take advantage of shorter-term market movements that might not be reflected in longer-term price trends.
Challenges:
- Exposure to Overnight Risk. Positions held overnight or over weekends can be affected by unexpected news or events, leading to potential gaps or adverse price movements.
- Requires Patience: Effective swing trading requires waiting for trades to develop over days or weeks, which may test a trader's patience.
- Market Volatility: Performance can be impacted by periods of low volatility or choppy markets, where price movements may not align with your expectations.
Popular Tools to Use When Swing Trading
The effectiveness of a swing traders’ strategies will ultimately depend on their ability to correctly identify price movements. For this, traders use different chart patterns and technical indicators. Here are three common tools that can be used as part of a swing trading strategy.
Channels
Traders can use channels to take advantage of well-identified price trends that play out over days and weeks. To plot a channel, you first need to identify a trending asset that’s moving in a relative zig-zag pattern rather than one with large jumps in price. Traders will often use the channel to open a swing trade in the direction of the trend; in the example above, they might look to buy when the price tests the lower line and take profit when the price touches the upper line of the channel.
Moving Averages
Moving averages (MAs) are one of the commonly used indicators and they can help swing traders determine the direction of the trend at a glance. The options here are endless:
- You could pair fast and slow moving averages and wait for the two to cross; this is known as a moving average crossover. When a shorter MA crosses above a longer one, the price is expected to rise. Conversely, when a shorter MA breaks below a longer one, the price is supposed to decline.
- You could stick with one and observe whether the price is above or below its average to gauge the trend. When the price is above the MA, it’s an uptrend; when it’s below the MA, it’s a downtrend.
- You could use an MA as a support or resistance level, placing a buy order when the price falls to the MA in an uptrend and a sell order when it rises to the MA in a downtrend.
Fibonacci Retracements
Lastly, many swing traders look to enter pullbacks in a larger trend. One of the most popular ways to identify entry levels during these pullbacks is the Fibonacci Retracement tool. Traders typically wait for a shift in price direction, then apply the tool to a swing high and swing low. Then, they enter at a pullback, usually to the 0.5 or 0.618 levels, to take advantage of the continuation of the trend. As seen above, this strategy can offer entry points for those looking to get in early before a trend continues.
The Bottom Line
Swing trading stands out for its ability to balance the demands of active trading with the flexibility of longer-term investing. The unique features of swing trading, such as its moderate holding periods and strategic use of technical indicators, allow traders to potentially manage risk and adapt to various market conditions. Embracing swing trading strategies can help traders refine their approach. As with any trading style, continued learning and disciplined execution are key to achieving consistent results.
FAQ
What Is Swing Trading?
Swing trading is a style that involves holding positions over a period of several days to weeks to take advantage of price movements within a trend. Swing traders use technical analysis, including chart patterns and indicators, to identify potential entry and exit points, balancing the need for active participation with a longer-term perspective.
What Is Swing Trading vs Day Trading?
Swing trading and day trading are distinct methods. The former focuses on capturing price movements over several days to weeks, allowing for less frequent trading and requiring less constant market monitoring. In contrast, the latter involves buying and selling assets within the same trading day, often holding positions for minutes or hours, and requires continuous market observation and quick decision-making.
What Is the Downside of Swing Trading?
The downsides of swing trading include exposure to overnight and weekend risks, as positions held outside market hours can be affected by unexpected news or events. Additionally, this method requires patience and discipline, as trades may take time to develop, and performance can be impacted by periods of low volatility or choppy markets.
*Important: At FXOpen UK, Cryptocurrency trading via CFDs is only available to our Professional clients. They are not available for trading by Retail clients. To find out more information about how this may affect you, please get in touch with our team.
This article represents the opinion of the Companies operating under the FXOpen brand only. It is not to be construed as an offer, solicitation, or recommendation with respect to products and services provided by the Companies operating under the FXOpen brand, nor is it to be considered financial advice.
