XRP Pullback Play — 0.786 Fib Meets Sell-Side LiquidityXRP is currently in a pullback phase. The next high-probability long setup is at the 0.786 Fibonacci retracement, aligning with a Sell-Side Liquidity (SSL) zone.
🟢 Long Trade Setup
Entry Zone: 0.786 retracement
Stop-Loss: Below $2.80
Take-Profit 1: $3.00 (mOpen)
💡 Educational Insight
Sell-Side Liquidity (SSL) represents the pool of stop-losses and pending buy orders resting below recent swing lows. Price often seeks these liquidity pockets before reversing.
The 0.786 retracement aligns with this SSL zone, creating a high-probability setup.
However, confirmation should come from order flow → monitoring absorption, delta shifts, or footprint imbalances at this level will validate whether buyers are stepping in before entering.
🔍 Indicators used:
DriftLine — Pivot Open Zones → For identifying key yearly/monthly/weekly/daily opens that act as major S/R reference points
➡️ Available for free. You can find it on my profile under “Scripts” and apply it directly to your charts for extra confluence when planning your trades.
_________________________________
💬 If you found this helpful, drop a like and comment!
Swingtrading

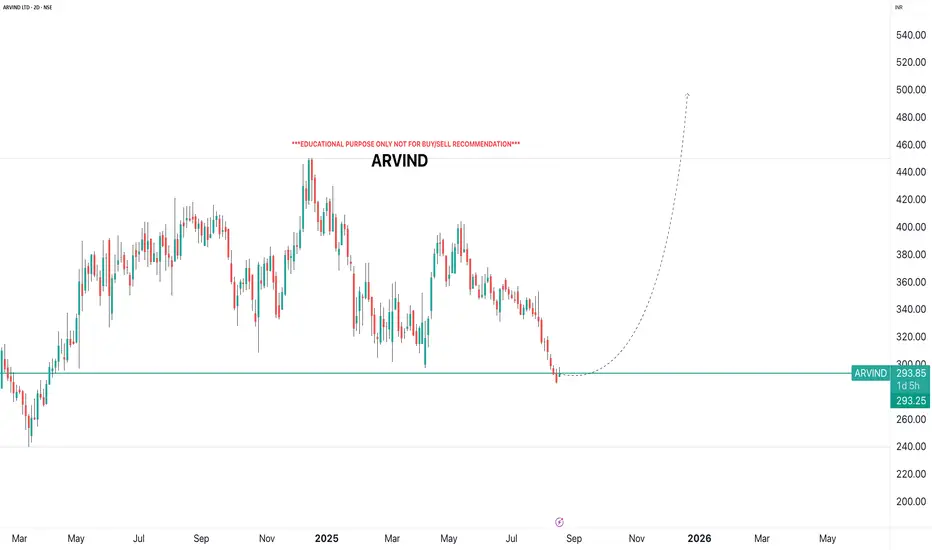
ARVINDi Observed these Levels based on Price Action and Demand & Supply which is my own Concept "PENDAM CONCEPTS"... Please don't take any trades based on this chart/post... Because this chart is for educational purpose only not for Buy or Sell Recommendation... Thank Q
CAT TRADE IDEA – HEAVY EQUIPMENT, HEAVY POTENTIAL 📈🏗️🐾Sector: Industrials – Construction & Machinery
When the giants sleep, we prepare. And when they wake, we ride the momentum.
Caterpillar has been consolidating, and the recent pullback opens the door for a high-conviction setup. I'm looking to build my position in 3 strategic zones — scaling in with patience, letting the market give me the setup on my terms.
🟢 Entry Plan (Scaling In):
⚙️270 – First nibble as it approaches key structural support
⚙️250 – Historical support level and psychological round number
⚙️215 – Panic zone entry — if it hits here, it's a gift 🧨
🎯 Profit Targets:
320 – Swing back to resistance; first trim zone
370 – Momentum continuation with strong industrial tailwinds
400 – Full send 🚀 Long-term target if infrastructure demand and global growth trends align
🛡️ Risk Strategy:
Staggered entries allow for cost basis control
Adjust position sizing based on entry zone reached
💡 Why CAT?
Caterpillar’s fundamentals remain strong with global infrastructure spending on the rise, and the stock is approaching historical discount levels. This setup is about anticipating the bounce, not chasing it. Plan the trade, trade the plan.
📢 DISCLAIMER:
This is not financial advice. I'm sharing my personal trade plan for educational purposes only. Always do your own research and consult a licensed financial advisor before making any investment decisions. Trading involves real risk — respect it.

ETH — Right-Angled Broadening BreakoutEthereum (ETH) has completed a Right-Angled Descending Broadening Pattern that developed over a period of 515 days. Such long-term structures are rare and often mark significant turning points in the market.
🔎 Pattern Breakdown
A–E → swings inside the broadening formation.
F → breakout above the flat resistance.
G (anticipated) → Retest of the breakout zone near $4000, where former resistance may establish itself as support.
The flat top resistance between $4000–$4100 has already given way. A successful retest and hold above this zone would confirm breakout validity and strengthen the probability of continuation toward ATH and beyond.
Trade Setup View
Retest entry zone (G): ~$4000
Invalidation (Stop-Loss): To be determined based on price action during the retest
TP1: Retest of ATH $4867
TP2: $5390
Final target (measured move): $6800
Risk-to-Reward: 1:7+ potential
Why $6800?
The measured move of a broadening formation is its full height projected upward from the breakout point:
Broadening low: $1383.26
Broadening high: $4109
➡️ Height = $2725.74
Add that to the breakout zone (~$4100) → $6825. Rounded, that gives a final target of $6800.
💡 Educational Takeaway
Right-Angled Descending Broadening Formations show growing volatility with buyers holding a ceiling steady while sellers run out of steam. Once that flat resistance breaks, momentum usually shifts in favour of the bulls. Since this one lasted over 500 days, the breakout isn’t just noise. It’s a macro signal that could define ETH’s next major trend leg.
Level to Watch Closely:
$4000 → the expected retest (G). Holding here would be a strong confirmation that ETH is ready to aim for ATH and price discovery.
_________________________________
💬 If you found this helpful, drop a like and comment!

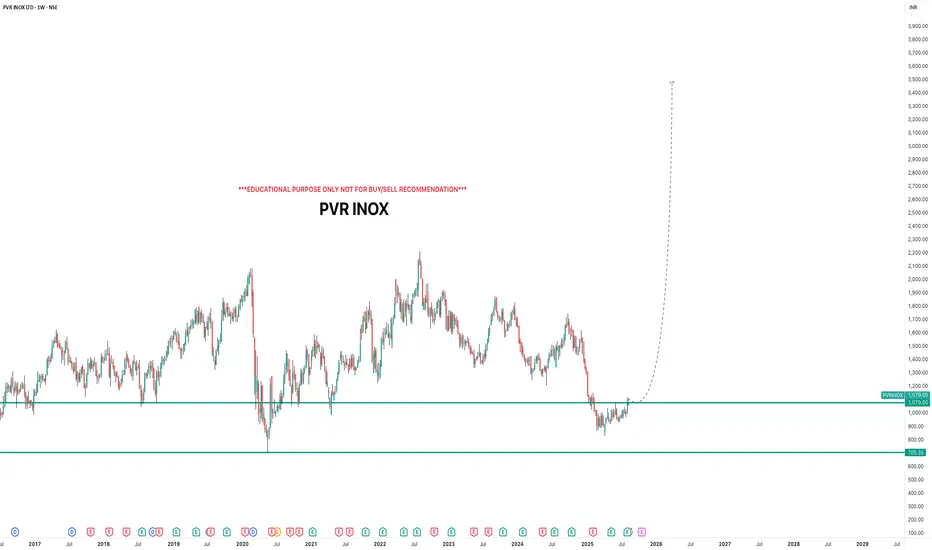
PVR INOXi Observed these Levels based on Price Action and Demand & Supply which is my own Concept "PENDAM CONCEPTS"... Please don't take any trades based on this chart/post... Because this chart is for educational purpose only not for Buy or Sell Recommendation... Thank Q
XAUUSD – Double Tap or Deeper Correction?Idea Breakdown:
Gold just gave us a textbook double-tap at the key 1,910–1,912 demand zone. This level aligns with the 61.8% retracement from the most recent bullish impulse. The long wicks on the daily suggest strong rejection by buyers.
As long as price holds above 1,910, this looks like a potential launch pad for another leg up. Next resistance sits around 1,943, and above that, we’re eyeing 1,966 and 1,984.
Plan:
• Look for bullish price action on the lower timeframes (1H–4H) confirming the double tap
• Conservative entry: on a retest of 1,912
• Aggressive entry: break and hold above 1,943
• Invalidation: Clean daily close below 1,898
Structure:
• Daily double tap at the 1,910–1,912 level
• Strong bullish wick rejection
• Reaction from 61.8% Fibonacci retracement
• In line with overall bullish market structure
Key Zones:
• Support: 1,910–1,912 (wick rejections + Fib confluence)
• Resistance: 1,943
• Breakout target: 1,966 and 1,984
• Invalid if we break below: 1,898

USDCAD: More Growth is Coming Next Week 🇺🇸🇨🇦
There is a high chance that USDCAD will continue rising next week.
The market closed in a very bullish sentiment, nicely respecting
a recently broken horizontal resistance and closing above that.
The next strong resistance is 1.3852
It will be the next goal for the buyers.
❤️Please, support my work with like, thank you!❤️
I am part of Trade Nation's Influencer program and receive a monthly fee for using their TradingView charts in my analysis.

HBAR’s ABC Setup — Short-Term Pain, Long-Term Gain?HBAR has been consolidating sideways for the past 30 days, with $0.27 acting as a clear resistance — aligning with the golden pocket (GP). Price failed to sustain above the yearly open (yOpen) at $0.26901, despite multiple attempts. Each breakout attempt lacked follow-through → weakness.
Structurally, HBAR appears to be in a corrective phase after completing five Elliott waves, and is now potentially forming an ABC corrective pattern. Price has also lost the monthly open (mOpen) at $0.25099, which should now act as resistance.
🔴 Short Opportunity
Previous ideal entry: $0.27463 (Golden Pocket) — offered an R:R of ~1:7
Next short zone: Between mOpen ($0.25099) and yOpen ($0.26901)
Target: Around $0.21/$0.2 as take-profit (TP)
🟢 Long Opportunity Zone
➡️ Primary zone: $0.21 – $0.19675
🧩 Confluence factors:
FVG (Fair Value Gap) / imbalance fill
SSL (Support/Stop-Loss liquidity) positioned in the zone
Weekly level: $0.20685
0.55 Fib retracement: $0.20657 (aligned with the weekly level)
0.75 Fib speed resistance fan: Supports this zone if price reaches it between 19 – 25 Aug
1.0 trend-based Fib extension: $0.19675 (projected Wave C target of ABC)
Pitchfork lower support line intersecting with the zone
nPOC & key level: $0.2
With all these aligning, this is the most favourable long setup.
Long Trade Setup Example
Entry: $0.21– $0.19675
Stop Loss: Below $0.19
TP1: ~$0.223
Final target: $0.3+ (swing trade potential)
R:R: 1:6+
🔍 Indicators used:
DriftLine — Pivot Open Zones → For identifying key yearly/monthly/weekly/daily opens that act as major S/R reference points
➡️ Available for free. You can find them on my profile under “Scripts” and apply them directly to your charts for extra confluence when planning your trades.
_________________________________
💬 If you found this helpful, drop a like and comment!

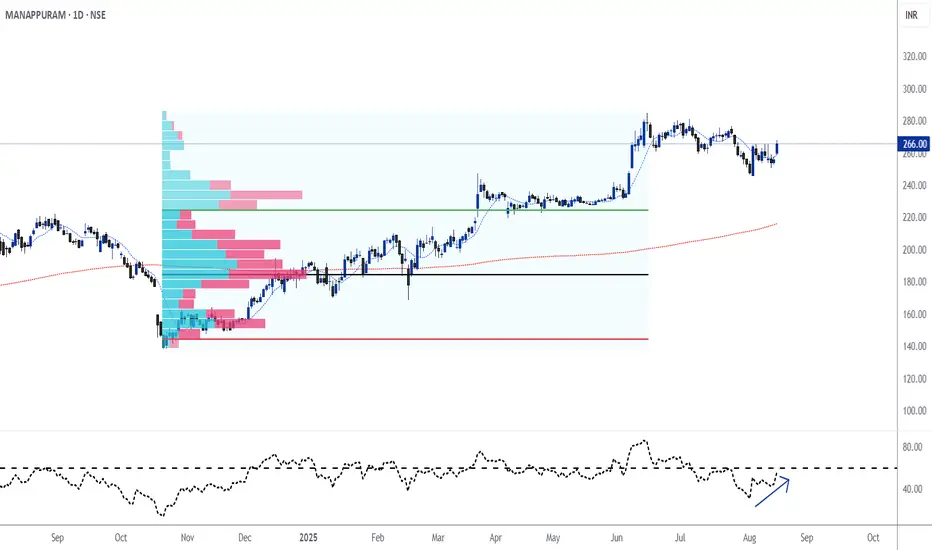
Stock Options Buying Strategy Post-Expiry Stock Selection Strategy:
1. Source: NSE Derivatives
• Navigate to: NSE → Derivatives → Most Active Securities
• Download the Excel file listing active securities.
2. Filtering Criteria:
• Only consider Stock Futures (exclude indices and options).
• Sort by % Change (Descending) to catch the biggest movers.
• Focus on stocks with >1% change in futures — indicating fresh institutional interest.
• Execute this 2 days after F&O expiry for cleaner post-rollover trends.
3. Technical Filters for Longs (Options Buying Focus):
• Monthly RSI > 60 – confirms long-term bullish momentum.
• Daily RSI crossing 60 – entry trigger.
• Price above 9 EMA and 200 SMA – trend confirmation.
• Price above POC and VAH (from Volume Profile on daily chart between last swing low → high) – shows strength above value.
________________________________________
📊 Volume Profile Insight:
• POC (Point of Control): Highest volume area → fair value.
• VAH (Value Area High): Upper limit of 70% volume zone.
• Price above both suggests price acceptance at higher levels, potentially indicating institutional accumulation.
________________________________________
🔍 Watchlist from NSE Derivatives (Example Set):
Stock Remarks
MUTHOOTFIN NBFC theme, rising futures activity
MANAPPURAM Similar to above, often follows Muthoot
KALYANKJIL Jewellery sector, festive momentum?
ETERNAL Lesser known, check chart and liquidity
INFY Surprising entry, despite weak sectoral sentiment
________________________________________
🧠 Noteworthy Insight: INFY
• if Infosys (INFY) is showing up in the high futures activity list despite weak IT sector performance, it could indicate:
o Contrarian institutional positioning
o Pre-emptive long build-up ahead of some event
o Or possibly short covering (check OI change with price)
GBPJPY: Bullish Trend Will Continue 🇬🇧🇯🇵
2 important events these week indicate that GBPJPY will most likely
remain bullish.
First, the price violated a falling trend line and closed above that,
then, we saw a confirmed break of structure BoS and a formation
of a new higher high.
Bullish sentiment will most likely continue to prevail.
Next resistance - 200.6
❤️Please, support my work with like, thank you!❤️
I am part of Trade Nation's Influencer program and receive a monthly fee for using their TradingView charts in my analysis.

Short CADJPY and USDJPY, Swing Trade Trading Idea: Short CADJPY & USDJPY
Date: August 14, 2025
Strategy Type: Short-term bearish play on JPY crosses
📰 Key News Drivers
- Japan GDP Data (Q2 Preliminary):
- QoQ: 0.0% (flat growth)
- YoY: -0.2% (mild contraction)
- GDP Deflator YoY: 3.3% (strong inflation signal)
- USDJPY Technical Outlook:
- Current price: ~146.60
- Bearish momentum confirmed by moving averages
- Key support: 146.386
- Break below 146.500 could trigger further downside
- JPY Strength Factors:
- Modest improvement in Japan’s M2 Money Stock
- Lower-than-expected U.S. inflation data weakening USD
- Risk-off sentiment favoring safe-haven JPY
📊 Trade Rationale
| Pair | Bearish Catalyst | Technical Setup | Target Zone |
| USDJPY | Weak U.S. inflation + strong JPY deflator | Testing support at 146.386 | 146.00 or lower |
| CADJPY | CAD vulnerable to oil price volatility + JPY strength | Likely to follow USDJPY breakdown | 106.50–107.00 |
- JPY Strength Thesis: Despite flat GDP growth, the strong deflator suggests inflationary pressure, which may prompt the BoJ to maintain or tighten policy. This supports JPY appreciation.
- USD Weakness: Lower inflation expectations in the U.S. reduce the likelihood of further Fed hikes, weakening USD.
- CAD Vulnerability: CADJPY often correlates with risk sentiment and oil prices. With JPY gaining and global risk tone cautious, CADJPY is exposed.
📌 Execution Plan
- USDJPY:
- Entry: Short below 146.50
- Stop: 147.10
- Target: 146.00 / 145.50
- CADJPY:
- Entry: Short below 107.50
- Stop: 108.20
- Target: 106.50 / 106.00

From FOMO to Game Over: The Witch’s Market ProphecyPolitics and market forces are cooking the soup too hot, and greed is on the menu. Investors, funds, and retail traders are ignoring the signs — and just like in the Wild West, only the weapons have changed: stocks, futures, and options. Today, we’ll peek over the witch’s shoulder to see what she sees in the chart’s shadows.
The Setup
This chart shows the market reaching the U-MLH (Upper Median Line Parallel) for the third time. Even this week, the greedy market is nibbling at that level, trying to chew its way higher. The question: does it break through — or break down?
Scenarios
(0) → Price touches the U-MLH for the third time.
Historically, repeated touches can lead to either an explosive breakout or a sharp reversal.
(2) → A momentum kick, driven by FOMO, could push price up to the Warning 1/4 line.
This would be the bulls’ dream run.
(3) → The market reaches the next pitchfork line/deviation — because that’s what markets do.
After that? Only the market gods know.
(4) → Price fails to reach WL1 (Warning Line 1), triggering a Hagopian.
This typically signals a failed breakout and a likely pullback.
Key question: Will U-MLH hold as support?
If not, expect a quick test/retest from below… then it’s Game Over.
(5) → In 80% of cases, the centerline gets tagged as Profit Target 1.
That could be the “logical” next stop.
(6) → L-MLH (Lower Median Line Parallel) — the panic zone.
This is when fear takes over, selling accelerates, and the market feels like the fan just got hit.
Final Word
Whatever happens next, the witch doesn’t care — she’ll be riding her broom into the moonrise, leaving the rest of us to trade the chaos.
#SPX500 #NASDAQ100 #TechnicalAnalysis #Pitchfork #Futures #Options #MarketOutlook #SwingTrading #FOMO

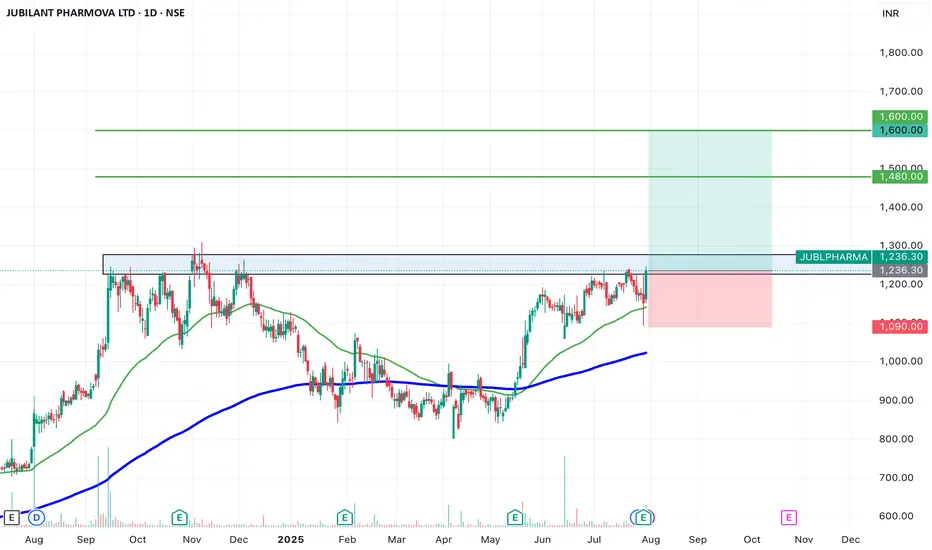
SWING IDEA - JUBILANT PHARMOVAJubilant Pharmova , a diversified pharmaceutical company focused on CRAMS and specialty pharma, is presenting a strong swing opportunity backed by a major pattern breakout and volume confirmation.
Reasons are listed below :
Breakout from an Inverted Head & Shoulders pattern after over a year of consolidation
Attempting breakout above 1250, a key resistance zone with multiple rejections in the past
Strong marubozu candle on the daily chart with a notable volume spike, signaling conviction
Trading near all-time highs, and comfortably above key EMAs, reinforcing trend strength
Target : 1480 // 1600
Stoploss : weekly close below 1090
DISCLAIMER -
Decisions to buy, sell, hold or trade in securities, commodities and other investments involve risk and are best made based on the advice of qualified financial professionals. Any trading in securities or other investments involves a risk of substantial losses. The practice of "Day Trading" involves particularly high risks and can cause you to lose substantial sums of money. Before undertaking any trading program, you should consult a qualified financial professional. Please consider carefully whether such trading is suitable for you in light of your financial condition and ability to bear financial risks. Under no circumstances shall we be liable for any loss or damage you or anyone else incurs as a result of any trading or investment activity that you or anyone else engages in based on any information or material you receive through TradingView or our services.
@visionary.growth.insights
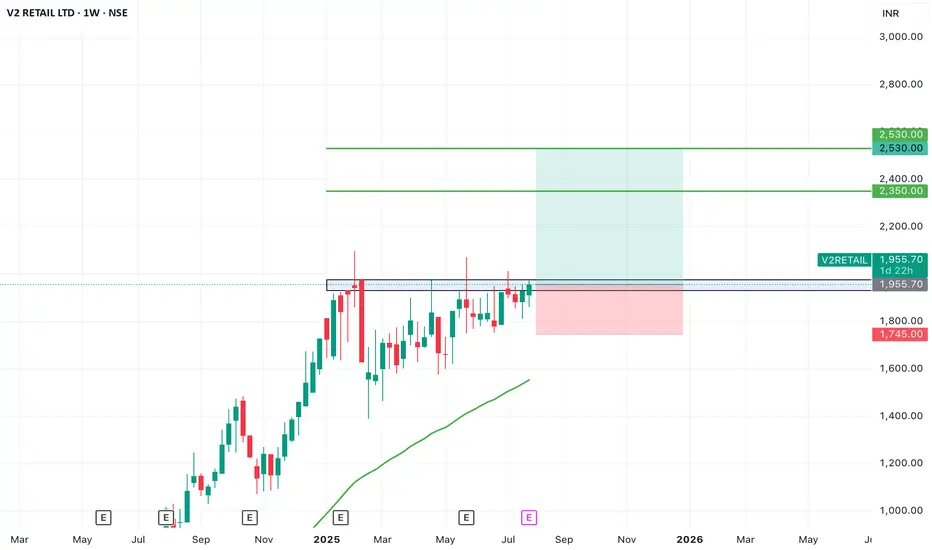
SWING IDEA - V2 RETAILV2 Retail , a small-cap value fashion retailer with a pan-India presence, is showing strong bullish momentum and a textbook swing trade setup backed by multiple breakout signals.
Reasons are listed below :
Breakout from a VCP (Volatility Contraction Pattern) – indicating accumulation and strength
Ascending triangle breakout – classic continuation pattern
Cleared major resistance zone, confirming bullish intent
Maintains a clear uptrend with higher highs and higher lows
Target - 2350 // 2530
Stoploss - weekly close below 1745
DISCLAIMER -
Decisions to buy, sell, hold or trade in securities, commodities and other investments involve risk and are best made based on the advice of qualified financial professionals. Any trading in securities or other investments involves a risk of substantial losses. The practice of "Day Trading" involves particularly high risks and can cause you to lose substantial sums of money. Before undertaking any trading program, you should consult a qualified financial professional. Please consider carefully whether such trading is suitable for you in light of your financial condition and ability to bear financial risks. Under no circumstances shall we be liable for any loss or damage you or anyone else incurs as a result of any trading or investment activity that you or anyone else engages in based on any information or material you receive through TradingView or our services.
@visionary.growth.insights
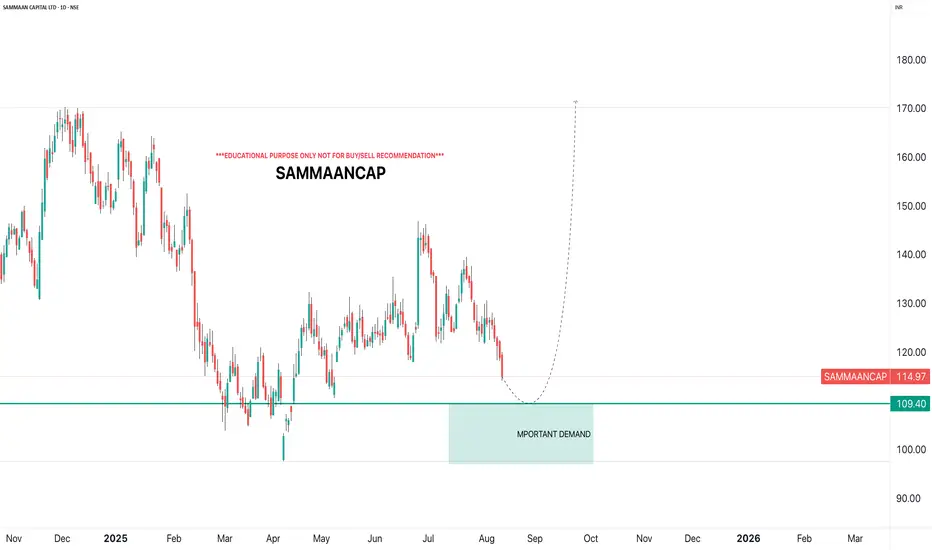
SAMMAANCAPi Observed these Levels based on Price Action and Demand & Supply which is my own Concept "PENDAM CONCEPTS"... Please don't take any trades based on this chart/post... Because this chart is for educational purpose only not for Buy or Sell Recommendation... Thank Q
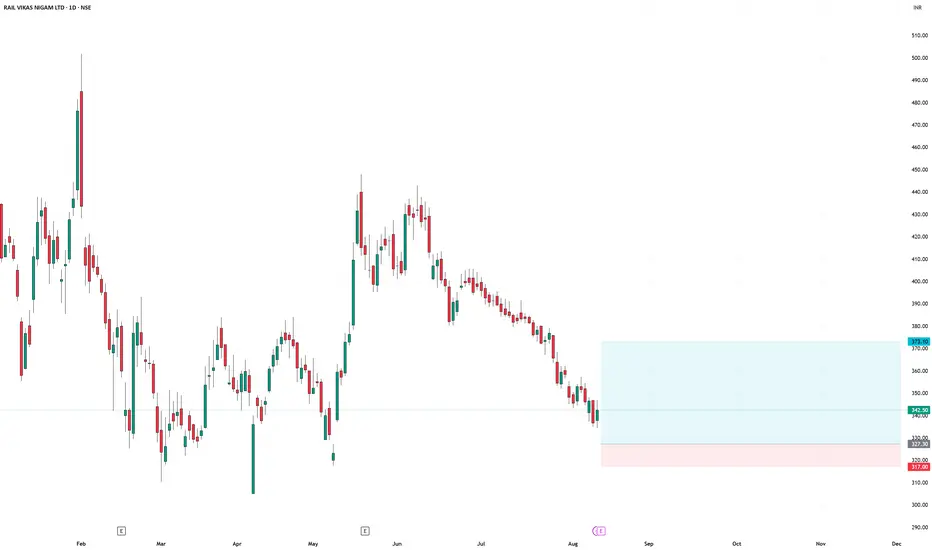
RAIL VIKAS NIGAM LTD swing log setupRAIL VIKAS NIGAM LTD swing log setup
Entry - 327.3
Stop Loss - 317
Target - 373.1
Risk Reward - 1:4.45
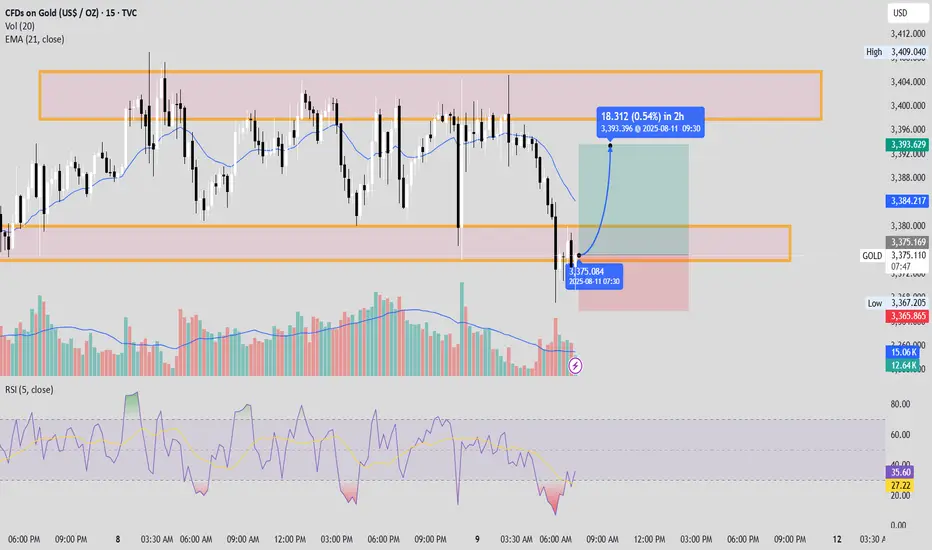
Gold Analysis: Time to Take Long for short durationThe Liquidity sweep has been done by institutions, and the market will bounce back hopefully.
The top of the bull market may be nearWe have strong resistance above us that Bitcoin must overcome. There is also strong support below, which determines the boundaries of the range. I see it this way: if the market remains positive for a while longer and no unexpected fundamentals come, we could overcome that resistance over time. Then I see the next ATH and strong resistance at the level between 131,000 and 132,000 USD. I have drawn exactly where I think it works out on the chart. However, it is possible that this will also be the top of this year's bull market.
I have also drawn a possible swing trade that could work with this setup.

GBP/USD Short
Looks like its safe to say the trend has now changed on the daily timeframe. Only looking for shorts. Lower timeframe entries (4hr, 1hr) in conjunction with daily key levels. Targeting the nearest daily levels for TPs. You know what to do. Good luck my friends.
Follow me for more!
Professional Trader - Michael M.

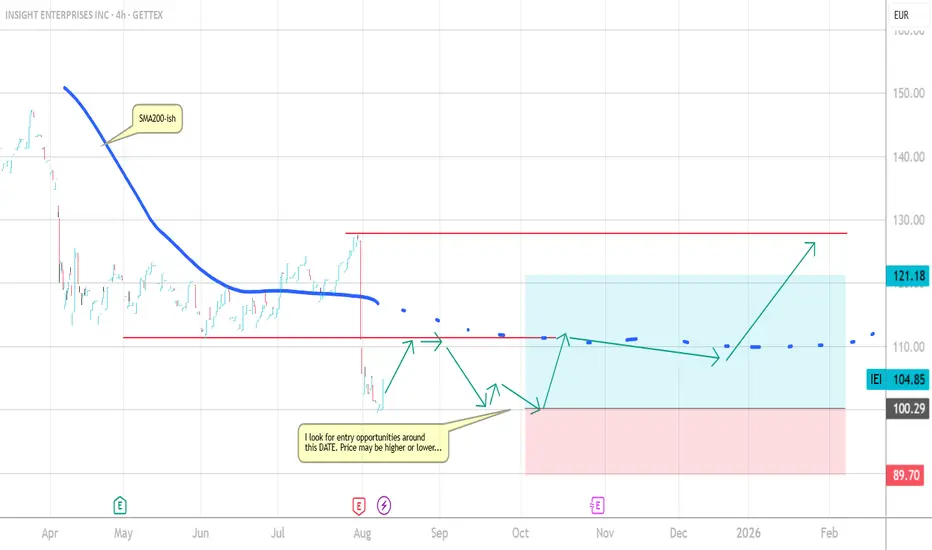
NSIT Insight Enterprises Forecast until early 2026Pretty bad year for NSIT but I see a chance for a rebound coming from early October 2025 with a participation in the x-mas / end of year ralley.
my forecast is shown as arrows in the chart. please feel free to contact me for some
seasonality chat and to get further ideas on that or maybe discuss.
leave a comment. what do you think?
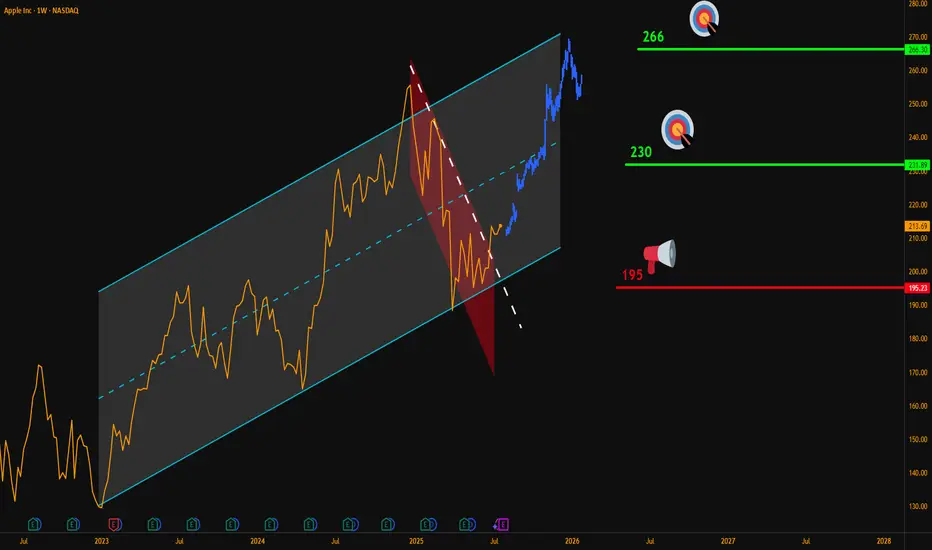
AAPL Weekly Breakout – Targeting $266Hello Traders,
Here’s my latest analysis on Apple (AAPL) based on the weekly chart.
🔍 Chart Breakdown:
Main Uptrend Channel (Blue): Price has respected this channel since 2023.
Red Downtrend Sub-Channel: Recent corrective phase is now broken.
Breakout Signal: Last week, AAPL closed above the sub-channel’s upper line, confirming bullish momentum.
📌 Updated Trade Setup Section:
Entry Zone: Around $215 (current price)
Stop-Loss: Weekly close below $195 (Risk = $20)
Targets:
✅ $230 (Reward = $15 → R:R = 0.75:1)
✅ $266 (Reward = $51 → R:R = 2.55:1)
Always confirm with your own strategy before entering a trade. Position sizing and risk control are key.
💬 Do you think AAPL can reach $266 before Q4 2025? Share your thoughts below!
NASDAQ:AAPL
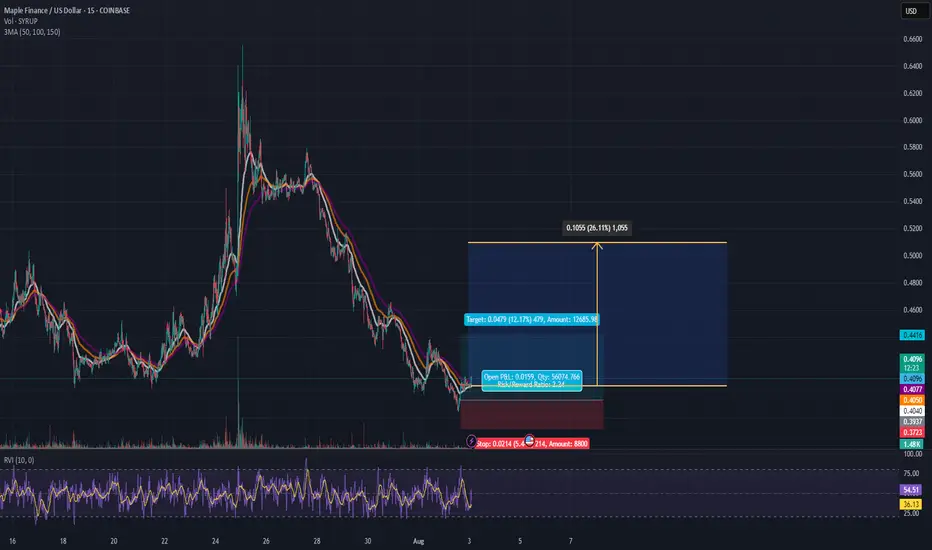
SYRUP Priming for a 12% Pop - Longterm ~20% PotentialHey Guys, My last posts were hidden (Again) ty TV, so I'm back at it and keeping it clean and to the point:
Maple Finance
SYRUPUSD
is forming a base at the $0.40 zone after a steep downtrend. Looks like the bleeding's slowing down and we're seeing signs of accumulation.
🍯 Entry: $0.402 - $0.4045
🛑 Stop: $0.3825 (5.4% risk)
🎯 Target 1: $0.4479 (+12.1%)
🚀 Target 2: $0.5100 (+20.6%)
📐 R/R Ratio: ~2.2
This is a structure-based long setup:
Flattening EMAs
Volume compression
Lower wick absorption (buyer presence showing up quietly)
💡 Target 2 ($0.5100) is not a short-term scalp – that's the stretch target IF this turns into full accumulation. Full exit at T1 is a solid take.
More setups on the way.
BNBUSDT — Golden cross with a target at 804- 850BNB has broken the descending trendline and formed a clear reversal structure.
A golden cross (EMA 50 crossing EMA 200 from below) confirms bullish intentions. The price is now holding above 783 -a key level that aligns with the 0.618 Fibonacci retracement. A retest of the 778–768 area is expected, followed by a potential rally to 808–810.
If momentum continues, the 860 zone (Fib 3.618) becomes the next target. The uptrend remains intact. RSI supports the move, MACD is in positive territory, and volume remains stable.
On the fundamental side, BNB remains a central token in the Binance ecosystem. With no regulatory pressure in the short term and ongoing development of the platform, institutional and retail interest remains strong. General optimism across the altcoin space also provides momentum.
Holding the 768–778 area is key for further growth. A drop below could test 760 support, but the bullish structure remains valid.
