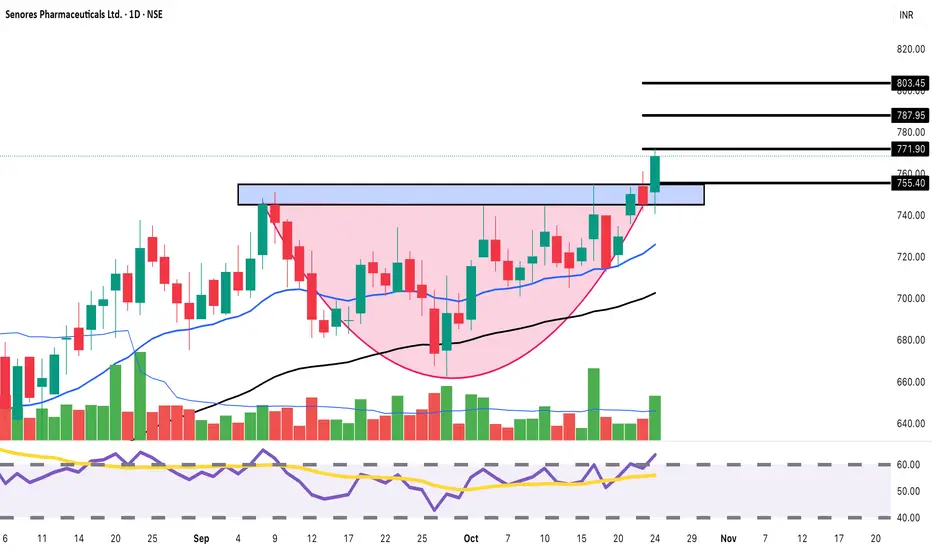
Senores Pharma: Cup & Handle Breakout! Target 803+BUY Setup 💊
Entry: ₹768-775 (Current Level)
Target 1: ₹787-795
Target 2: ₹803-810
Target 3: ₹830+ (Extended)
Stop Loss: ₹752
Technical Rationale:
Powerful breakout from rectangular consolidation (740-770)
Strong bullish momentum with +3.10% surge today
Breaking above resistance zone with conviction
Cup and Handle pattern visible - classic bullish continuation
Price breaking above descending trendline (pink shaded area)
Rising above both EMAs indicating trend reversal
High volume (378.97K) confirming breakout strength
RSI spiking above 60, showing momentum building
Clear support established at 755-760 level
Multiple resistance levels marked: 771, 787, 803
Ascending triangle formation breakout
Risk-Reward: Excellent 1:3+ ratio
Pattern: Cup & Handle + Ascending Triangle breakout - highly reliable bullish signals combined
Strategy: Short to medium-term swing - Book 30% at T1 (790), 35% at T2 (805), trail remaining with SL at 770 after T1
Key Levels:
Breakout Zone: 771 (now support)
Strong Resistance: 787, 803
Support: 755, 752, 740
Sector: Pharma sector showing strength amid market volatility
For educational purposes only. Not SEBI registered. Multiple bullish patterns converging - strong setup but manage risk. Conduct your own research before investing.Retry
Swingtrading
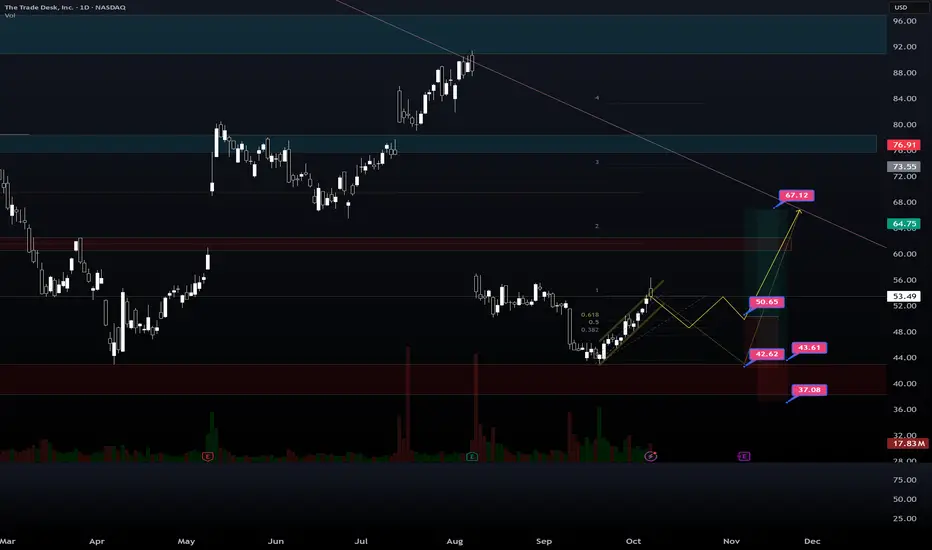
TTD (swingtrade) Earning plays, waiting for pullbacki have 2 option to entry TTD.
this set up to get entry when ttd earning.
Bullish Setups Emerging: Usha Martin and Alicon in Focus🔹 Usha Martin NSE:USHAMART
After months of sideways movement, the stock has formed a rounding bottom pattern.
It recently broke out and retested its support zone. If momentum continues, the stock could move higher from here. 📈
🔹 Alicon Castalloy NSE:ALICON
The stock bounced back strongly from ₹600 after a big correction from ₹1,530.
It now trades near the key resistance zone of ₹1,000–₹1,050.
Yesterday’s 13% jump with high volume shows strong buying interest. A breakout above this zone could take it closer to previous highs. 🔥
👉 Keep an eye on both — they’re showing promising setups for the next move!

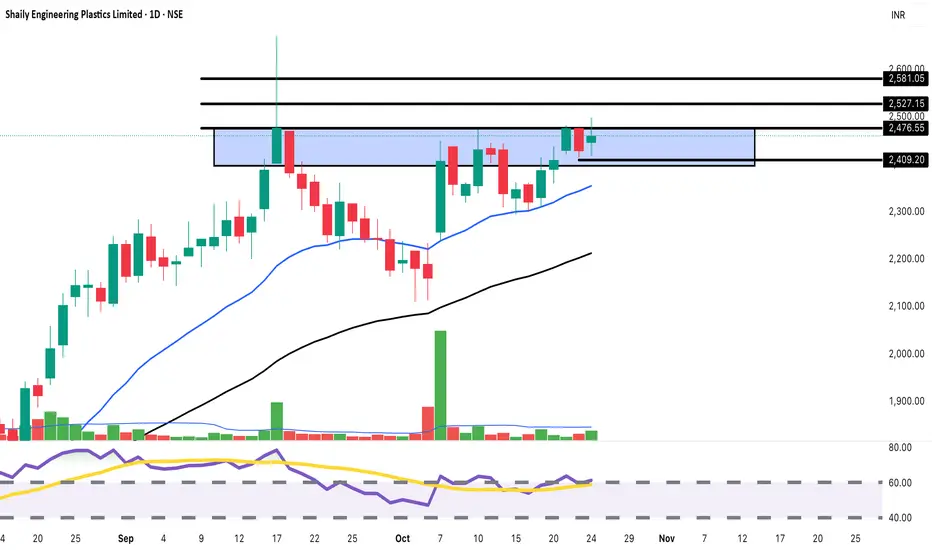
SHAILY: Rectangle Consolidation Breakout | Target 2,650BUY Setup 🔩
Entry: ₹2,460-2,475 (Current Level)
Target 1: ₹2,527-2,540
Target 2: ₹2,581-2,600
Target 3: ₹2,650+ (Extended)
Stop Loss: ₹2,409
Technical Rationale:
Strong consolidation within rectangular range (2,409-2,527) for extended period
Breaking above mid-range with +1.31% gain today
Trading above both EMAs showing bullish trend strength
High volume (188.88K) indicating institutional interest
RSI around 65, healthy momentum with upside potential
Price respecting rising trendline support (black line)
Clear support established at 2,409 level
Multiple resistance levels mapped: 2,476, 2,527, 2,581
Engineering plastics sector showing resilience
Flat base consolidation - sign of strength before breakout
Risk-Reward: Strong 1:3.5+ ratio
Pattern: Flat base consolidation breakout - bullish continuation pattern indicating strength
Strategy: Medium-term swing - Book 30% at T1 (2,530), 30% at T2 (2,590), trail remaining with SL at 2,480 after T1
For educational purposes only. Not SEBI registered. Strong consolidation base suggests accumulation - manage position size appropriately. Conduct thorough research before investing.
BUY AMD!!!!Approaching a significant level where we can expect AMD to complete this bearish cycle and begin a bullish cycle. Partial Profits at All-Time-Highs.

Disney's Possible Swing SetupHi Traders!
As I analyze Disney, I am seeing it's in a counter trend on the 24HR with a resistance at $120. I'm staying patient watching to see how far price will retrace with a 24HR CHOCH sitting at around $102.50. That seems far away, but that would help fill in some of the gap, and give a nice set up for a reversal. In addition, there are 4 days left in the current Monthly candle, and they've been closing small. IMO that could indicate that price could eventually make it to $130.
For now, I have alerts set and I'm planning to take a long swing.
Let me know what you guys think in the comments! Good luck!
*DISCLAIMER: I am not a financial advisor. The ideas and trades I take on my page are for educational and entertainment purposes only. I'm just showing you guys how I trade. Remember, trading of any kind involves risk. Your investments are solely your responsibility and not mine.*

Breakout in CAMSBreakout in CAMS
Entry - 3967
Target - 4370
SL - 3870
DISCLAIMER: I am not SEBI registered and the ideas posted are only for educational purpose. Do a proper analysis and always trade with STOP LOSS.

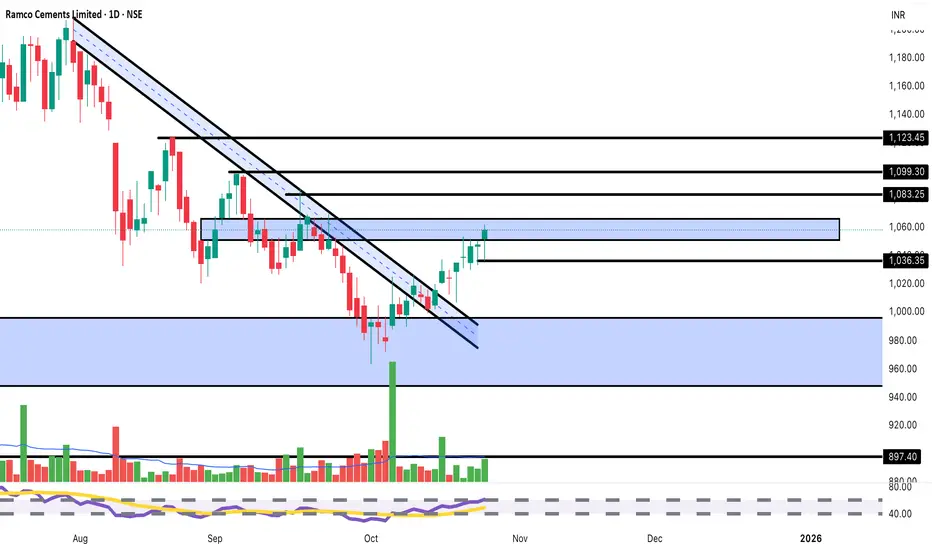
Ramco Cements Breaking Key Resistance | Target 1,100+BUY Setup 🏗️
Entry: ₹1,058-1,065 (Current Level)
Target 1: ₹1,083-1,090
Target 2: ₹1,099-1,110
Target 3: ₹1,123-1,135 (Extended)
Stop Loss: ₹1,036
Technical Rationale:
Breaking above descending channel (blue shaded area) - major bullish reversal
Strong momentum with +1.11% gain today
Price reclaiming 1,060 resistance zone
Breaking above both declining trendlines convincingly
High volume (343.03K) supporting the breakout
Consolidation zone (1,000-1,060) now acting as support
RSI trending upward, showing momentum building
Cement sector showing strength on infrastructure demand
Multiple resistance levels mapped: 1,036, 1,083, 1,099, 1,123
Clear support at 1,000 psychological level
V-shaped recovery from October lows
Risk-Reward: Strong 1:3+ ratio
Pattern: Falling wedge/descending channel breakout - highly reliable bullish reversal pattern
Strategy: Medium-term swing trade - Book 30% at T1 (1,085), 30% at T2 (1,105), trail remaining with SL at 1,065 after T1
Key Levels:
Breakout Zone: 1,060 (critical level crossed)
Strong Resistance: 1,083, 1,099, 1,123
Major Support: 1,036, 1,000, 980
Sector Catalyst:
Infrastructure spending boost expected
Cement demand picking up seasonally
For educational purposes only. Not SEBI registered. Major pattern breakout - manage position sizing appropriately. Cement stocks can be volatile. Conduct thorough research before investing.
Oliver Kell's price cycle. longterm 50dmaOliver Kell is a legend swing trader and I thought his price cycle concept makes a lot of sense. I would intuitively use 50dma cycle for price swings. His concept give depth to an idea.
Longterm for less variance outcomes.
#GoldenCross #DeathCross.

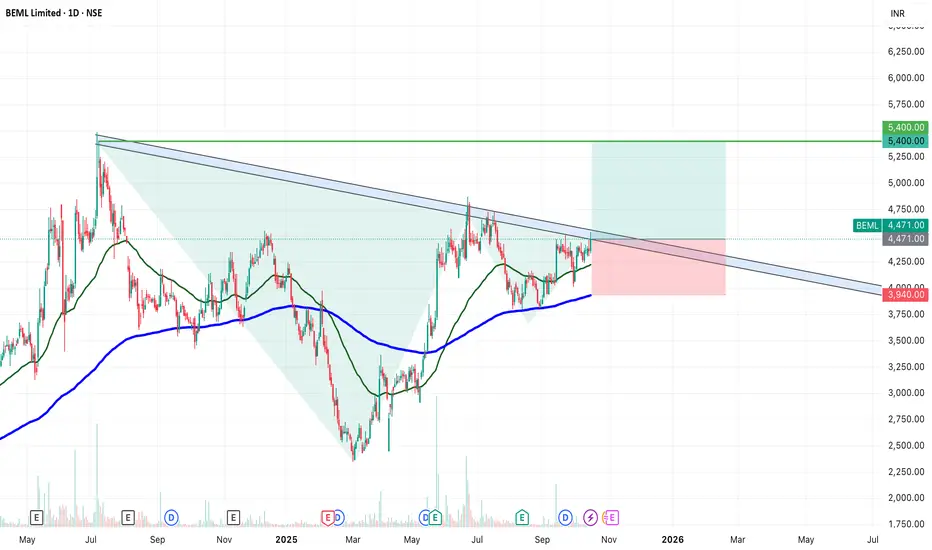
SWING IDEA - BEMLBEML Ltd , a key player in India’s defence and heavy equipment sector, is displaying a strong bullish breakout setup supported by multiple technical confirmations.
Reasons are listed below :
Breakout of a long-term trendline after multiple retests
Cup and Handle breakout, signaling continuation strength
VCP (Volatility Contraction Pattern) breakout indicating accumulation
Bullish engulfing candle on the daily timeframe confirming momentum
Higher highs and higher lows structure intact
Trading above 50 & 200 EMA, reinforcing trend strength
Target - 5400
Stoploss - daily close below 3940
DISCLAIMER -
Decisions to buy, sell, hold or trade in securities, commodities and other investments involve risk and are best made based on the advice of qualified financial professionals. Any trading in securities or other investments involves a risk of substantial losses. The practice of "Day Trading" involves particularly high risks and can cause you to lose substantial sums of money. Before undertaking any trading program, you should consult a qualified financial professional. Please consider carefully whether such trading is suitable for you in light of your financial condition and ability to bear financial risks. Under no circumstances shall we be liable for any loss or damage you or anyone else incurs as a result of any trading or investment activity that you or anyone else engages in based on any information or material you receive through TradingView or our services.
@visionary.growth.insights
Salik Stock Reversal Alert-A Hidden Gem in Dubai’s Stock Market!Hello Traders!
Today’s analysis is on Salik Company PJSC (DFM), one of Dubai’s most watched stocks. UAE markets are full of hidden opportunities, and this chart highlights one of them. After forming a strong Rectangle Pattern for months, the stock finally gave a clean Breakout , followed by a Bullish Engulfing retest candle , a classic sign of buyers returning with strength.
Why this setup is special?
Rectangle pattern breakout after long consolidation shows trend resumption potential.
Bullish engulfing pattern adds confirmation of renewed momentum.
Multiple timeframe structure supports higher targets with low downside risk.
Levels to Track:
The best entry zone remains around 5.80–5.90 AED , where strong support and bullish engulfing confirmation align. The first short-term target is placed at 6.25 AED , followed by a medium-term target near 6.60 AED , and a positional level of 6.99 AED . Long-term investors can aim for the major holding target around 8.00 AED . A stop loss below 5.37 AED should be maintained to protect positions.
If you want to catch these kinds of early setups before they explode, make sure you follow closely, (Analysis By @TraderRahulPal ). More analysis & educational content is shared regularly on my profile. Sometimes one strong setup can shift your entire month’s momentum. If this helped you, don’t forget to like and follow for regular updates.
Disclaimer:
This analysis is for educational purposes only and should not be taken as financial advice. Please do your own research or consult your financial advisor before investing.

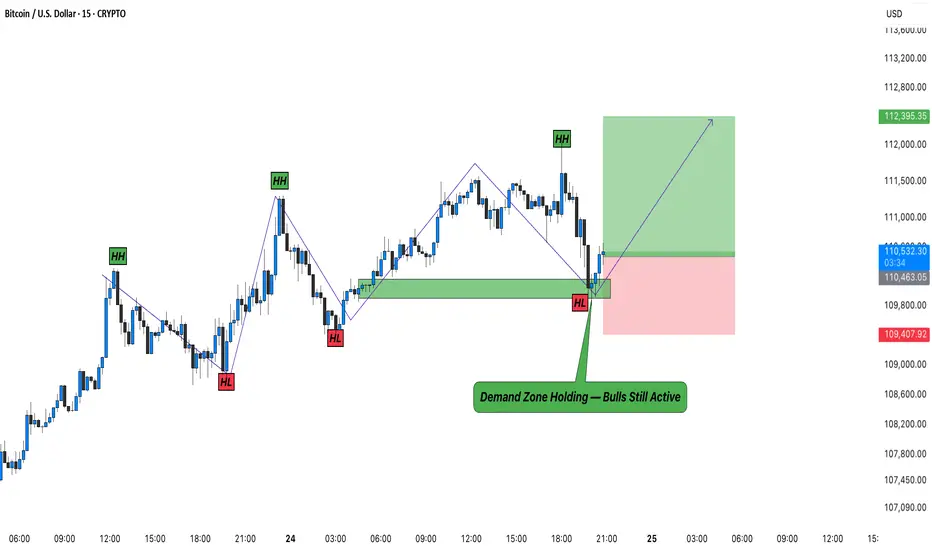
BTC – Demand Zone Holding Firm, Bulls Still in Control!Bitcoin (BTCUSD) continues to respect its demand zone around 110K–109.4K , where buyers have stepped in once again to defend the short-term structure. This area has acted as a reliable reaction point multiple times, confirming that smart money is active around this region.
Price recently dipped into the green zone and showed a quick rebound, forming a possible higher low structure. As long as BTC stays above this zone, the short-term bias remains bullish with immediate targets near 112.3K .
If the momentum continues to build, we might see another impulsive leg to the upside. However, any sustained close below 109.4K would invalidate this setup.
Remember: structure defines direction, not emotions.
Rahul’s Tip:
The best trades often form when most traders panic. Let the market test patience, not your conviction.
Disclaimer: This analysis is for educational purposes only and is not financial advice. Always trade with risk management.
Weekly Market Outlook | Nifty, BankNifty & S&P 500 AnalysisNifty closed the week at 25,795, up 86 points from last week’s close — marking another week of resilience within my projected range of 26,200–25,250.
This week’s candle looks weak and indecisive, forming near the all-time high zone — a potential signal of short-term fatigue. A break below 25,718 could trigger selling pressure toward support zones at 25,450 / 25,350 / 25,300.
However, as long as 25,300 holds, the broader structure remains healthy.
On the flip side, if Nifty sustains above 25,900, bulls may once again attempt to test the all-time high resistance at 26,277.
👉 Expected range for next week: 26,250 – 25,350.
BankNifty Update:
BankNifty delivered a record-breaking all-time high close at 57,699!
If it slips below 57,482, it could correct toward 57,000 / 56,750, which may also drag Nifty slightly lower.
But a sustained move above 57,900 could fuel another rally toward 58,577 (ATH), providing crucial support for Nifty’s next breakout attempt.
S&P 500 (US Markets):
The S&P 500 once again posted a new all-time high weekly close at 6,791, perfectly following last week’s outlook where it cleared 6,715 and achieved both upside targets 6,760 / 6,780.
Next key levels to watch:
Above 6,780 → potential move to 6,930 / 6,959 (important Fibonacci zone)
Below 6,750 → watch for pullback toward 6,689 / 6,666 / 6,650
Investors in US equities can now trail their stop-loss near 6,580 and keep adjusting to protect profits as the trend extends.
🎯 Summary:
Nifty range: 26,250–25,350
BankNifty: All-time high close, watch 57,900 breakout
S&P 500: Bullish momentum intact, eyes on 6,930–6,959
Markets are at crucial inflection levels — next week could decide whether we see fresh breakouts or short-term consolidation.

Shipping Corporation of India Limited chart analysisBUY Setup ⚓
Entry: ₹250-252 (Current Level)
Target 1: ₹260-265
Target 2: ₹275-280
Target 3: ₹290+ (Extended)
Stop Loss: ₹242
Technical Rationale:
Explosive breakout with +7.93% surge on massive volume
Exceptional volume spike (38M) - highest in the chart period
Breaking out from consolidation range (225-240)
RSI spiking above 60, indicating strong bullish momentum
Price crossing above key resistance at 245-246 level
Gap-up opening showing strong institutional buying
Shipping sector momentum with global trade trends
Support established at breakout zone (245)
Risk-Reward: Strong 1:4+ ratio
Sector Catalyst: PSU shipping stocks showing strength, potential government policy support
Strategy: Momentum trade - Book 30% at T1 (260), 30% at T2 (275), trail SL to 255 after T1 achieved
Caution: High volatility expected - avoid overexposure. Watch for profit booking after sharp rally

NZDJPY: Important Breakout 🇳🇿🇯🇵
NZDJPY broke and closed above a significant horizontal
resistance cluster on a daily.
There is a high chance that the market will go higher soon.
Expect a bullish continuation to 88.3 level.
❤️Please, support my work with like, thank you!❤️
I am part of Trade Nation's Influencer program and receive a monthly fee for using their TradingView charts in my analysis.

Cummins India: Breaking Key Trendline | Buy Setup for 4,200+ BUY Setup 🔧
Entry: ₹4,073-4,080 (Current Level)
Target 1: ₹4,100-4,120
Target 2: ₹4,150-4,175
Target 3: ₹4,200+ (Extended)
Stop Loss: ₹4,025
Technical Rationale:
Breaking above descending trendline resistance from September highs
Testing critical resistance at 4,101 level - double top breakout zone
Strong bullish momentum with +1.82% gain today
Higher volume (656.35K) supporting the breakout attempt
RSI trending upward around 60, showing momentum building
Price reclaiming 4,070 support turned resistance level
Consolidation phase ending - preparing for next leg up
Capital goods sector showing strength
Clear inverse head & shoulders formation visible
Risk-Reward: Favorable 1:2.5 ratio
Pattern: Descending trendline breakout + Double top resistance test - bullish continuation signal
Strategy: Short-term swing trade - Book 40% at T1 (4,110), 30% at T2 (4,160), trail remaining with SL at 4,080 after T1
Key Levels:
Critical Resistance: 4,100-4,102 (breakout confirmation)
Support: 4,050, 4,025, 4,000
Note: Watch for confirmed breakout above 4,100 with volume for strong momentum continuation

BHARATFORG Breaking Out | Targets 1,400+BUY Setup 🔨
Entry: ₹1,300-1,305 (Current Level)
Target 1: ₹1,330-1,340
Target 2: ₹1,365-1,375
Target 3: ₹1,400+ (Extended)
Stop Loss: ₹1,275
Technical Rationale:
Strong bullish momentum with +4.56% gain today
Breaking above major descending trendline resistance (visible from June highs)
Consolidation breakout from 1,265-1,285 range
Good volume (3.45M) supporting the breakout
RSI around 65, showing strength with room for further upside
Price attempting to cross key resistance at 1,300 psychological level
Falling wedge pattern breakout - typically bullish
Auto sector strength supporting the move
Support established at 1,280 zone
Risk-Reward: Favorable 1:3 ratio
Pattern: Descending wedge breakout - classic bullish reversal pattern
Strategy: Positional trade - Book 40% at T1 (1,335), 30% at T2 (1,370), trail remaining with SL at 1,310 after T1
Key Levels:
Strong Resistance: 1,310, 1,340, 1,365
Support: 1,280, 1,265

SKYGOLDLooks good on Chart.
Breakout Visible.
Above all key EMA.
Good for Short Term.
Target 410,500.
Do Like ,Comment , Follow for regular Updates...
Keep Learning ,Keep Earning...
Disclaimer : This is not a Buy or Sell recommendation. I am not SEBI Registered. Please consult your financial advisor before making any investments . This is for Educational purpose only.

EUR/USD Hints At Swing LowA small doji formed on Wednesday, snapping a three-day losing streak for EUR/USD. The session low respected the 100-day EMA as support, while the brief dip below the monthly S1 pivot proved to be a false break.
The bias remains bullish while prices hold above the 1.1544 swing low. Bulls could look to buy dips towards the monthly S1 pivot in anticipation of a move up towards the 1.17 handle and monthly pivot point (1.1754).
Matt Simpson, Market Analyst at City Index and Forex.com

UPS Swing Long 1H Conservative Trend TradeConservative Trend Trade
+ long impulse
- supporting reaction bar
+ support zone
+ 1/2 correction
+ biggest volume Sp
Calculated affordable virtual stop loss
1 to 2 R/R take profit
Daily Trend
+ long impulse
= neutral zone"
Monthly CounterTrend
"+ short impulse
+ biggest volume T1
+ support zone
+ biggest volume manipulation bar
- one bar reversal?"
Yearly trend
"+ long impulse
+ 1/2 correction
+ T2 level
+ support zone
+ biggest volume manipulation bar"

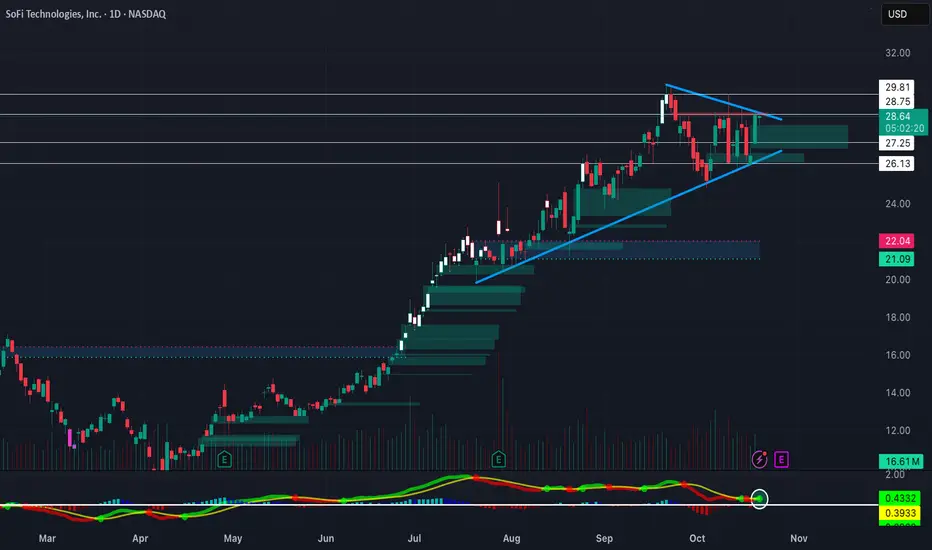
Triangle Break Heading into EarningsNASDAQ:SOFI Forming a big symmetrical triangle on the daily timeframe heading into earnings. EMA's are starting to curl upwards after NASDAQ:SOFI found some support on its 50-day SMA. Bullish long-term on NASDAQ:SOFI , so definitely will be watching this one closely
EURNZD trend breakout and start of correctionEURNZD has broken below the ascending channel and confirmed the breakout under 2.0350. This indicates the start of a corrective phase. Downside targets are 2.0190, 2.0020, and 1.9860. As long as the price stays below the confirmation zone, sellers dominate the market. A return above 2.0370 would cancel the bearish outlook and restore the upward trend.
The New Zealand dollar remains supported by stable macroeconomic data and expectations that the RBNZ will maintain tight policy longer than the ECB. Meanwhile, the euro faces pressure from weak industrial performance and sluggish recovery across the eurozone. These factors favor further downside for EURNZD.
Following the breakout and confirmation, EURNZD is likely to continue its correction. As long as the price remains below 2.0350, the bias stays bearish with targets at 2.0190, 2.0020, and 1.9860.

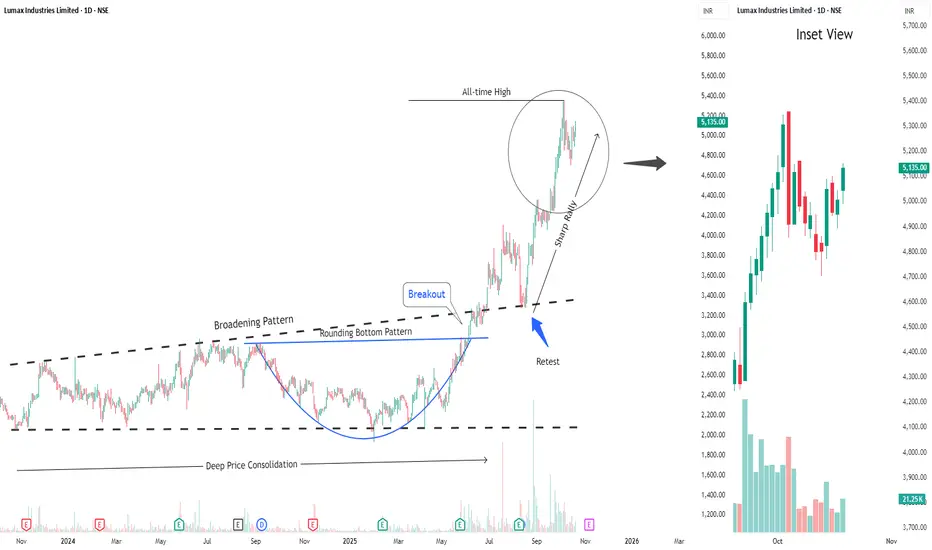
Buy Lumax IndustriesShort Term Trading Advice by Goodluck Capital
Buy Lumax Industries
● Buy Range- 5050 - 5150
● Target- 5350 - 5450
● StopLoss- below 4850
● Upside Potential- 5% -7%
● Approx trade duration 12 - 14 days